http://wrap.warwick.ac.uk/
Original citation:
Zhang, Guohui, Cuharuc, Anatolii S., Güell, Aleix G. and Unwin, Patrick R.. (2015)
Electrochemistry at highly oriented pyrolytic graphite (HOPG) : lower limit for the kinetics
of outer-sphere redox processes and general implications for electron transfer models.
Physical Chemistry Chemical Physics (Number 17). pp. 11827-11838.
Permanent WRAP url:
http://wrap.warwick.ac.uk/67805
Copyright and reuse:
The Warwick Research Archive Portal (WRAP) makes this work of researchers of the
University of Warwick available open access under the following conditions. Copyright ©
and all moral rights to the version of the paper presented here belong to the individual
author(s) and/or other copyright owners. To the extent reasonable and practicable the
material made available in WRAP has been checked for eligibility before being made
available.
Copies of full items can be used for personal research or study, educational, or
not-for-profit purposes without prior permission or charge. Provided that the authors, title and
full bibliographic details are credited, a hyperlink and/or URL is given for the original
metadata page and the content is not changed in any way.
Publisher statement:
First published by Royal Society of Chemistry 2015
http://dx.doi.org/10.1039/C5CP00383K
A note on versions:
The version presented here may differ from the published version or, version of record, if
you wish to cite this item you are advised to consult the publisher’s version. Please see
the ‘permanent WRAP url’ above for details on accessing the published version and note
that access may require a subscription.
Journal Name
RSC
Publishing
ARTICLE
Cite this: DOI: 10.1039/x0xx00000x
Received 00th January 2012, Accepted 00th January 2012
DOI: 10.1039/x0xx00000x
www.rsc.org/
Electrochemistry at Highly Oriented Pyrolytic
Graphite (HOPG): Lower Limit for the Kinetics of
Outer-sphere
Redox
Processes
and
General
Implications for Electron Transfer Models
Guohui Zhang, Anatolii S. Cuharuc, Aleix G. Güell and Patrick R. Unwin
*The electron transfer (ET) kinetics of three redox couples in aqueous solution, IrCl62-/3-, Ru(NH3)63+/2+ and Fe(CN)64-/3-, on different grades of highly oriented pyrolytic graphite (HOPG) have been investigated in a droplet-cell setup. This simple configuration allows measurements to be made on a very short time scale after cleavage of HOPG, so as to minimise possible effects from (atmospheric) contamination, and with minimal, if any, change to the HOPG surface. However, the droplet-cell geometry differs from more conventional electrochemical setups and is more prone to ohmic drop effects. The magnitude of ohmic drop is elucidated by modelling the electric field in a typical droplet configuration. These simulations enable ohmic effects to be minimised practically by optimising the positions of the counter and reference electrodes in the droplet, and by using a concentration ratio of electrolyte to redox species that is higher than used conventionally . It is shown that the ET kinetics for all of the redox species studied herein is fast on all grades of HOPG and lower limits for ET rate constants are deduced. For IrCl62-/3- and Fe(CN)63-/4-, ET on HOPG is at least as fast as on Pt electrodes, and for Ru(NH3)63+/2+ ET kinetics on HOPG is comparable to Pt electrodes. Given the considerable difference in the density of electronic states (DOS) between graphite and metal electrodes, the results tend to suggest that the DOS of the electrode does not play an important role in the ET kinetics of these outer-sphere redox couples over the range of values encompassing HOPG and metals . This can be rationalised because the DOS of all of these different electrode materials is orders of magnitude larger than those of the redox species in solution, so that with strong electronic coupling between the redox couple and electrode (adabatic electron transfer) the electronic structure of the electrode becomes a relatively unimportant factor in the ET kinetics.
Introduction
There is considerable interest in the electrochemical properties of highly oriented pyrolytic graphite (HOPG), at least in part motivated by the close relation of graphite to carbon nanotubes (CNTs) and graphene.1 Understanding similarities and differences in the electrochemical behaviour of graphite, on the one hand, and graphene and CNTs, on the other hand, has great potential to enrich our understanding of electron transfer (ET) at sp2 carbon materials. Moreover, because of the much lower, and strongly potential-dependent, density of electronic states (DOS) of sp2 carbon materials compared to metals,2-4 comparisons between ET kinetics at HOPG and metal electrodes are of significant value in understanding
fundamental ET processes generally. Beyond intrinsic
electrochemical measurements of HOPG, this material has found considerable application as a conductive support (electrode material) in studies of electrodeposition,5-7 for the imaging of biomolecules,8
to introduce defects into the graphite crystal structure, and was reported to result in marked improvement in the kinetics. Yet, it should also be pointed out that these protocols would also serve to clean the HOPG surface, were it contaminated, or to remove poorly contacted graphite/graphene flakes that could be produced in the cleavage process.
In contrast to the above, recent research from our group14, 17, 40-45 and other groups8, 46, 47 for both HOPG and high quality (low defect concentration) single walled carbon nanotubes (SWNTs)48-52 has shown that the basal surface of sp2 carbon materials can support fast ET, particularly for outer-sphere reactions. Notably, studies employing high resolution electrochemical imaging, such as scanning electrochemical cell microscopy (SECCM),53 a localised droplet-based technique, and combined scanning electrochemical microscopy-atomic force microscopy (SECM-AFM),54 allowed the investigation of the electrochemical behaviour of basal plane HOPG
without any influence of step edges.8, 14, 40-42 The freshly cleaved basal plane was found to support fast ET kinetics (indistinguishable from diffusion-controlled), as exemplified by studies of Fe(CN)6
3-/4-
41, 42
and Ru(NH3)63+/2+.8, 41, 42 Subsequent macroscopic measurements of several electrochemical processes on HOPG samples of wide-ranging quality highlighted that ET for outer-sphere and electron-proton coupled reactions is fast at the basal surface.17, 40, 41, 43, 44, 55
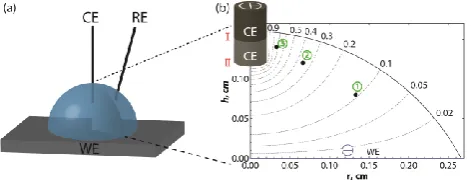
The goal of the present study is to attempt to obtain (lower limit) kinetic values for several key outer-sphere redox processes at HOPG, and to elucidate whether there is any influence of step edge density. We do this by studying three different grades of HOPG, which have a step edge density that varies by more than 2 orders of magnitude. We employ cyclic voltammetry (CV) in a droplet-cell setup (Figure 1(a)). This configuration is particularly suitable due to its simplicity and because minimal manipulation or handling of the sample of interest is required. It is thus suitable for the study of materials such as HOPG22, 56, 57 and carbon nanotube networks.58, 59 This approach contrasts to some other studies, where the HOPG was clamped in a cell to define the area of working electrode,31, 60 which may impose mechanical strain on the rather fragile layered sample, causing damage and structural changes, while also possibly introducing impurities into the solution.
A significant feature of the droplet-cell is that the droplet can be assembled on the working electrode within a short time (~ 3 s), after HOPG surface cleavage, followed by the rapid placement of counter and reference electrodes into the droplet. This allows electrochemical measurements to be carried out on a very short time scale, minimizing the time that elapses between cleavage and electrochemical measurement and reducing possible sources of contamination. We are particularly mindful of the fact that the fresh HOPG surface can be contaminated when exposed to the air (atmospheric contaminants),41, 61 although the effect (if any) and timescale of these on electrochemical processes is not known. The approach herein mitigates such problems in a straightforward and easy way. This is particularly advantageous for some couples, such as Fe(CN)64-/3-, which may be complicated by side processes in certain situations and susceptible to changes in the HOPG surface after cleavage.62 Although macroscopic CV measurements do not offer access to the highest electrode kinetics, the mass transport rates attainable (vide infra) are sufficient to draw meaningful conclusions on the lower limit for ET kinetics at HOPG and to allow comparison of data to that on other electrode materials.
It is also important to point out that the 3-electrode droplet-cell (Figure 1(a)) is rather different from more conventional electrochemical cells. One of the consequences of such an arrangement, as we show from the modelling developed in this work, is a greater possible effect of ohmic drop, which may have an
important influence on the electrochemical response, especially if the concentration of supporting electrolyte is not sufficiently large compared to the concentration of the redox species. Modelling and test measurements allow us to identify conditions where ohmic effects can be minimized for subsequent kinetic analysis.
Experimental section
Materials and Chemicals
Hexaammineruthenium (III) chloride ((Ru(NH3)6Cl3; 99.00%) and potassium hexachloroiridate (IV) (K2IrCl6; 99.99%) were purchased from Strem Chemicals and Aldrich, respectively, while potassium hexacyanoferrate (II) trihydrate (K4Fe(CN)6·3H2O; 99.99%) and potassium chloride (KCl; 99%) were obtained from Sigma-Aldrich. These chemicals were used as received. All the solutions were freshly prepared using water purified with a Millipore Milli-Q system (resistivity 18.2 MΩ cm at 25 °C).
Sample preparation
SPI-3 and ZYB grade HOPG were purchased from SPI Supplies (West Chester, PA) and NT-MDT (Moscow, Russia), respectively. A high quality, but ungraded, HOPG sample was kindly provided by Prof. R. L. McCreery (University of Alberta, Canada), originating from Dr. Arthur Moore, Union Carbide (now GE Advanced Ceramics), and referred to as AM grade HOPG hereafter. Prior to each experiment, the HOPG sample used was cleaved with Scotch tape, by peeling back the top layers to reveal a clean, fresh surface, as used routinely.17, 21-24, 31, 41-44, 55 We have pointed out previously that for AM grade HOPG there is little difference between the apparent quality of HOPG surfaces cleaved mechanically and using Scotch tape, as judged by AFM and capacitance measurements.17, 41
Electrochemistry
Cyclic voltammetry was carried out in a three-electrode configuration using a 760C potentiostat (CH Instruments, Inc.), with the HOPG sample serving as the working electrode (WE), a platinum wire or gauze as the counter electrode (CE) and an AgCl-coated Ag wire as the reference electrode (RE), respectively. Two types of reference electrodes were used, one was bare Ag wire (0.25 mm diameter) coated with AgCl, and one an insulated (24 µm thick PTFE cladding) Ag wire (0.25 mm diameter, Goodfellow, UK) with the exposed end coated with AgCl. Each acted as an Ag/AgCl electrode (potential defined by the KCl concentration in the solution used). A droplet with a volume of 20 µL was placed on the HOPG surface within 3 s of cleavage, with the counter and reference electrodes then placed into the droplet as quickly as possible. The area of HOPG surface covered by the droplet varied very slightly from experiment to experiment but was typically 0.21 cm2. CV measurements started < 1 min from cleavage of the sample, usually at scan rates between 1 V s-1 and 10 V s-1.
Atomic Force Microscopy (AFM)
AFM images were obtained using an Environmental AFM (Enviroscope, Bruker) with Nanoscope IV controller, operated in tapping mode.
Scanning Tunnelling Microscopy (STM)
STM measurements were carried out in air using a Veeco STM (Nanoscope E controller). In order to minimise tip-sample interactions, STM scanning parameters were set to 0.5 nA for the tunneling current and 500 mV for the tunneling bias. All STM images were obtained using mechanically cut Pt-Ir tips.
Comprehensive analyses of uncompensated resistance and practical measures to reduce it in conventional electrochemical cells have been presented in literature.63, 64 However, to the best of our knowledge, a droplet-cell configuration has not yet been studied in this respect. In order to estimate the effect of ohmic drop in a droplet electrochemical cell (Figure 1(a)), we modelled the distribution of the electric field by solving the Laplace equation numerically for the electric potential φ (eq. (1)), within the domain defined by the droplet size, with the boundary conditions defined by eq. (2) - (4):
where Δ is the Laplace operator in cylindrical coordinates, Vsol is the part of the overall potential difference applied between the CE and WE to carry the electrochemical current between the WE and CE, due to the WE reaction, and n is the unit vector normal to a surface (interface). The simulation was performed using the finite element method (FEM) modelling package Comsol Multiphysics 4.1 (Comsol AB, Sweden).
The sizes of the droplet and CE employed were measured under an optical microscope and these dimensions were used in the simulations, but the depths of immersion of the CE and RE in the droplet-cell were more difficult to define and control precisely as they could vary in each experiment. To account for this, we considered several possible (relative) configurations of these electrodes that cover important experimental situations: the RE is far away from or close to the CE (Figure 1(b), positions 1, 2 and 3). Ohmic loss of potential, which we denote by Vu, will be a fraction of
Vsol determined by the position of the RE with respect to WE.63 We idealize the situation by assuming that the RE is dimensionless and thus samples the potential from a point (in the cell), and so does not perturb the electric field of the cell. Placing the CE so that it coincides with the cylindrical axis of the WE/cell geometry (Figure 1(a)), and rendering the RE dimensionless, significantly reduces computational effort by allowing the solution of the Laplace equation in cylindrical coordinates with axial symmetry (2-D geometry) and adequately represents the experimental situation.
Figure 1. (a) Schematic of the droplet-cell setup: WE-working electrode; CE-counter electrode; RE-reference electrode. (b) Simulation of the electric potential distribution inside the droplet-cell (radius r = 0.26 cm and height h = 0.16 cm, volume = 20 μL). A point-size RE probe was placed at three different positions indicated with dots: r/2, h/2 (1); r/4, 3h/4 (2); r/8, 7h/8 (3), and the CE was immersed by h/20 (I) and h/4 (II). Distribution of equipotential
surfaces is given for position II of the CE. Numbers around the domain indicate the fractions of Vsol.
As seen from Table 1, Vu can be significant and strongly depends on the relative position of the CE and RE in the cell. We considered two positions of the CE inside the droplet-cell – 1/20 (position I) and 1/4 (position II) of the droplet height, measured from the top liquid/air boundary (Figure 1(b)). Values for Vu along with the corresponding uncompensated resistance, Ru, were estimated on the basis that the peak current, ip, on a CV recorded at 10 V s-1 amounts to ca. 120 μA for a redox mediator concentration of 0.25 mM (vide infra). It was determined from the simulation that the magnitude of
Vsol required to pass this current through the droplet-cell containing 0.1 M KCl (σ(25°C) = 0.013 S cm-1)65 was 78 mV for the CE placed at position I and 43 mV for CE at position II. Then Ru is simply
Vu/ip.
In general, as the RE is moved from position 1 to 3 (move away from the WE towards the CE), the ohmic loss increases significantly, for both CE positions considered, as expected based on the field lines shown in Figure 1(b). Interestingly, as evident from Table 1, when the CE is held at position I (further from the WE), the total cell resistance increases dramatically and, thus, a higher voltage between the CE and WE, Vsol, would be required to overcome it. However, Vu is smaller for all positions of the RE considered than for the CE at position II (closer to the WE). This is because the gradient of electric field is steepest close to the CE, and the CE-to-RE separation is always larger for CE position I than for CE position II. This overrides the effect of the increase in net cell resistance for CE position I.
Table 1. Ohmic loss of potential and respective uncompensated resistance at different positions of CE and RE, for a current of 120 µA passing through the cell geometry shown in Figure 1, with 0.1 M KCl.
CE pos.
RE pos.
I
Vsol = 78 mV
II
Vsol = 43 mV
Vu / mV Ru / Ω Vu / mV Ru / Ω
1 3 22 5 38
2 9 73 15 125
3 20 167 31 258
Thus, the RE should be kept as far away as possible from the CE but close to the WE. This is in agreement with the conventional electrochemical cell arrangement, which ensures that RE intercepts with equipotential lines corresponding very closely to the potential difference that actually drives an electrochemical reaction.63 In general, in contemporary studies in aqueous electrolyte solutions at typical cell current,66 the electrochemical response is relatively immune to the RE placement. However, it is particularly important for the droplet-cell arrangement where ohmic effects are clearly magnified.
Experimental results
Assessment of ohmic loss of potential
We first carried out some test measurements to optimise the cell configuration, so as to both highlight, and minimise, ohmic effects,
∆𝜑 = 0 (1)
𝜑 = 𝑉𝑠𝑜𝑙, on the anode (2)
𝜑 = 0, on the cathode (3)
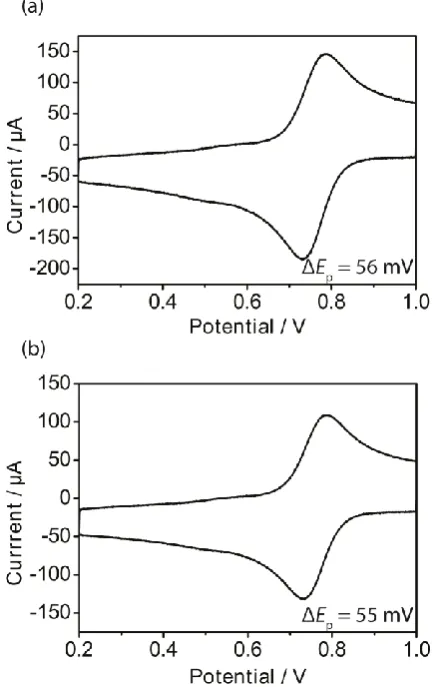
[image:4.595.302.556.401.537.2] [image:4.595.58.294.543.633.2]in light of the simulation results presented above. In Figure 2, a set of CVs of the electrochemical reduction of 0.25 mM Ru(NH3)6
3+ in 0.1 M KCl is presented to expose the variability in the peak-to-peak separation (ΔEp) that may result between different cell setups, where the CE and RE were simply placed into the droplet-cell. Although the general behaviour in the Figures 2(a) and 2(b) is similar, the peak-to-peak separation at 10 V s-1 differs quite significantly with values of 80 mV (Figure 2(a)) and 93 mV (Figure 2(b)), and both values are far from that for a reversible process (59 mV), which might have been expected in light of nanoscale measurements that report k0 ~ 9 cm s-1 for this couple on freshly cleaved HOPG.8 Similar variability was also found with IrCl62-/3- under the same concentration conditions (see Supplementary Information, Figure S1). Furthermore, in studies of a range of concentrations of Ru(NH3)6
3+
, i.e. 0.1, 0.25, 0.5, and 1 mM, in 0.1 M KCl, corresponding to a ratio between the concentration of supporting electrolyte and redox-active species of 1000, 400, 200 and 100, respectively, a significant increase in peak-to-peak separation with increase of redox-active mediator concentration was seen. Typical CVs are shown in Figure 3(a), in which ΔEp at 10 V s-1 increases from 64 mV to 170 mV as the concentration of mediator is increased from 0.1 mM to 1 mM. As with the data in Figure 2 and Figure S1, these would all, again, be regarded as reasonable concentrations of redox-active species and ratios of electrolyte to redox-active species concentration in conventional cells.67 However, as with the data in Figure 1 and Table 1, these results highlight the need to use rather extreme electrolyte to redox-active species concentrations in droplet-cell kinetic measurements, and the importance of RE and CE placement.
Figure 2. Cyclic voltammograms for the reduction of 0.25 mM Ru(NH3)63+ in 0.1 M KCl supporting electrolyte obtained on freshly cleaved AM grade HOPG in 2 different droplet-cells. Scan rates: 1 (smallest current), 2, 3, 4, 5, 6, 7, 8, 9 and 10 (biggest current) V s-1. The ΔEp values indicated are the peak-to-peak separations at 10 V s -1
.
Figure 3. (a) Cyclic voltammograms for the reduction of different concentrations of Ru(NH3)6
3+
in a supporting electrolyte of 0.1 M KCl, on freshly cleaved AM grade HOPG, at 10 V s-1; (b) Cyclic voltammograms of 0.25 mM Ru(NH3)63+ in supporting electrolyte of 1 M or 0.1 M KCl on AM or SPI-3 HOPG, recorded at a scan rate of 10 V s-1, with ΔEp indicated.
In order to diminish the dependence of the voltammetric response on the cell configuration, a larger concentration of supporting electrolyte, 1 M KCl (instead of 0.1 M), was used for the kinetic measurements herein, since this increases the conductivity of the solution by approx. 9 times (σ(25°C) = 0.11 S cm-1
).65 As evidenced by Figure 3(b), where 0.25 mM Ru(NH3)6
3+
[image:5.595.318.536.123.474.2] [image:5.595.57.269.374.714.2]only at the end) was put as close to the WE but as far away from the CE as possible, unless otherwise stated. Note that there was indistinguishable difference in the cyclic voltammograms when either platinum wire or gauze electrode was used, and thus a platinum wire was adopted as the CE throughout.
Kinetic measurements
[image:6.595.63.223.171.567.2]Three different redox couples, Ru(NH3)63+/2+, IrCl62-/3-, and Fe(CN)63-/4-, were employed together with high and low quality HOPG samples (AM, ZYB and SPI-3).
Figure 4. 4 × 4 µmAFM images of (a) AM, (b) ZYB and (c) SPI-3 grade HOPG surfaces. Note the difference in height scales for (a), (b) and (c).
As evident from Figure 4, AM, ZYB, and SPI-3 grades of HOPG give surfaces with a wide range of distinct step edge density. AM HOPG is mainly covered by the basal plane surface with low step coverage (ca. 0.09 %),41 ZYB has more step edges (0.3-0.8 %),55 while SPI-3 HOPG is covered by the most step edges (ca. 30 %).41, 55, 68
Cyclic voltammetry was carried out at scan rates from 1 V s-1 to 10 V s-1. Assuming D ~ 10-5 cm2 s-1, this corresponds to mass transport coefficients in the range of 0.0088-0.028 cm s-1 (based on
the calculated current density from the Randles-Sevcik equation69). This is a reasonable range to at least make a comparison of the ET kinetics of HOPG to other materials, if the DOS of the electrode material were to be important.
Values of k0 were estimated from Nicholson’s method.70, 71 For a reduction process: Ox + ne-→Red, the following equation applies:
/2 Ox
0 Ox
Red
D nF
k D
D RT
(5)
where ψ is a dimensionless kinetic parameter, determined by ΔEp on Nicholson’s working curve,70, 71 D
Ox and DRed are the diffusion coefficients for the oxidized and reduced forms of the redox species, respectively, v is the scan rate, α is the transfer coefficient and other parameters have their usual meanings.
We first consider IrCl62-/3-. We found ΔEp of 56 ± 1 mV (n = 3) at all scan rates up to 10 V s-1 on both AM and SPI-3 HOPG, respectively (with two example CVs at 10 V s-1 shown in Figure 5). This indicates that the process is reversible even at this scan rate. Considering that for a reversible reaction we can assign a minimum
ψ > 20 (ΔEp < 61 mV), with D ≈ DOx ≈ DRed = 7.5 × 10 -6
cm2 s-1,72k0 can be estimated to be > 1.9 cm s-1. This is at least as high as the k0 measured for this mediator on Pt (1.9 cm s-1) by a radial flow microring electrode.72
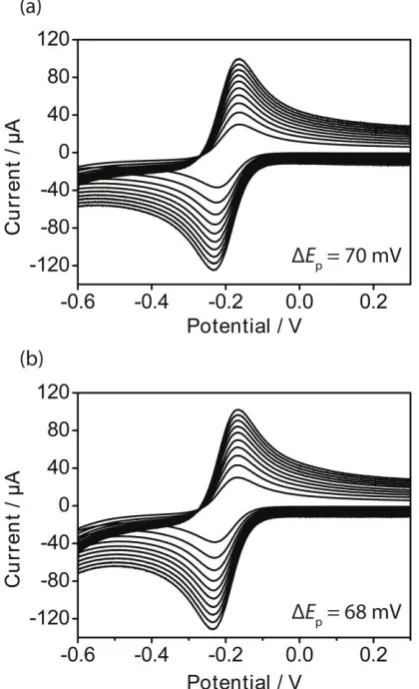
[image:6.595.319.538.304.648.2]In the case of Ru(NH3)63+ reduction, ΔEp changed from 61 ± 1 mV for v = 1 V s-1 to 70 ± 1 mV for v = 10 V s-1 on AM HOPG (Figure 6(a)), with 5 replicates (separate runs on freshly cleaved HOPG) carried out, while the voltammograms at the ZYB surface (Figure 6(b)) had ΔEp of 68 ± 1 mV at 10 V s-1, with good reproducibility across different HOPG samples (see Supplementary Information, Figures S2 and S3). The dimensionless parameter, ψ, determined from ΔEp, shows a good linear trend with the reciprocal of the square root of the scan rate, v-1/2, as expected from eq. (5) and
k0, calculated from the slope of the line fitted to experimental data at AM HOPG (Figure 7) as an example, using D = 8 × 10⁻⁶ cm2 s-1,73 was 0.61 ± 0.02 cm s-1. In consideration of our analysis of ohmic effects on the droplet-cell, the small difference in the values of ΔEp from the reversible limit, and other recent precautionary work on the danger of over-analysis of CV data close to this limit,66 we consider this to be a lower limit for k0 on HOPG.
Figure 6. Cyclic voltammograms for the reduction of 0.25 mM Ru(NH3)63+ on freshly cleaved (a) AM and (b) ZYB HOPG, with 1 M KCl as the supporting electrolyte. Scan rates: 1 (smallest current), 2, 3, 4, 5, 6, 7, 8, 9 and 10 (biggest current) V s-1. The ΔEp values stated are the peak-to-peak separations at 10 V s-1.
Figure 7. Plot of peak-to-peak separation, ΔEp, and kinetic parameter ψ versus the reciprocal of the square root of the scan rate (v-1/2) for a solution containing 0.25 mM Ru(NH3)63+, with a supporting electrolyte of 1 M KCl. The data shown here were obtained on freshly cleaved AM HOPG.
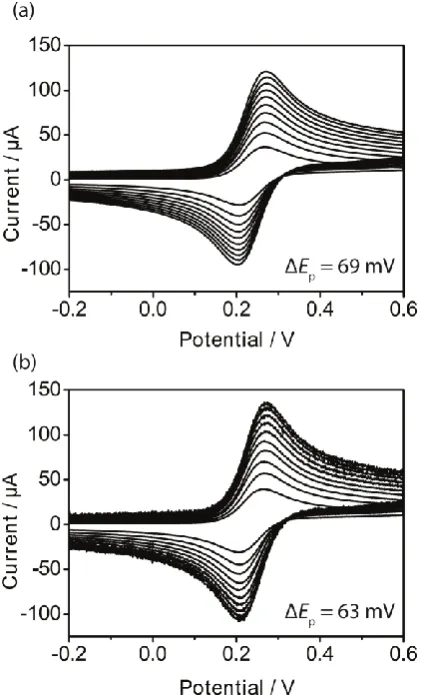
Voltammetry for the oxidation of Fe(CN)6
[image:7.595.315.540.65.221.2] [image:7.595.61.271.230.575.2]Figure 8. Typical cyclic voltammograms for the oxidation of 0.25 mM Fe(CN)64- in 1 M KCl on freshly cleaved (a) AM and (b) SPI-3 HOPG, respectively. Scan rates: 1 (smallest current), 2, 3, 4, 5, 6, 7, 8, 9 and 10 (biggest current) V s-1. The numbers indicated are the peak-to-peak separations at 10 V s-1.
Figure 9. Plot of peak-to-peak separation, ΔEp, and kinetic parameter ψ versus the reciprocal of the square root of the scan rate (v-1/2) for a solution containing 0.25 mM Fe(CN)64-, with a supporting electrolyte of 1 M KCl, respectively. The data shown here were obtained on freshly cleaved AM HOPG.
Discussion
As highlighted at the start of this paper, carbon materials are increasingly prominent as electrodes, in myriad applications, and a fundamental understanding of the origin of the ET activity is thus of great importance. Among carbon electrodes, the ultra-low activity of the basal surface of HOPG originated in arguments from McCreery’s group23, 24 that were widely adopted and amplified by other groups.2, 78-80
One rationale for this view is that HOPG has a low DOS at the Fermi level, ca. 2.2 × 10⁻³ states atom-1 eV-1,3, 4 which is about two orders of magnitude lower than those on metals (e.g. 0.28 states atom-1 eV-1 for Au).81 That the DOS could be important in outer-sphere ET processes at carbon electrodes relies on models mainly for semiconductors, for example, as developed by Gerischer82 and Doganadze and Levich.83 An important consideration is whether the DOS of an electrode is sufficiently low compared to the density of states of the solution species for the electrode kinetics for outer-sphere redox processes to depend on the electronic structure of the electrode.69, 84
In this study, nearly identical electrochemical behaviour has been seen for all the redox couples, IrCl6
2-/3-, Ru(NH3)6 3+/2+
, and Fe(CN)6
4-
/3-, on different grades of HOPG/3-, with step edge density spanning 2 orders of magnitude. We expect higher DOS for SPI-3 grade HOPG than AM grade, due to the enhanced DOS at zigzag edges,85-87 and so these data tend to suggest that the electronic structure of the HOPG electrodes does not influence the ET kinetics. However, it is important to point out that all the reactions are close to the reversible limit, making an unequivocal assignment difficult.
[image:8.595.64.275.54.402.2] [image:8.595.55.278.471.629.2]that such defects are rare and extremely difficult to find on cleaved HOPG surfaces, e.g. a recent STM study with more than 100 scans failed to find any point defects in the basal plane.99 Likewise, for the study herein, we also carried out STM measurements on AM grade HOPG, with > 100 images (each of 10 × 10 nm2) obtained in randomly selected areas. We could not find a single defect in any of the images (e.g. Figure 11).
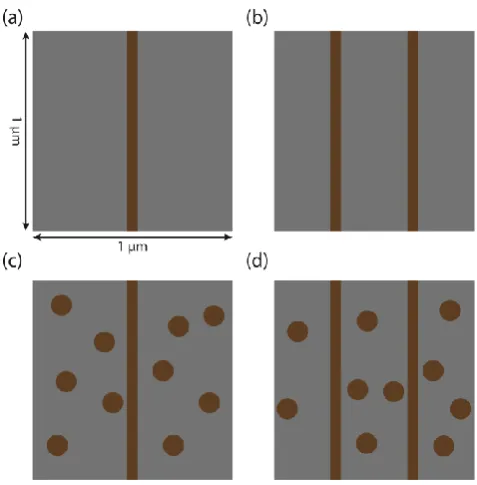
Figure 10. Schematic illustrating active site (defect) densities on an area of 1 µm2 at an HOPG surface (not to scale). Active sites (exaggerated size) are in brown and inactive areas are grey. (a)-(b) strip type only; (c)-(d) strip type plus point defect type. The strip width is either 1 or 5 nm, and the radius of point defects is 5 nm. The
strip densities are higher than on typical AM HOPG.
Figure 11. UnfilteredSTM atomic resolution image (10 × 10 nm2) of AM grade HOPG.
We take the data for Fe(CN)63-/4- on AM HOPG (k0 > 0.46 cm s-1) herein, as an example, as this has been the most used redox couple to show slow or no ET on the basal plane surface in previous studies.21, 22, 24-28, 31, 91
For the situation where active sites on the surface are closely spaced compared to the diffusion field (concentration boundary) normal to the WE, which is reasonable for the analysis herein, we can write k0 = ks*f,93, 100 where ks is the standard ET rate constant at the defect and f is the active site fractional surface coverage. The ks values calculated for different active site arrangements are summarized in Table 2. It is found that if activity was confined to defects, the minimum ks values at graphite defects would have to be orders of magnitude higher than k0 on any metal electrode. Even for the most defective surface, with 2 strips (each 5 nm wide) and 10 point defects in a 1 m2 area, ks is still > 2 orders of magnitude higher than measured at Au and Pt electrodes.72, 75, 90 Thus, as we have pointed out,1, 14, 17, 40-45, 55 and as is clear from high resolution electrochemical imaging, the scenario of entirely
defect-Table 2. Predicted minimum heterogeneous rate constant of Fe(CN)6
if the redox reaction were confined to defects, with different active site arrangements on an HOPG surface.a
Active site
arrangementb 1 strip 2 strips
1 strip + 0.1 point defects
2 strips + 0.1 point defects
1 strip + 10 point defects
2 strips + 10 point defects
Strip width
(nm) 1 5 1 5 1 5 1 5 1 5 1 5
Active site
coverage ƒ (%) 0.1 0.5 0.2 1 0.100785 0.500785 0.200785 1.000785 0.1785 0.5785 0.2785 1.0785
Expected minimum ET rate constant at
active site, ks (cm s-1)
460 92 230 46 456 92 229 46 258 80 165 43
[image:9.595.348.537.70.232.2] [image:9.595.43.282.150.393.2] [image:9.595.41.562.531.716.2]driven activity does not stand up to scrutiny.
There is some prior work on the relative unimportance of the DOS in controlling the ET kinetics of outer-sphere redox processes at electrodes. Thus, it was found that on nine different metal electrodes the k0 for Ru(NH3)63+/2+ (in the range of 0.67 – 1.29 cm s-1) was not proportional to DOS (that varied by one order of magnitude across the different metals studied).89, 90, 101, 102 The studies herein extend the DOS of the electrode to lower values (by one-two orders of magnitude compared to the metal electrodes) and yet the reported k0 values for HOPG are at least as large as those on the metals.89, 90, 101, 102
We further note that the kinetics for FcCH2OH and Ru(NH3)63+ in aqueous solution on Au and Pt nanoelectrodes was studied using scanning electrochemical microscopy (SECM).103 The k0 for FcCH2OH oxidation in aqueous solution on Au (8 ± 1 cm s-1) was very close to that on Pt (6.8 ± 0.7 cm s-1), while the DOS on Pt is ~ 7.5 times that of Au.104 Although argued otherwise,105 this would reasonably indicate that the overall DOS had no direct effect on the ET kinetics and the reaction was adiabatic. For Ru(NH3)63+/2+ on Au and Pt, k0 was considered to be statistically higher on Pt (17.0 ± 0.9 cm s-1) than on Au (13.5 ± 2 cm s-1).103 However, it should be pointed out that although SECM with nanoelectrodes provides much higher mass transport than other techniques,101 enabling the measurement of ultra-fast electrode kinetics, such measurements require great care, as nanoelectrodes may be damaged easily by electrostatic discharge and electrochemical etching.106 This type of damage is not necessarily manifest in the SECM or the steady-state voltammetric response. Thus, without safeguards, and thorough characterisation of the SECM tip by complementary microscopy techniques like scanning electron microscopy or AFM, there is a danger that erroneous conclusions may be drawn from experimental data obtained with nanoelectrodes.
Although it was suggested that the higher k0 for Ru(NH3)63+/2+ on Pt compared to macroscopic electrodes could be due to diffuse double layer (Frumkin) effects, which may be more pronounced on nanoscale electrodes,78 it is interesting to note that the highest reported k0 values for Ru(NH3)6
3+/2+
on distinctly different electrodes are – in fact - rather similar, e.g. 10 ± 5 cm s-1 on metallic single walled carbon nanotubes,49 9 cm s-1 on the basal surface of HOPG (free from defects),8 9 – 10cm s-1 on reduced graphene oxide,78 13.5 ± 2 cm s-1 on Au and 17.0 ± 0.9 cm s-1 on Pt.103 This similarity in values is especially striking in view of the large difference in DOS, electronic structure and the different electrode configurations studied experimentally. Likewise, there is now strong evidence that k0 for Fe(CN)6
is rather similar on very different electrodes, in the range of 0.3 – 0.5 cm s-1 on Pt,72, 89 0.2 –0.4 cm s-1 on Au89, 107 and 0.7 – 1.0 cm s-1 on reduced graphene oxide78 and > 0.46 cm s-1 on HOPG (data herein).
In summary, our data suggest that the kinetics of the 3 redox couples studied herein are broadly comparable on HOPG and metal electrodes that have a much higher DOS. That the DOS is unimportant in determining the ET kinetics of outer-sphere redox processes is reasonable if there is strong electronic coupling of the redox species to the electrode and the DOS of the electrode material is orders of magnitude higher than that of the redox species.69, 84 For the experimental conditions of this study (which are not uncommon), one can estimate that the DOS of Ru(NH3)63+/2+ in the solution is of order of 1014 states eV-1 cm-3, whereas that of HOPG at the potential of zero charge (close to the potential of the Ru(NH3)63+/2+ couple) is of the order of 1020 states eV-1 cm-3.3 The DOS of the redox species in solution is the sum of DOS due to Ox and Red molecules and is a function of energy ε as given by108
Dredox(ε) = COxWOx(ε) + CRedWRed(ε) (6)
where Ci is the concentration of species i of the redox couple (Ox or
Red), and Wi is the probability density of the electronic states in
solution defined by eq. (7) for the Red and by eq. (8) for the Ox forms:
2
Red Red Red
Red
1
( ) exp[ ( ) / 4 ]
4
W kT
kT
(7)
2
Ox Ox Ox
Ox
1
( ) exp[ ( ) / 4 ]
4
W kT
kT
(8)
Here, λi is the reorganization energy for Red or Ox, and εi is the most
probable energy level of the solution states that is related to the standard Fermi level of redox species, F(RedOx)0 , via eq. (9) for the Red form and eq. (10) for the Ox form:
0
Red F(RedOx) Red
(9)
0
Ox F(RedOx) Ox
(10)
In turn, the standard Fermi level of redox couple is simply an “energy equivalent” of the standard redox potential, E0:
F(RedOx)0 eE0 (11) The other symbols in eq. (8) are the Boltzmann constant, k, and absolute temperature, T.
For Ru(NH3)63+/2+, the Red and Ox forms are similar and so we may reasonably write λRed = λOx = 0.82 eV.
109
Considering the case of equal concentrations COx = CRed ≈ 5 × 10⁻⁷ mol cm-3 for the sake of simplicity (and ignoring possible double layer effects on near interface concentrations, which is reasonable for this orders of magnitude calculation), one finds that Dredox 10
14
states eV-1 cm-3 in the region around E0 of Ru(NH3)63+/2+ as was given above.
Conclusions
The ET kinetics of three benchmark redox couples, IrCl62-/3-, Ru(NH3)63+/2+ and Fe(CN)63-/4-, have been investigated in a droplet-cell assembled on freshly cleaved HOPG (within 3 s of cleavage), of different grades, with step edge density spanning up to 2 orders of magnitude. The processes are fast and close to reversible on all surfaces, even at a scan rate of 10 V s-1. We have been able to extract a lower limit for the ET rate constants, taking account of ohmic resistance relevant to the droplet-cell experimental arrangement and identifying means of minimising its influence. This was achieved by modelling the electric field in the droplet-cell and optimising experimental conditions as a consequence.
faster at HOPG, bearing in mind the secondary factors mentioned, and the different aqueous (and double layer) structures at hydrophobic HOPG compared to metals such as Pt. Along with our other recent work, outlined herein and elsewhere,1 the studies herein develop the new perspective for the high activity of the HOPG basal surface for simple outer-sphere and other redox processes. For related sp2 carbon materials, particularly (monolayer) graphene, where the DOS is much lower (and theoretically zero at the Fermi level), an interesting issue to be explored is whether the electronic structure impacts on the ET kinetics for these outer-sphere redox couples.
Acknowledgements
This work was supported by the European Research Council (ERC-2009-AdG 247143-QUANTIF). G.Z and A.S.C. acknowledge support by Chancellor’s International Scholarships at the University of Warwick. Some equipment used in this research was obtained through Birmingham Science City with support from Advantage West Midlands and the European Regional Development Fund.
Notes and references
Department of Chemistry, University of Warwick, Coventry, CV4 7AL, UK.
*
† Electronic Supplementary Information (ESI) available: [details of any supplementary information available should be included here]. See DOI: 10.1039/b000000x/
1 P. R. Unwin, Faraday Discuss., 2014, 172, 521-532. 2 R. L. McCreery, Chem. Rev., 2008, 108, 2646-2687.
3 H. Gerischer, R. McIntyre, D. Scherson and W. Storck, J. Phys. Chem., 1987, 91, 1930-1935.
4 H. Gerischer, J. Phys. Chem., 1985, 89, 4249-4251.
5 F. Gloaguen, J. M. Léger, C. Lamy, A. Marmann, U. Stimming and R. Vogel, Electrochim. Acta, 1999, 44, 1805-1816.
6 M. P. Zach, K. H. Ng and R. M. Penner, Science, 2000, 290, 2120-2123. 7 R. M. Penner, J. Phys. Chem. B, 2002, 106, 3339-3353.
8 P. L. Frederix, P. D. Bosshart, T. Akiyama, M. Chami, M. R. Gullo, J. J. Blackstock, K. Dooleweerdt, N. F. de Rooij, U. Staufer and A. Engel,
Nanotechnology, 2008, 19, 384004.
9 A. A. Gorodetsky and J. K. Barton, J. Am. Chem. Soc., 2007, 129, 6074-6075.
10 A. A. Gorodetsky and J. K. Barton, Langmuir, 2006, 22, 7917-7922. 11 A. M. Oliveira Brett and A.-M. Chiorcea, Langmuir, 2003, 19,
3830-3839.
12 F. Rose, P. Martin, H. Fujita and H. Kawakatsu, Nanotechnology, 2006, 17, 3325.
13 P. Allongue, M. Delamar, B. Desbat, O. Fagebaume, R. Hitmi, J. Pinson and J.-M. Savéant, J. Am. Chem. Soc., 1997, 119, 201-207.
14 P. M. Kirkman, A. G. Güell, A. S. Cuharuc and P. R. Unwin, J. Am.
Chem. Soc., 2014, 136, 36-39.
15 M. Tanaka, T. Sawaguchi, Y. Sato, K. Yoshioka and O. Niwa, Langmuir, 2010, 27, 170-178.
16 E. Kibena, M. Marandi, V. Sammelselg, K. Tammeveski, B. B. E. Jensen, A. B. Mortensen, M. Lillethorup, M. Kongsfelt, S. U. Pedersen and K. Daasbjerg, Electroanalysis, 2014.
17 G. Zhang, P. M. Kirkman, A. N. Patel, A. S. Cuharuc, K. McKelvey and P. R. Unwin, J. Am. Chem. Soc., 2014, 136, 11444-11451.
18 Y. Surendranath, D. A. Lutterman, Y. Liu and D. G. Nocera, J. Am.
Chem. Soc., 2012, 134, 6326-6336.
19 Y. Zhou, T. Holme, J. Berry, T. R. Ohno, D. Ginley and R. O’Hayre, J.
Phys. Chem. C, 2009, 114, 506-515.
20 A. R. Kucernak, P. B. Chowdhury, C. P. Wilde, G. H. Kelsall, Y. Y. Zhu and D. E. Williams, Electrochim. Acta, 2000, 45, 4483-4491.
21 R. J. Rice and R. L. McCreery, Anal. Chem., 1989, 61, 1637-1641.
22 M. T. McDermott, K. Kneten and R. L. McCreery, J. Phys. Chem., 1992, 96, 3124-3130.
23 K. R. Kneten and R. L. McCreery, Anal. Chem., 1992, 64, 2518-2524. 24 K. K. Cline, M. T. McDermott and R. L. McCreery, J. Phys. Chem.,
1994, 98, 5314-5319.
25 T. J. Davies, R. R. Moore, C. E. Banks and R. G. Compton, J.
Electroanal. Chem., 2004, 574, 123-152.
26 C. E. Banks, R. R. Moore, T. J. Davies and R. G. Compton, Chem.
Commun., 2004, 1804-1805.
27 T. J. Davies, M. E. Hyde and R. G. Compton, Angew. Chem. Int. Ed., 2005, 44, 5121-5126.
28 C. E. Banks, T. J. Davies, G. G. Wildgoose and R. G. Compton, Chem.
Commun., 2005, 829-841.
29 X. Ji, C. E. Banks, A. Crossley and R. G. Compton, ChemPhysChem, 2006, 7, 1337-1344.
30 C.-Y. Lee and A. M. Bond, Anal. Chem., 2008, 81, 584-594.
31 R. J. Bowling, R. T. Packard and R. L. McCreery, J. Am. Chem. Soc., 1989, 111, 1217-1223.
32 R. L. McCreery and M. T. McDermott, Anal. Chem., 2012, 84, 2602-2605.
33 M. Lu and R. G. Compton, Analyst, 2014, 139, 4599-4605.
34 X. Ji, C. E. Banks, W. Xi, S. J. Wilkins and R. G. Compton, J. Phys.
Chem. B, 2006, 110, 22306-22309.
35 R. G. Compton and C. E. Banks, eds., Understanding Voltammetry, 2nd edn., Imperial College Press, London, 2011.
36 D. A. C. Brownson and C. E. Banks, The Handbook of Graphene
Electrochemistry, Springer, London, 2014.
37 M. Pumera, Chem. Rec., 2009, 9, 211-223. 38 M. Pumera, Chem. Eur. J., 2009, 15, 4970-4978.
39 C. E. Banks, T. J. Davies, G. G. Wildgoose and R. G. Compton, Chem.
Commun., 2005, 41, 829-841.
40 A. N. Patel, K. McKelvey and P. R. Unwin, J. Am. Chem. Soc., 2012, 134, 20246-20249.
41 A. N. Patel, M. G. Collignon, M. A. O'Connell, W. O. Hung, K. McKelvey, J. V. Macpherson and P. R. Unwin, J. Am. Chem. Soc., 2012, 134, 20117-20130.
42 S. C. S. Lai, A. N. Patel, K. McKelvey and P. R. Unwin, Angew. Chem.
Int. Ed., 2012, 51, 5405-5408.
43 A. N. Patel, S. Y. Tan and P. R. Unwin, Chem. Commun., 2013, 49, 8776-8778.
44 M. A. Edwards, P. Bertoncello and P. R. Unwin, J. Phys. Chem. C, 2009, 113, 9218-9223.
45 C. G. Williams, M. A. Edwards, A. L. Colley, J. V. Macpherson and P. R. Unwin, Anal. Chem., 2009, 81, 2486-2495.
46 A. Anne, E. Cambril, A. Chovin, C. Demaille and C. Goyer, ACS Nano, 2009, 3, 2927-2940.
47 S. Lhenry, Y. R. Leroux and P. Hapiot, Anal. Chem., 2012, 84, 7518-7524.
48 I. Heller, J. Kong, H. A. Heering, K. A. Williams, S. G. Lemay and C. Dekker, Nano Lett., 2004, 5, 137-142.
49 A. G. Güell, K. E. Meadows, P. V. Dudin, N. Ebejer, J. V. Macpherson and P. R. Unwin, Nano Lett., 2014, 14, 220-224.
50 J. C. Byers, A. G. Güell and P. R. Unwin, J. Am. Chem. Soc., 2014, 136, 11252-11255.
51 A. G. Güell, K. E. Meadows, P. V. Dudin, N. Ebejer, J. C. Byers, J. V. Macpherson and P. R. Unwin, Faraday Discuss., 2014, 172, 439-455. 52 B. L. Corso, I. Perez, T. Sheps, P. C. Sims, O. T. Gül and P. G. Collins,
Nano Lett., 2014, 14, 1329-1336.
53 N. Ebejer, A. G. Güell, S. C. S. Lai, K. McKelvey, M. E. Snowden and P. R. Unwin, Annu. Rev. Anal. Chem., 2013, 6, 329-351.
54 J. V. Macpherson and P. R. Unwin, Anal. Chem., 2000, 72, 276-285. 55 A. N. Patel, S. Y. Tan, T. S. Miller, J. V. Macpherson and P. R. Unwin,
Anal. Chem., 2013, 85, 11755-11764.
56 R. Bowler, T. J. Davies, M. E. Hyde and R. G. Compton, Anal. Chem., 2005, 77, 1916-1919.
57 R. L. McCreery, Chem. Rev., 2008, 108, 2646-2687.
58 P. Bertoncello, J. P. Edgeworth, J. V. Macpherson and P. R. Unwin, J.
Am. Chem. Soc., 2007, 129, 10982-10983.
59 A. G. Güell, K. E. Meadows, P. R. Unwin and J. V. Macpherson, Phys.
Chem. Chem. Phys., 2010, 12, 10108-10114.
61 Z. Li, Y. Wang, A. Kozbial, G. Shenoy, F. Zhou, R. McGinley, P. Ireland, B. Morganstein, A. Kunkel, S. P. Surwade, L. Li and H. Liu,
Nat. Mater., 2013, 12, 925-931.
62 C. M. Pharr and P. R. Griffiths, Anal. Chem., 1997, 69, 4673-4679. 63 J. C. Myland and K. B. Oldham, Anal. Chem., 2000, 72, 3972-3980. 64 K. B. Oldham and N. P. C. Stevens, Anal. Chem., 2000, 72, 3981-3988. 65 D. R. Lide, ed., CRC Handbook of Chemistry and Physics, CRC Press,
USA, 2001.
66 A. N. Simonov, G. P. Morris, E. A. Mashkina, B. Bethwaite, K. Gillow, R. E. Baker, D. J. Gavaghan and A. M. Bond, Anal. Chem., 2014, 86, 8408-8417.
67 E. J. F. Dickinson, J. G. Limon-Petersen, N. V. Rees and R. G. Compton,
J. Phys. Chem. C, 2009, 113, 11157-11171.
68 A. N. Patel, S. Y. Tan and P. R. Unwin, Chem. Commun., 2013, 49, 8776-8778.
69 A. J. Bard and L. R. Faulkner, Electrochemical Methods: Fundamentals
and Applications, 2nd edn., John Wiley& Sons, Inc., New York, 2001.
70 R. S. Nicholson, Anal. Chem., 1965, 37, 1351-1355.
71 W. Li, C. Tan, M. A. Lowe, H. D. Abruña and D. C. Ralph, ACS Nano, 2011, 5, 2264-2270.
72 J. V. Macpherson, C. E. Jones and P. R. Unwin, J. Phys. Chem. B, 1998, 102, 9891-9897.
73 S. Chen and A. Kucernak, J. Phys. Chem. B, 2002, 106, 9396-9404. 74 J. V. Macpherson, M. A. Beeston and P. R. Unwin, J. Chem. Soc.,
Faraday Trans., 1995, 91, 899-904.
75 C. Beriet and D. Pletcher, J. Electroanal. Chem., 1994, 375, 213-218. 76 C. Beriet and D. Pletcher, J. Electroanal. Chem., 1993, 361, 93-101. 77 S. A. Campbell and L. M. Peter, J. Electroanal. Chem., 1994, 364,
257-260.
78 B. Zhang, L. Fan, H. Zhong, Y. Liu and S. Chen, J. Am. Chem. Soc., 2013, 135, 10073-10080.
79 S. Banerjee, J. Shim, J. Rivera, X. Jin, D. Estrada, V. Solovyeva, X. You, J. Pak, E. Pop, N. Aluru and R. Bashir, ACS Nano, 2012, 7, 834-843. 80 T. Kamata, D. Kato, S. Hirono and O. Niwa, Anal. Chem., 2013, 85,
9845-9851.
81 K. Kokko, E. Ojala and K. Mansikka, Phys. Status. Solidi. B, 1989, 153, 235-241.
82 H. Gerischer, ed., Physical Chemistry, an Advanced Treatise, Academic Press, New York, 1970.
83 V. G. Levich, ed., Advances in Electrochemistry and Electrochemical
Engineering, Wiley Interscience, New York, 1966.
84 S. Chen, Y. Liu and J. Chen, Chem. Soc. Rev., 2014, 43, 5372-5386. 85 Y. Niimi, T. Matsui, H. Kambara, K. Tagami, M. Tsukada and H.
Fukuyama, Phys. Rev. B, 2006, 73, 085421.
86 Y. Kobayashi, K. Kusakabe, K.-i. Fukui and T. Enoki, Physica E, 2006, 34, 678-681.
87 Y. Kobayashi, K.-i. Fukui, T. Enoki and K. Kusakabe, Phys. Rev. B, 2006, 73, 125415.
88 J. López-Palacios, A. Heras, Á. Colina and V. Ruiz, Electrochim. Acta, 2004, 49, 1027-1033.
89 T. Iwasita, W. Schmickler, J. Herrmann and U. Vogel, J. Electrochem. Soc., 1983, 130, 2026-2032.
90 E. Santos, T. Iwasita and W. Vielstich, Electrochim. Acta, 1986, 31, 431-437.
91 M. T. McDermott and R. L. McCreery, Langmuir, 1994, 10, 4307-4314. 92 R. McCreery, A. Bergren, A. Morteza-Najarian, S. Y. Sayed and H. Yan,
Faraday Discuss., 2014, 172, 9-25.
93 C. Amatore, J. M. Savéant and D. Tessier, J. Electroanal. Chem., 1983, 147, 39-51.
94 P. Ruffieux, M. Melle-Franco, O. Gröning, M. Bielmann, F. Zerbetto and P. Gröning, Phys. Rev. B, 2005, 71, 153403.
95 J. R. Hahn and H. Kang, Phys. Rev. B, 1999, 60, 6007-6017. 96 H. Chang and A. J. Bard, J. Am. Chem. Soc., 1990, 112, 4598-4599. 97 H. Chang and A. J. Bard, J. Am. Chem. Soc., 1991, 113, 5588-5596. 98 J. V. Zoval, R. M. Stiger, P. R. Biernacki and R. M. Penner, J. Phys.
Chem., 1996, 100, 837-844.
99 H. Ma, L. Lee, P. A. Brooksby, S. A. Brown, S. J. Fraser, K. C. Gordon, Y. R. Leroux, P. Hapiot and A. J. Downard, J. Phys. Chem. C, 2014, 118, 5820-5826.
100 N. R. Wilson, M. Guille, I. Dumitrescu, V. R. Fernandez, N. C. Rudd, C. G. Williams, P. R. Unwin and J. V. Macpherson, Anal. Chem., 2006, 78, 7006-7015.
101 T. Iwasita, W. Schmickler and J. W. Schultze, Ber. Bunsenges. Phys.
Chem., 1985, 89, 138-142.
102 T. Iwasita, W. Schmickler and J. W. Schultze, J. Electroanal. Chem., 1985, 194, 355-359.
103 J. Velmurugan, P. Sun and M. V. Mirkin, J. Phys. Chem. C, 2009, 113, 459-464.
104 S. Gosavi and R. A. Marcus, J. Phys. Chem. B, 2000, 104, 2067-2072. 105 C. Batchelor-McAuley, E. Laborda, M. C. Henstridge, R. Nissim and R.
G. Compton, Electrochim. Acta, 2013, 88, 895-898.
106 N. Nioradze, R. Chen, J. Kim, M. Shen, P. Santhosh and S. Amemiya,
Anal. Chem., 2013, 85, 6198-6202.
107 L. M. Peter, W. Dürr, P. Bindra and H. Gerischer, J. Electroanal. Chem., 1976, 71, 31-50.
108 N. Sato, Electrochemistry at metal and semiconductor electrodes, 2nd edn., Elsevier Science, Amsterdam, 2003.
109 J. F. Smalley, H. O. Finklea, C. E. D. Chidsey, M. R. Linford, S. E. Creager, J. P. Ferraris, K. Chalfant, T. Zawodzinsk, S. W. Feldberg and M. D. Newton, J. Am. Chem. Soc., 2003, 125, 2004-2013.