warwick.ac.uk/lib-publications
A Thesis Submitted for the Degree of PhD at the University of Warwick
Permanent WRAP URL:
http://wrap.warwick.ac.uk/87997
Copyright and reuse:
This thesis is made available online and is protected by original copyright.
Please scroll down to view the document itself.
Please refer to the repository record for this item for information to help you to cite it.
Our policy information is available from the repository home page.
Developing Force Measurement Techniques
for Cell Mechanics and Adhesion
by
Tianrong Jin
Thesis
Submitted to the University of Warwick
for the degree of
Doctor of Philosophy
Contents
List of Tables iv
List of Figures v
Acknowledgements xiv
Declarations xvi
Abstract xviii
Abbreviations xix
Chapter 1 Introduction to cell mechanics 1
1.1 Introduction . . . 1
1.2 Cell mechanics and human diseases . . . 2
1.3 Contraction and adhesion . . . 5
1.3.1 Cellular contraction force . . . 7
1.3.2 Cellular adhesion . . . 11
1.4 Multi-scale biomechanics . . . 12
1.5 Grand challenges in cell mechanics . . . 14
Chapter 2 Cellular force sensing techniques 16 2.1 Introduction . . . 16
2.2.1 Collagen gel-based contraction assay . . . 18
2.2.2 Culture Force Monitor (CFM) . . . 24
2.2.3 Traction Force Microscopy (TFM) . . . 26
2.3 Atomic force microscopy . . . 29
2.4 Aims and objectives . . . 32
Chapter 3 A novel nano-biomechanical tester 33 3.1 Introduction to micro-mechanical metrology . . . 33
3.2 Hardware design . . . 35
3.2.1 Force transducer . . . 35
3.2.2 Motorised stages . . . 41
3.2.3 Data acquisition . . . 43
3.3 Software design . . . 47
3.4 System calibration . . . 51
3.4.1 Calibration of force transducer . . . 51
3.4.2 Calibration ofz-axis stage . . . 56
3.5 Experimental setup . . . 61
Chapter 4 Measurement of fibroblast contraction force 66 4.1 Introduction . . . 67
4.2 Material and methods . . . 70
4.2.1 Cell culture . . . 70
4.2.2 Collagen gel contraction assay . . . 70
4.3 Mathematical modelling . . . 73
4.3.1 Young’s modulus of collagen gel . . . 73
4.3.2 A theoretical model to measure contraction force . . . 74
4.4.3 Cell density e↵ects on contraction force . . . 78
4.5 Discussion . . . 80
4.6 Summary . . . 83
Chapter 5 Collagen matrix sti↵ness influences fibroblast contraction force 84 5.1 Introduction . . . 84
5.2 Materials and methods . . . 86
5.3 Results . . . 88
5.4 Discussion . . . 91
5.5 Summary . . . 92
Chapter 6 Atomic force microscopy for cell-to-cell adhesion 93 6.1 Backgrounds . . . 93
6.2 Experimental method . . . 95
6.2.1 AFM set-up . . . 95
6.2.2 AFM calibration . . . 97
6.3 AFM force spectroscopy for cell-to-cell adhesion . . . 99
6.4 Ketamine reduces functional tethering between cells of the Proximal Tubule (HK2) . . . 102
6.5 Summary . . . 107
Chapter 7 Synopsis and future work 110 7.1 Research highlight . . . 110
7.2 System limitations . . . 112
7.3 Possible applications and recommendations . . . 113
Appendix A 115
List of Tables
2.1 Selected cell-embedded collagen gel-based studies which pertain to
the listed disease/disorder categories. . . 20
3.1 USB 2.0 pin-to-pin allocation for data transduction . . . 50
A.1 Number of HAoAF seeded for di↵erent multiple well plates. . . 141
A.2 Specification of force transducer 406A series, Aurora Scientific Inc. . 143
A.3 Calibration of z-axis stage displacements. Machine provides the
in-cremental precise at 0.001, 0.01 and 0.1 mm. Residuals are calculated
by machine date minus real displacement. . . 149
A.4 Weight of paper strips and output voltage from force transducer. . . 150
A.5 Hysteresis calibration data of z-axis stage. Machine generates two
types of increment steps, 0.0002 and 0.002 mm. Corresponding real
displacement readings are recorded. . . 151
A.6 Repeatability calibration data ofz-axis stage. Machine generates five
di↵erent increment steps, 0.0002, 0.0004, 0.0006, 0.0008 and 0.001
List of Figures
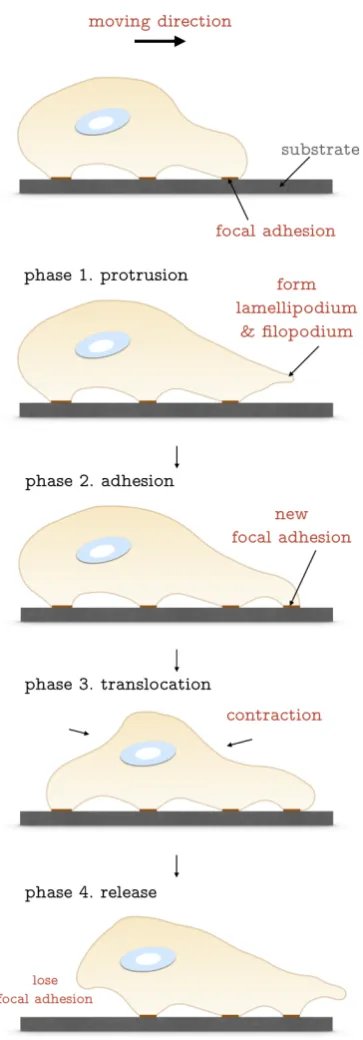
1.1 Schematic diagram of cell locomotion. The moving direction in this
case is towards right. The steps include protrusion, adhesion,
translo-cation and release. . . 6
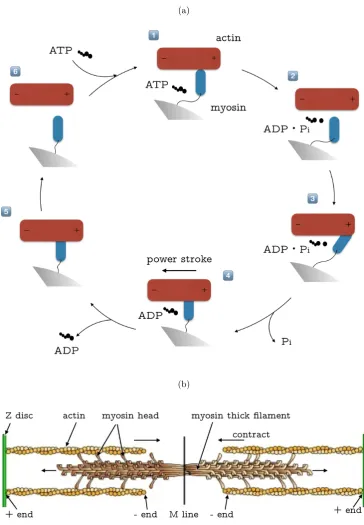
1.2 (a) Schematic diagram of the myosin configuration cross-bridge model.
In the cyclic model, the actin molecule slides from right to left. (b)
The organisation of a sarcomere that constitutes the basic contractile
unit. . . 8
1.3 (a) Young’s modulus of di↵erent bio-materials (adapted from [4]).
(b) More cells that Young’s modulus specifies according to the review
[155]. . . 13
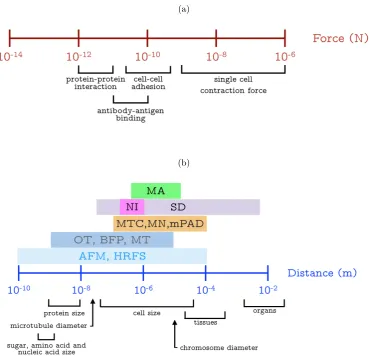
2.1 Force (a) and distance (b) range of common biological events. The
experimental technique in abbreviation with its corresponding testing
range. MA Micropipette Aspiration; NI NanoIndentation; SD
Substrate Deformation; MTC Magnetic Twisting Cytometry; MN
MicroNeedle; mPAD microfabricated Post Array Detector; OT
-Optical Tweezers; BFP - Biomembrane Force Probe; MT - Magnetic
Tweezers; AFM - Atomic Force Microscopy; HRFS - High Resolution
2.2 Models for cell-embedded collagen matrices for testing magnitude of
contraction. (a) Floating matrix contraction: cell-embedded collagen
matrix was dislodged immediately after collagen matrix polymerised.
(b) Anchored matrix contraction: during entire contraction period
cell-embedded collagen matrix was not dislodged from the surface
of Petri dish. (c) Stressed contraction method: the first phase of
contraction, collagen matrix was attached to the plate to enhance the
internal stress. In the second phase, the collagen matrix is dislodged
and stress released. . . 21
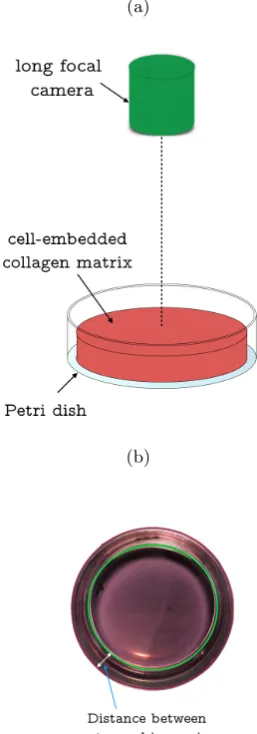
2.3 (a) Schematic diagram of long focal microscope to measure collagen
gel diameter in Petri dishes. (b) Example images for measuring the
collagen radius. It is necessary to keep the distance between outer
and inner rim constant to ensure the focus is at the centre of Petri
dish. . . 23
2.4 Schematic diagram of a traditional culture force monitor. The
cell-embedded collagen matrix is placed in a hydrophobic chamber where
two plates are locked and attached to the edge of the gel. One side of
the plate is fixed to ax-ystage at the bottom of the culture plate. The
other plate is attached to a strain gauge to measure overall contraction
force that the cell generates. . . 25
2.5 The working principle of traction force microscopy. (a) Schematic
diagram of widely used traction force microscopy. Cell sample is
placed on top of polyacrylamide substrate where fluorescent
micro-beads are embedded. The entire gel matrix are placed onto a culturing
plate (i.e., Petri dishes). (b) The typical TFM image analysis process
2.6 Basic constitution of Atomic Force Microscopy. During testing,
sig-nals are sent to move the system along z-axis. A laser beam was
launched, reflected on the cantilever, and received at the
photodetec-tor. The voltage metre is able to detect the deflection of the laser on
photodetector so as to determine the force magnitude. The cantilever
is mounted with a cone tip at the front to probe the biological samples. 30
3.1 Schematic diagram of force transducer electronic block. . . 36
3.2 Schematic view of force transducer. (a) top view; (b) side view.
Length in unit mm. . . 37
3.3 Schematic diagram of force transducer probe with the lid. (a) side
view (b) top view. Scale bar, 1 mm. . . 41
3.4 Schematic diagram of Prior Scientificxy-axis stage and its controlling
units. . . 43
3.5 Schematic diagram of Newportz-axis stage. Left is controlling unit
(ESP 301) and right isz-axis motorised linear stage (UTS 100CC) . 44
3.6 I/O connection pathway of acquiring data from force transducer. (a)
Analogue voltage signals generated from force transducer are
trans-mitted and converted into PC via controlling block, terminal block
and DAQ. (b) Connection of I/O block and computer host. . . 46
3.7 Data flow of system input and output. The blocks inside the
dashed-box are host PC components. The arrows indicate the direction of
data flow and controlling mechanism. . . 49
3.8 The flow chart for basic experimental procedures of acquiring
me-chanical properties of samples. . . 52
3.10 Performance of force transducer in linearisation. (a) Output voltage
at di↵erent loading forces. Numbers are from Table A.4. R2-value and
P-value in (a) were calculated based on the linear regression model.
(b) Residuals between output voltage and linear fitting against loading
force. (c) Residuals of 2 output readings against average loading force.
The red line suggests the linear regression fitting of residuals. . . 55
3.11 Schematic view of z-axis motorised stage calibration set-up. . . 57
3.12 Performance of z-axis stage in its metric accuracy. The residuals
between the machine data and real displacement are plotted against
the device output. Thex axis are plotted at scale of log10. . . 57
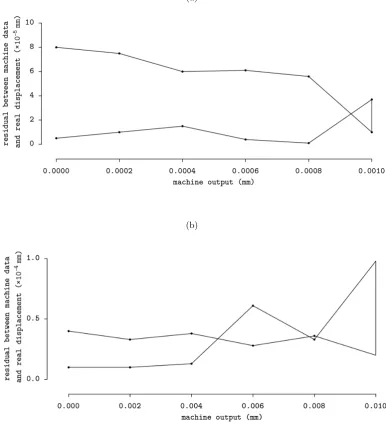
3.13 Performance of z-axis stage in its hysteresis. The residuals between
machine data and real displacement are plotted against the device
output at di↵erent increment step (a) 0.0002 mm; (b) 0.002 mm. . . 59
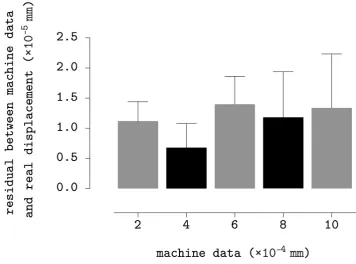
3.14 Repeatability examination ofz-axis stage. Data denotes the mean±
s.e.m of residual between system outputs and real displacements. . 60
3.15 (a) Schematic of depth-sensing nano-indentation system for
force-displacement measurement. (b) Image of nano-indentation system. . 62
3.16 The flow chart for basic experimental procedures of acquiring
me-chanical properties of samples. . . 63
4.1 (a) The schematic setup of bio-nano-indentation tester. (b) Typical
loading Force-Displacement curves of collagen gels with higher and
lower sti↵ness indented by a flat punch. . . 72
4.2 Schematic of theoretical model for collagen gel before and after
4.3 (a) Typical Young’s modulus fitting of collagen gel contraction
mea-surement from force-strain curve. (b) Data denote mean ± s.e.m of
Young’s modulus of collagen gel with/without histamine and
ML-7 from three independent measurements (N = 3). P-value was
calculated using One-Way ANOVA with Bonferroni Post-Hoc test.
⇤⇤P <0.05,⇤P <0.5. . . . . 77
4.4 Photographs of the typical HAoAF embedded collagen gel after
treat-ments. (a) controlled collagen gel, (b) agonist histamine (100 µM)
stimulated collagen gel, (c) Histamine stimulated collagen gel with
the presence of myosin light chain kinase inhibitor ML-7 (25 µM).
The areas circled with black solid lines in (a), (b) and (c) represent
the culturing areas of 35 mm Petri dishes. The areas circled with
coloured dash lines in (a), (b) and (c) denote the sizes of collagen
gels, which were calculated by referencing the culturing area of Petri
dishes. . . 78
4.5 HAoAF were embedded into collagen gels at di↵erent density of 0.216⇥106(cells
gel 1). (a) Overall contraction force and (b) Single cell contraction
force per gel with/without Histamine and ML-7. Data denote mean
± s.e.m from 3 independent measurements, P-value was calculated
using One-Way ANOVA with Bonferroni Post-Hoc test. ⇤⇤⇤P <0.005. 79
4.6 Cellular contraction force at di↵erent cell densities. (a) Overall
con-traction force of HAoAF at three di↵erent cell densities, i.e., 0.06,
0.12 and 0.3⇥106(cells gel 1). (b) Single cell contraction force of the
three cell densities. Data denote mean ± s.e.m from 4 independent
measurements,P-value andR2-value in (a) were calculated based on
5.1 (a) Schematic of geometric parameters of collagen gel were measured
before and after contraction for calculating contraction force. (b)
Measured thickness of collagen gel in the absence and presence of
agonist histamine with di↵erent collagen concentration (1.5, 2.0 and
2.5 mg ml 1). (c) Top view images of typical HAoAF-embedded
collagen gel before and after 5 hours histamine (100 µM) treatment.
The areas circled with orange and blues lines denote the sizes of Petri
dish (35 mm in diameter) and collagen gels respectively. . . 89
5.2 HAoAF were embedded into Type I collagen gels, formed at
con-centrations of 1.5, 2.0 and 2.5 mg ml 1. (a) Young’s modulus of
each gel at di↵erent collagen concentration. (b) Overall contraction
force per gel in the absence or presence of histamine treatments (100
µM, 5 hours). (c) Linear regression fitting of overall cell contraction
force. Data denote mean ± s.e.m from three independent
measure-ments (N = 3). P-Value was calculated using one-way ANOVA with
Bonferroni post hoc test. ⇤⇤⇤⇤P < 0.0005; ⇤⇤P < 0.05; ⇤P < 0.5;
####P <0.005; #P <0.5. . . . 90
6.1 (a) Schematic of an AFM head which has 100 µm pulling length to
perform cell-to-cell adhesion experiments. The cantilever is mounted
on the glass block using a spring clip. 10-degree incline ensures the
laser beam can be transmitted to the photodiode. The glass block
is then transferred and mounted in the locked chamber along with
the head. The head has three supporting foots which can adjust the
level of horizontal. (b) Image of AFM head with the microscope. The
system is placed on the anti-vibration table. Images are adapted from
6.2 (a) One single cell attached to the cantilever. (b) Schematic of
cell-to-cell adhesion assay. (c) Typical Force-Displacement curve between
two adherent cells. Scale bar, 20 µm. . . 101
6.3 Ketamine evoked cell morphology and cytoskeletal reorganisation in
HK2 Cells. HK2 cells were cultured in 5 mM glucose containing
media for 48 hours prior to overnight serum starvation. Cells were
stimulated for 24 hours with Ketamine (0.1 - 1 mg ml 1) under
serum-free conditions and morphological and phenotypic changes assessed.
Phase contrast microscopy (panel (a)) and TRITC conjugated
phal-loidin (panel (b)) confirmed the dose dependent e↵ects of Ketamine
on cell morphology and cytoskeletal reorganisation respectively.
Ke-tamine decreased expression of E-cadherin (panel (c)), N-cadherin
(panel (d)) and -catenin (panel (e)). P-value was calculated using
One-Way ANOVA with Bonferroni Post-Hoc test. Key significances
6.4 Ketamine reduces cell adhesion. AFM-cell-to-cell force spectroscopy
was used to measure the detachment energy (fJoules) and maximum
unbinding force (nN) required to uncouple two HK2 cells. The
calcu-lation of energy required to separate the cells was to integrate grey
area in panel (a) control cells, panel (b) (0.1 mg ml 1 Ketamine
treated cells), panel(c) (0.5 mg ml 1 Ketamine treated cells), panel
(d) (1 mg ml 1 Ketamine treated cells) by JPK software, and
max-imum force of detachment (red circle) was measured. The former is
known as the ‘detachment energy’ (panel (e)) and later is ‘maximum
unbinding force’ (panel(f)). Ketamine decreased the maximum
un-binding force and the work of adhesion in a dose dependent manner
compared to control. Data is expressed as mean±s.e.m of multiple
cells from 4 separate experiments, where key significances are shown,
⇤⇤⇤P <0.001,⇤⇤P <0.01. . . 108
A.1 Cell counting by using a haemocytometer (a) Exterior of Neubauer
improved counting chamber. (b) Grid layout of the Neubauer
im-proved hemocytometer. Blue line enclosed areas are mainly used for
cell counting. (c) Magnification of one blue circled area in (b) with
cells on. As cells have the same probability of dropping onto the edge
of the counting area, cells on the top and right lines are not taken
into calculation. (d) Real cells on the counting area. Grid is visible
under microscope. (e) Side view of hemocytometer. Cell samples are
placed on the red area. . . 142
A.2 SCC-68 parts locator diagram. The cable, in the project, is connected
from NO.9 to the terminal NO.2 in the diagram. . . 144
A.4 SCC-68 quick reference label. No.68 and No.24 are employed in the
project. . . 146
A.5 DAQ assistant setting corresponding to RSS-68 terminal block. . . . 147
A.6 DAQ setting in Labview programme. . . 148
Acknowledgements
Foremost, I am very thankful to my supervisor Dr Isaac Kuo-Kang Liu for his
sup-port and guidance throughout the time as his student. I have been incredibly lucky
and profoundly grateful to have a supervisor who cared so much about my research
and who responded to my questions and queries so promptly and perceptively. In
particular, I thank him for his help and comments on the paperwork burdens.
My sincere thank also goes to Dr Richard Siow and Dr Li Li from King’s
College London for our fruitful collaboration and their time in teaching me skills
re-quired for cell culture and biological experiments. Their insightful guidance has been
invaluable concerning the collagen gel based cell contraction experiments. Moreover,
thanks are also due to our collaborators Dr Claire Hills and Prof. Paul Squires from
the University of Lincoln (previous from School of Life Science, University of
War-wick) for their help with AFM cell-to-cell adhesion experiments.
This PhD project is fully funded by the bursary programme from School of
Engineering, University of Warwick and I would like express my gratitude for its
financial and technical support. Also, it has been a great pleasure to received help
from Dr Eleftherios Siamantouras for his kind assistance during the design of cell
mechanics tester. I would also like to thank Dr Nathaniel Shiers for his comments
on revising this thesis.
I owe a debt of thanks to my parents, Zhonghua Jin and Peiling Ying for
their years and years emotional support and unconditional love. In particular, I
Last but not least, my special thanks are reserved for my fianc´ee, Anyi Zou
for her continued tolerance, support, encouragement and painstaking care during
writing the thesis. I cannot stop being amazed and inspired by her curiosity of
science and exploration of unknown. I also thank her in advance for not crying
when she reads this. It is to her that I would like to dedicate this thesis.
Tianrong Jin
University of Warwick,
Declarations
I hereby declare that the work on this thesis, submitted in partial fulfilment of the
requirements for the degree of Doctor of Philosophy at the University of Warwick,
presents my own work and has not been previously submitted to any other
institu-tion for any degree, diploma or other qualificainstitu-tion. The contribuinstitu-tion of collaborative
work has been specifically acknowledged. All sources of information have been
ac-knowledged by means of references and bibliography. Published work is contained
in the Appendix.
Parts of this thesis have been published by the author:
• Tianrong Jin, Li Li, Richard CM Siow, and Kuo-Kang Liu. Collagen matrix
sti↵ness influences fibroblast contraction force. Biomedical Physics &
Engi-neering Express 2, no.4, (2016): 047002. doi: 10.1088/2057-1976/2/4/047002
• Tianrong Jin, Li Li, Richard CM Siow, and Kuo-Kang Liu. A novel
col-lagen gel-based measurement technique for quantitation of cell contraction
force. Journal of the Royal Society Interface 12, no.106 (2015): 20141365.
doi: 10.1098/rsif.2014.1365
• Claire E. Hills, Tianrong Jin, Eleftherios Siamantouras, Issac KK Liu, Kieran
P. Je↵erson, and Paul E. Squires. ‘Special K’ and a loss of cell-to-cell adhesion
junc-Parts of this thesis have been presented by the author:
• Tianrong Jin, Richard C. Siow, Li Li and Kuo-Kang Liu. Collagen matrix
sti↵ness influencing on fibroblast contraction force. Frontiers in Bioengineering
and Biotechnology. 10thWorld Biomaterials Congress, Montr´eal, Canada, 17th
May - 22nd May, 2016.doi: 10.3389/conf.FBIOE.2016.01.01917
• Tianrong Jin, Richard C. Siow, Li Li and Kuo-Kang Liu. A new gel-based
sensing technique for quantitative measurement of cell contraction force. 8th
IEEE EMBS PGBiomed International Student Conference, University of
War-wick, Coventry, UK, 15th - 17th July, 2014
• R.C. Siow, T. Mughal, T. Jin, L. Li, M. Parsons, I.K.K. Liu and G.E. Mann.
Transforming growth factor- 1modulates redox signalling, migration and
con-tractility in human aortic adventitial fibroblasts. Society for Free Radical
Research International, Kyoto, Japan, 2014.
• Tianrong Jin and Kuo-Kang Liu. Nano-Mechanical study of biological cells.
Physics of Living Matter 8th Edition, Cambridge, UK, 19th - 20th September,
Abstract
Cellular force is essential in maintaining the normal function of a biological cell. The primary goal of this study is to develop experimental methods to quanti-tatively determine forces generated from cell contraction and cell-to-cell adhesion. A novel method has been developed to measure the cell contraction forces exerted within a cell-embedded collagen matrix. The technique provides a 3D cell-matrix model which allows estimation of the cell contraction forces over a certain period of time. It was found that embedded fibroblast cells are able to cause a shrinkage of their surrounding matrix due to cell contractility. Tailored equipment which has ultimate force and displacement resolutions of 10 nN and 100 nm respectively has been constructed to accurately determinate the elasticity of cell-embedded colla-gen matrix. In combination with a mathematical model, the cell contraction force can be calculated based on the geometric parameters of the collagen matrix before and after the shrinkage. Reagents of agonist (histamine) or antagonist (ML-7) have been used to stimulate or block the fibroblast contraction force. They both show
the e↵ect of altering the sti↵ness of an extracellular matrix which is critical in the
determination of cell contraction forces. More importantly, the analysis of the mea-sured data based on a non-linear mechanical model have also confirmed that the elasticity of the extracellular matrix will influence the fibroblast contraction force.
mechano-Abbreviations
ADP Adenosine Diphosphate
AFM Atomic Force Microscopy
AFM-SCFS Atomic Force Microscopy Single Cell Force Spectroscopy
ANOVA Analysis Of Variance
ATCC American Type Culture Collection
ATP Adenosine Triphosphate
BFP Biomembrane Force Probe
BMI Body Mass Index
CCD Charge Coupled Device
CGCA Collagen Gel Contraction Assay
DAG Diaglycerol
DAQ Data Acquisition
DMEM Dulbeccos’ Modified Eagle’s Medium
EDL Electrical Double Layer
E-Modulus Elastic Modulus
FA Focal Adhesion
FCS Fetal Calf Serum
F-D Force-Displacement
FPCL Fibroblast-Populated Collagen Lattice
h hour(s)
HAoAF Human Aortic Adventitial Fibroblasts
ICCJ Interactive Control Centre Joystick
IP3 Inositol Triphosphates
kg kilogram
MA Micropipette Aspiration
min minute(s)
ml millilitre
MLC Myosin Light Chain
MLCK Myosin Light Chain Kinase
MTC Magnetic Twisting Cytometry
mm millimetre
mM micromolar
MN Micro-Needle
mN micro Newton
mPAD micro-fabricated Post Array Detector
MT Magnetic Tweezers
NI Nano-Indentation
nm nano metre
nN Nano Newton
OT Optical Tweezers
PBS phosphate-Bu↵ered Saline
P-value value of statistical significance
R2-value coefficient of determination
SCC Source Code Control
SD Substrate Deformation
s.e.m standard error of the mean
TFM Traction Force Microscopy
Chapter 1
Introduction to cell mechanics
1.1
Introduction
Over the past few decades, the way of thinking about life science questions has
been undergoing a radical and revolutionary transformation. The subject of biology
has been transformed from a qualitative and observational discipline into a more
quantitative one in terms of all aspects of works from DNA level to organ level. Many
sub-disciplines have been emerging and demanding an interdisciplinary integration
among biology, statistics, mathematics, physics, engineering and computer science.
As a result, biophysics and biomechanics are becoming increasingly important in
contribution to the conventional biology and physics.
With the advancement of imaging technology, there is a desperate need for
probing the mechanical properties of biological samples from tissues to molecules.
In particular, many established cellular processes and diseases can be shifted in
paradigm by understanding the role of mechanical forces. For example, the forces
triggered by the cellular processes can initiate cell adhesion, migration, proliferation
stretching, can also serve as an extracellular signal which regulates cells’ phenotype
[35]. Moreover, interfering with cell sensing process has been proven to relate to
several pathological phenomena, such as cancer, atherosclerosis and osteoporosis [35,
76, 133]. Therefore, all these cell behaviours associated with mechanical forces have
led to the study of cell mechanics [145]. The term cell mechanics here specifically
refers to the study that uses tailored engineering tools to investigate mechanical
behaviours of cells.
The primary goal of this chapter is to introduce some diseases that are
asso-ciated with cell mechanics and adhesion. Due to the size and complex characteristics
of biological cells, there are several challenges in measuring their mechanics and
ad-hesion which will be introduced in the following sections. In Chapter 2, a number of
state-of-the-art experimental techniques have been surveyed and reported in detail.
Chapter 3 describes the nano-bio-mechanical tester developed for measuring cell
mechanics in terms of hardware and software configurations. Chapter 4 describes
the nano-bio-mechanical tester in combination with a mathematical model that has
been used to quantify the contraction force of single cellsin vitro using fibroblasts
embedded in a collagen gel matrix. Further results of extra-cellular matrix
regulat-ing the fibroblast contraction force are presented in Chapter 5. Chapter 6 describes
a novel method to measure cell-to-cell adhesion force by using Atomic Force
Mi-croscopy (AFM) force spectroscopy. Finally, some more important conclusions that
can be drawn from this research and a number of recommendations of how this
research topic can be further developed are given in Chapter 7.
towards thinking about the mechanics of cells in relation to some common diseases
such as cancer, hypertension, and diabetes. For instance, cancer cells often exhibit
a di↵erent elasticity compared to healthy cells and blood vessel cells change
con-tractility subject to the high blood pressure [38]. Not only does this imply that
the physiological system has a mechanical mechanism to maintain the fundamental
structure, but also suggest that the human cellular system will respond to
biome-chanical stimulation. Understanding human pathological phenomena would often
require the understanding of cell mechanics. The following list shows some typical
examples that elaborate how biomechanics at the cellular level directly impacts the
human physiological system and further leads to pathological disease.
• In the process of hearing, external environment generates physical loadings
(sound waves) that are potentially perceived by the human ears. Sensing
ele-ments (i.e.inner ear bones, cilium and cochlea) will conduct a large number of
biochemical and biomechanical events, for instance, wave causes the vibration
of inner ear bones and calcium ions will flow into the cilia due to the opening
mechanism of tip links. The cilium will then convert these mechanical
load-ings into biochemical signals so that human brain can interpret those signals
through nerve impulses. In the process, the sound waves as an external
load-ing stimulates the actin filaments between two adjacent cilia. It is essential
that the cilia should maintain the right mechanical characteristic in order to
handle the deflection caused by the sound wave [114].
• Infection is another common example of how foreign genetic information is
delivered into the human immune system. The very first step for the virus
infection is to destroy the cell’s intrinsic protection, i.e. membrane, by
me-chanically disrupting the normal cell activities. However, cell membranes have
their protection mechanism, called endocytosis. During one type of
cells flows to bind the ligands of a virus. The virus would eventually be
en-veloped into the cell. During the whole process, the behaviours of cell adhesion,
folding and pinching, are mechanically important for both cargo delivery and
cell protection [85].
• Breathing and heart beating are also interesting examples to show how
me-chanical contractile forces play a major role in physiology processes. The
air-way smooth muscle cells and epithelial cells conduct cyclic stretches in order
to maintain breathing pressure. Moreover, stretching forces generate feedback
signals for basement membrane to monitor the breathing conditions. If the
smooth muscle cells are hypersensitised by airborne pathogens, the cells will
keep in hypercontractility condition, which will ultimately cause asthmatic
at-tack [104]. The mechanical dysfunction of cardiac myocytes directly relates to
the arrhythmogenesis with congestive heart failure. The calcium fluxes
reg-ulate the switches of myofilaments which lead to the activation of myocytes
contraction [9].
• Cancer cells exhibit metastasis largely owing to the decrease of cell-to-cell
adhesion forces. The cancer cells, in the process of remaining metastatic, will
detach from the tumour and relocate to a new site to grow. Cell migration,
detachment and reattachment are all involved with mechanical events. The
tumour, as a whole, will also regulate itself with surrounding environment,
such as hardening connective tissues and redirecting blood vessels, to create a
more comfortable and nutritional growing environment [20].
• Skeletal structure is one of the most noticeable systems in the human body that
constantly endures mechanical loadings. Evidence show that bone cells are
that most of the osteoblasts have their sensing elements to detect physical
movements. With more usage of the cells, it is likely that the target cells will
have faster metastasis.
Overall, the cell is a dynamic system which interacts and adapts towards external
microenvironment continuously to maintain a healthy state. With all these active
evidence in our living system, the importance of investigating mechanical behaviours
of biological cells cannot be ignored. It is clear that the systems not only have a
me-chanical function which support the physiological environment, such as blood vessels
and heart pump blood and skeleton supports body, but also actively respond to the
mechanical loading, for example, bones reinforce and degrade due to mechanical
forces.
1.3
Contraction and adhesion
Intracellular contraction force, cell-to-cell adhesion and cell-to-substrate adhesion
force are vital for many biological processes; for instance, wound healing, cell
regen-eration, inflammation, and cancer. Among these processes, the most fundamental
behaviour which includes both cell contraction forces and adhesive forces is cell
migration (locomotion). Cell locomotion consists of four continuous steps: i)
pro-trusion,ii) adhesion,iii) translocation, andiv) release as shown in Figure 1.1. Cells
may undergo more than one step at any point of time.
The first phase is called protrusion. In this step, the polymerisation of actin
filaments at the leading edge of the cell controls the formation of lamellipodium
and filopodium. The veil-like lamellipodium and finger-like filopodium both contain
rich cross-linked actin bundles. It is well-acknowledged that the actin
lamellipodium [130]. The second step is adhesion when the cell membrane moves
forwards and a new configuration of cytoskeleton is quickly assembled. There will
be a new assembly point from the membrane firmly attached to the substrate. The
cell and substrate develop new focal adhesion (FA) points and generates adhesion
forces. The adhesion force causes the cell to firmly anchor to the substrate and leads
to the third step,i.e. translocation. During this procedure, the cell moves towards
the direction where new FA points are generated. Intracellular contraction force
is then created. The mechanism of how contraction forces are generated will be
introduced later in Section 1.3.1. Actin-myosin interaction dominates the process.
The very last step of this cyclic activity is the release of the rear end FA. The loss of
adhesion force combined with contraction force generated in phase three collectively
pushes the cell to move forward.
1.3.1 Cellular contraction force
Mechanism of cell contraction force
The mechanism of cell contraction was firstly reported in 1954 by two separate
research groups [70, 71]. They have proposed the sliding filament theory which
explains the model of multiple muscle proteins sliding towards each other to generate
contraction force. Huxley has modified the model by stating that the filament
sliding occurs by cyclic attachment and detachment of myosin on actin filaments.
Contraction forces are generated when the myosin pulls the actin filament towards
the centre of cells [72]. The theory was recently validated and regarded as the
‘cross-bridge’ model based on the actomyosin interactions [44, 142].
Briefly, the model considers actin filaments and myosin, residing in most of
the cellular systems, to be responsible for the cell contraction. Myosin acts as a
contrac-(a)
[image:30.595.136.501.110.636.2](b)
tion whilst the actin filament as part of the cytoskeleton structure is responsible
for driving the entire cell entity in motion. Figure 1.2a shows a schematic of
actin-myosin’s cyclic process illustrated by the cross-bridge model. The cycle starts at
the top where actin and myosin are tightly bonded in the absence of ATP/ADP
(adenosine triphosphate/adenosine diphosphate). The phase is also known asrigor
state (phase 1). After ATP moves in and bonds with myosin, the hydrolysis of ATP
makes the myosin start to release from the actin filament (phase 2). The release
of chemical energy from ATP induces myosin to change conformation and become
a cocked configuration (phase 3). In this state, the neck region of myosin moves
towards the (-) area. The displacement is around 5 nm. The hydrolysis product
(ADP and Pi) remain attached to the myosin’s head. In between phase 3 and phase
4, the release of phosphate is activated by the actin and triggers a ‘power stroke’.
In the process of the ‘power stroke’ (phase 4), the myosin drags the actin filament
to move, in this case, left. The mechanical forces and physical displacement of cell
entity are generated in phase 4. In phase 5 and 6, at the release of spent molecule
ADP, the system returns to the original state and completes the cycle.
The cross-bridge model explains the interaction between one actin and one
myosin molecule. Inside cell entity, several hundreds of myosin molecules are
stag-gered and interlocked at their long ↵-helical tails as Figure 1.2b shows. F-actin
was derived from G-actin polymerisation and formed a polar configuration. The
‘+’ and ‘-’ represent the barbedand pointedends of the actin polymer. The entire
length of one F-actin filament is around 36 nm and there are limited binding sites
for myosin’s head to attach to. The overall movement of a myosin head is limited to
5 nm. Hence, in each full twist ofz-disc, it is impossible for every myosin molecule
to reach far enough to a binding site. In fact, only very few myosin heads are able
to grab a binding site as Figure 1.2b shows. The overall productions of myosin
Modulation of the cell contraction force by the matrix
Human cells rely greatly on their surrounding matrices to maintain the vitality and
the function of the human tissue. Cells naturally adhere to extracellular matrices,
which constitutes a mechanically stable and elastic micro-environment. Many
bio-logical cells, such as fibroblasts, epithelial and endothelial cells, have the ability to
reconstruct the mechanical properties of their surrounding microenvironment [110].
This behaviour has been widely studied in regenerative medicine and tissue
engineer-ing. The mechanism helps the human body to recover from damaged tissue by cell
proliferation and di↵erentiation towards the formation of a new healthy tissue. In
the meantime, when cells anchor to the extracellular matrices, physical behaviours
will be triggered to probe the mechanical properties of their encompassing
territo-ries. For example, focal adhesions link the actin-myosin cross-bridge inside the cell
with a number of extracellular matrix proteins outside the membrane and regulate
the transmitting signals during contraction [8, 51]. It has also been shown that the
FA is mechano-sensitive and regulated by the external force in terms of size, shape
and composition [50, 170]. Hence, FA is the mediator that transmits and converts
forces into biochemical signals to regulate cell contractions. The extracellular matrix
changes its mechanical property constantly and subtly. Therefore, ECM generates
mechanical signals continuously which are probed by FA and translated to the cells.
Meanwhile, cells generate contraction force after the signals are perceived which
results in the conformation changes of extracellular matrices and a↵ects
neighbour-ing cells. The overall structure forms the intercellular feedback loop. In addition,
mechano-sensing of the extracellular matrix is synergistically controlled by many
1.3.2 Cellular adhesion
Cell adhesion is a fundamental mechanism whereby cells are organised and formed
in tissues and organs. Cell adhesion also can be regarded as a complex system
whereby cells translate various interactional genetic information in response to
bio-chemical signals and finally form our organs and tissues. Cells change adhesion
energy continuously to maintain their stability and activity [10]. The form of this
behaviour is presented as cell mobility and contractility. There are two forms of
adhesion interactions that are widely studied: cell-cell adhesion and cell-ECM
ad-hesion. Cadherins and integrins have been implicated in the control of cell adhesion
and the maintenance of cell structure. Cadherins mainly mediate cell-cell adhesion
in terms of compaction and rearrangements whilst integrins regulate cell-ECM
adhe-sion on spreading and motility. E-cadherin in epithelium has been mostly studied in
the cadherin family. It is a transmembrane Ca2+-dependent homophilic adhesion
re-ceptor. Cadherin can link two adjacent cells directly by multivalent linker molecules.
In the process of cadherin mediated cell-cell adhesion,↵-catenin and -catenin are
formed to link actin and to transmit signal, respectively. Hence, signals generated
by the adhesion receptors contribute to the regulation of cell-cell adhesion.
More-over, adhesion receptors, cytoskeleton and signal pathways conjointly regulate the
tissue morphogenesis. Integrin also belongs to the family of transmembrane proteins
that tightly bind with the plasma membrane and intracellularly connect to the cell
cytoskeleton. The process of cell motility and major enzymatic activities are vital
for regulating cell-ECM interactions. Integrins are dimers which are composed of↵
-and -subunits [73]. For example,↵5 1 integrin is a fibronectin receptor which has
isoform of↵5 subunit and 1subunit. Integrins would assemble into the focal
adhe-sion with a highly regulated mechanism however the exact role of each component
1.4
Multi-scale biomechanics
Cells organise themselves in biological systems by proliferation, migration, and
dif-ferentiation. In each of the processes, di↵erent biomechanical behaviours are
in-volved. These include cell-cell adhesion and contraction which decide how cells
assemble themselves into tissues or escape from them. The deep down molecular
level mechanics such as actin-myosin induced protein movement enable to refine
larger scale of study such as cell contractility. The cell-level or so-called micro-scale
studies also relate to the mesoscale behaviours; for example, cell contractility can be
further studied in terms of its e↵ect on cell migration in extracellular matrix.
More-over, mesoscale behaviours would result in the macro-scale (tissue) phenomena. For
example, cell migration and contraction are directly linked with skin wrinkling,
age-ing and wound reorganisation [165]. In all, macroscopic tissue level activities are
induced by the single molecule protein mechanics. The multi-scale coordination
and regulation form the entire physiology system. Amazingly, our body invents the
mechanism and regulates interactions with minimum consumption of energy.
Mechanics is the subject that studies the quantitation method of physical
materials which are subjected to force and displacement. Biomechanics has been
applied to study the mechanical properties of biological systems, such as human
organs, tissues and cells. Nano-biomechanics is a special type of biomechanics in
terms of the scale of measurement. The macroscopic biomechanics is always based
on the assumption that the material is homogeneous in composition and the size of
test probe is always negligible. However, this is not normally true as the biological
sample is usually a mixture of a large number of di↵erent proteins and
compos-ites. The latest development of force and displacement measurement technology
(a)
[image:35.595.126.517.237.518.2](b)
Figure 1.3: (a) Young’s modulus of di↵erent bio-materials (adapted from [4]). (b)
rameters of force and displacement, in combination with mathematical models, it
is now possible to analyse mechanical properties of the materials or samples. The
work o↵ers to provide new insight into observing the biological and pathological
phenomena. Thanks to the advancement in nano-fabrication and microscopy,
peo-ple can further manipulate cells and molecules at force and displacement of less than
a piconewton (pN) and a nanometre (nN) respectively. The results can provide us
with unique mechanical parameters, such as Young’s modulus, rigidity, Poisson’s
ratio, compressibility, contractility and viscoelasticity. Young’s modulus (or
elastic-ity modulus) attracts the most interest in studying biomechanics. Young’s modulus
of cells can be calculated in vitro by acquiring a Force-Displacement (F-D) curve
using di↵erent nano/micro-mechanical testers. Suitable mechanical models for cells
are subsequently applied to mathematically fit the F-D curve. A comprehensive
review has introduced many mechanical models including Hertz, JKR, Lifshitz, and
Tatara theories [101]. Figure 1.3a shows common elastic modulus of bio-materials.
Cells are the least elastic material in the diagram. This enhances the difficulties of
measurement and determination. Figure 1.3b shows elastic moduli of di↵erent cells
which have been examined by Atomic Force Microscopy (the measuring technique
will be introduced in Chapter 2 and Chapter 6).
1.5
Grand challenges in cell mechanics
As we have described in this chapter, biomechanics is related to many physiological
and pathological processes. The cell is a complex system where each protein has
specific tasks. Nano-biomechanics studies provide a methodology for working at
atomic, molecular, sub-cellular, and cellular-level in order to understand
difficult. It includes cytoskeleton, membrane and cell entity. Moreover, biological
cell is a viscoelastic material which means fluid-like and solid-like behaviours both
exhibit in the system. In order to probe the mechanical properties of cells,
sophis-ticated mechanical measuring devices are required. Higher resolution, faster speed,
less noise, feedback control processes are necessary for this type of study. During the
measurement, any changes in temperature and humidity would a↵ect the experiment
as the size of protein and cell is extremely small. In addition, primary samples from
the human body have variations concerning BMI (body mass index), genetic disease,
age and gender. It often requires statistical assessment of any mechanical testing
re-sults. Furthermore, experiment situationin vitro is relatively well controlled whilst
in vivotesting could be a↵ected by many potential complications from physiological
environments. Basic fundamental mechanics can solve most of the cell mechanics
questions, however, there is still many to be done by using advanced mechanical
analysis. On top of this, much research in this area requires extensive
collabora-tion. This research normally involves the development of nanomechanical testing
devices, building mechanical/mathematical models, creating platforms/procedures
for testing and validation, biological hypotheses and exploration, animal testing,
Chapter 2
Cellular force sensing techniques
2.1
Introduction
To date, various nano-/micro- mechanical testers exist in the area of experimental
analysis of biological samples. Several comprehensive reviews [99,100,133,156] have
reported the development of state-of-the-art biomechanical tools and their current
applications along with many advanced mechanical models. Selecting a suitable
mechanical tester requires the estimation of the size of samples and the measuring
capacity. Figure 2.1 shows the typical force and displacement range in the study
of biomechanics. Force is in the range from 1 nano-Newton (10 9 N) to 1
micro-Newton (10 6 N) for cell mechanics study whilst the force to manipulate protein
and molecule is required in the range of pico-Newtons (10 12 N). In this study, the
(a)
[image:39.595.136.507.171.527.2](b)
Figure 2.1: Force (a) and distance (b) range of common biological events. The
2.2
Mini-review of contraction force measurement
tech-nique
Cellular contraction forces are normally measured indirectly by probing the
cell-embedded or cell-populated matrices. Measurement of forces generated by cells
can be performed on cell populations or single cells. The original technique to
study contraction force generated by a cell population was invented by Bellet al[6].
Fibroblasts were embedded in the collagen gels. Cell contraction force was indicated
by the magnitude of gel radius or volume shrinkage. The technique was improved by
Delvoyeet al to accurately determine contraction force using the technique known
as culture force monitor (CFM) [32]. Briefly, in the method, strain gauges are
attached to the edge of cell-embedded collagen gels so as to acquire contraction force
generated by the cells continuously. To obtain single cell contraction force, Harriset
aldeveloped a method by laying the cells onto elastic substratum, called ‘Traction
Force Microscopy (TFM)’ [57, 58]. The traction forces that each cell exerts will
deform the substrate and create visible wrinkling. On the surface, the cell traction
force can be determined by the number of wrinkles at micrometre level. Owing to
the increasing interests in the mechanics of cell locomotion, strengths and adhesion,
several new single cell techniques have been developed to quantify the contraction
force, such techniques including optical traps [87], micro-needle/micropillar arrays
[147] and micro-machined substrata [49].
2.2.1 Collagen gel-based contraction assay
Cell-embedded collagen matrix provides a unique way to study the mechanical
by cells exist in the collagen matrix at all directions. Meanwhile, collagen fibrils will
develop isometric tension to retain their original shape and resist deformation. The
tension would consequently load on the cells and generate reciprocal interactions.
As the collagen fibres are linked, traction forces are propagated throughout the
col-lagen matrix resulting in global remodelling and contraction. This mechanism of
cell-embedded collagen matrix is similar to the in vivo homeostatic response. Soft
connective tissues are under enormous endogenous tension caused by their resident
cells where contraction force is generated upon the extracellular matrix. Many
re-searchers have used the method to determine the mechanism of how cells regulate
the contraction. The recipe and the protocol of collagen gel contraction assay can
be found in the literature [120].
Several models have been developed for di↵erent cell-embedded collagen
con-traction assays. Figure 2.2 illustrates the di↵erence of the three major types of
collagen matrix contraction models. Figure 2.2a shows most commonly used model.
When cells are evenly seeded into the collagen matrix, it takes 20 - 60 minutes for
gels to polymerise in a 37� incubator. Collagen gel will then be immediately
dis-lodged from the surface of a Petri dish. A gel will be floating and mainly have radius
reduction which can be observed from the top view of the Petri dish. The common
expressions of the magnitude of contraction are represented by the percentage of gel
reduction before and after the measurement period. Here a list of some research that
has used cell-embedded collagen matrix based techniques to measure the cell
contrac-tion events [3, 12, 29, 42, 65–68, 74, 77, 111, 121, 129, 132, 144, 150, 153, 169, 173]. Figure
2.2b represents anchored cell contraction assay. Compared with the floating
con-traction array, an anchored gel concon-traction assay will mainly have thickness/height
reduction as the bottom side of collagen matrix is adhered tightly with Petri dish.
The tension in this type of model will be distributed anisotropically. Figure 2.2c is
Table 2.1: Selected cell-embedded collagen gel-based studies which pertain to the listed disease/disorder categories.
Disease/disorder category Selected References
Cardiovascular Disease [29, 153]
Aging [121]
Growth Factor (TGF- 1) [12, 42, 65, 150]
Wound Healing [12, 67, 68, 74, 129, 153, 173]
Eye disease [3, 111, 132]
Respiratory system diseases [42, 66, 169]
Platelet disorder [144]
Oral health [77]
et al [152]. Stress will be developed during the period when the gel was anchored
to the dish. After dislodging from the dish, stress will be eliminated. Many
re-searchers have used this method to study the di↵erence between pre-stressed and
relaxed cells [39, 89, 125] and to investigate environmental stress e↵ects on the cells.
Significant e↵orts have been made to correlate cellular studies performed
by collagen gel-based contraction with the pathology of the disease. In an e↵ort
to elaborate the breadth and depth of disease-related research since Bell et al
in-vented the method, a few selected disease categories with their literature
refer-ences are listed in Table 2.1. A number of review articles related to collagen gel
based contraction assay advances in biochemistry and biophysics have been
(a) (b)
[image:43.595.166.471.248.471.2](c)
Figure 2.2: Models for cell-embedded collagen matrices for testing magnitude of
contraction. (a) Floating matrix contraction: cell-embedded collagen matrix was
dislodged immediately after collagen matrix polymerised. (b) Anchored matrix
con-traction: during entire contraction period cell-embedded collagen matrix was not
dislodged from the surface of Petri dish. (c) Stressed contraction method: the first
lar matrix where they secrete, di↵erentiate, quiescence, and proliferate to maintain
the homoeostasis of their matrix physiological functions. The growth factorin situ
will enhance their adhesion, signalling, sequestration or activation [28]. In terms
of pathological situation, the interaction between fibroblast and matrix has direct
impacts on wound healing, ageing and skin defect.
The commonly-used method for detecting cell contraction is measuring the
percentage shrinkage of collagen gel area [6]. A long focal camera is placed on top
of the culture plate. The focus is tuned to the point at the centre of the plate. It
is recommended that the lid of the culturing plate is removed to acquire a better
view. As the culturing plate (e.g. Petri dish, multi-well plate) is often transparent,
the background colour is often advisable to be black or a darker shade. To assure
that camera focus is at the centre of the plate when taking the image, it is advisable
to inspect whether the distances between outer rim and inner rim are constantly
equal along the periphery as Figure 2.3 shows. The collagen radius/diameter is often
calculated by referencing culturing area of the Petri dishes. In this case, the culturing
area is normally shown as the green circled area in Figure 2.3b. It is advocated that
the images of the culturing area should be calibrated before the testing. Hence, the
actual gel radius (rgel) can be calculated by the following equation:
rgel =
✓
Pgel
Pdish ·
Sdish
⇡
◆1
2
(2.1)
wherePgel andPdish represent the pixels of collagen gel and Petri dish
(cul-ture area) cap(cul-tured in the images, respectively. Sdishrepresents the area of culturing
surface which normally shows in the product information of Petri dishes. The overall
(a)
[image:45.595.251.380.178.546.2](b)
Figure 2.3: (a) Schematic diagram of long focal microscope to measure collagen gel
diameter in Petri dishes. (b) Example images for measuring the collagen radius. It
2.2.2 Culture Force Monitor (CFM)
The methods mentioned above for measuring geometric changes of cell-embedded
collagen gel give a simple solution to quantify cellular contractility. However, these
approaches have an intrinsic drawback, that is when the contraction force is
rela-tively small, the representation of radius changes does not significantly show
ade-quate sensitivity. To overcome this challenge, Delvoyeet al[32] invented an approach
to monitor the overall contraction forces generated from embedded cells by
attach-ing the strain gauges to collagen edges. The method has successfully improved the
sensitivity limited by measuring gel radius alone. The method is known as Culture
Force Monitor (CFM) [32]. Figure 2.4 shows the schematic diagram that explains
the basic principle of how CFM works. In typical CFM systems, cell-embedded
collagen gel is normally attached to the plates to restrain the gel’s movement. The
strain gauge is connected to one of the plates while the other plate is attached to
a x-y stage that adjusts and provides the gel with a minimum initial strain. The
entire system is then placed in a 37� incubator for online monitoring.
The alternative type of CFM system is based on the free-floating collagen
matrix. There are two-needled strain gauges directly connected to the collagen
matrix. It measures the isometric contraction by each pointing the other through
the centre of the collagen matrix. This set-up provides the maximum sensitivity for
the force transducer. It is able to detect the contraction force for the gel displacement
down to 0.5 mm which is a barely noticeable change [36].
Since the discovery of CFM, various research groups have been devoted to
modifying the method and applying it to numerous cell types with related biological
events, such as cell morphology [37,47], tensional homoeostasis [15,19,137], collagen
Figure 2.4: Schematic diagram of a traditional culture force monitor. The cell-embedded collagen matrix is placed in a hydrophobic chamber where two plates are
locked and attached to the edge of the gel. One side of the plate is fixed to a x-y
Wang and co-workers have reported a multi-station CFM [18, 19, 127] which is able
to measure multiple biological samples simultaneously. This improvement saves a
significant amount of time to examine a patch of cells in vitro and facilitates the
statistical analysis. CFM can also be used as a tool to pre-stress the cell-embedded
collagen gel [83, 105], to mimic the stressed environment in vivo, and to remodel
the matrix materials. Since one of the plates is fixed to thex-y stage underneath,
instead of reaching the minimum initial strain, the mechanism can be used to stretch
the collagen matrix for an extended period before cells start to contract. In this
process, embedded cells are stretched and elongated. This pre-treatment provides a
solution for long/short period pre-stressed cells relaxation experiments.
2.2.3 Traction Force Microscopy (TFM)
In 1980, Harris et al [57] found the interesting fact that when cells are cultured
on a very thin silicon substrate, the cell traction force generates a visible wrinkling
on the substrate surface due to the locomotion. Initially, these wrinkles were used
to estimate how many traction forces cells generated. It also can be applied to
determine if a specific area of cells are contractile [58, 90]. However, this approach
has limitations for determining the specific amount of forces and directions of cell
contraction, although a few modifications have been made to adjust the
measure-ment technique [16, 49, 123]. Pelham and Wang [126] first invented the method of
using polyacrylamide material as a deformable substrate and putting cells dyed with
fluorescent labelling antibodies onto the substrate to examine cell locomotion. Still,
the method is not calibrated to determine the actual traction force. Munevar and
co-workers [117] have improved the technique by seeding large numbers of
calibrated traction force microscopy and its sequence of image processing.
As cells can be seeded onto or in the polyacrylamide substrate, the technique
has broadened the application of various cell types, both adherent and non-adherent
cells. Those types include fibroblast (3T31) [97, 117, 157], smooth muscle cells [151,
158], osteoblast [26], keratocyte [34], dictyostelium [75] and HeLa cells [159]. Mostly,
TFM is used to determine the magnitude of single cell contraction force [31, 107,
122, 168] during locomotion [33], migration [21, 103, 116] and development [30, 94].
Moreover, TFM can be used as a tool to elucidate many pathological events caused
by the traction force, such as apoptosis [157], cancer [134] and hypertensive heart
disease [106]. In addition, TFM has been applied further to investigate cytoskeletal
changes [22, 75, 103], focal adhesion [8, 122] and cell shape changes [97]. Recently,
scanning confocal microscopy [45,46,84,92,93,107] has been combined with TFM to
perform a three-dimensional force scanning for single cell traction. The technique
has provided a number of advantages. For instance, TFM is able to determine
single cell traction force in a quantitative manner. The cell-gel interactions can
also be seen and quantified. Various selections of fluorescent microbeads allow for
control of the area where cell traction events take place. However, this also leads
to the disadvantage of the technique, which is that the resolution of contraction
force entirely depends on the accuracy in gel elasticity measurement and camera
spatial resolution. The measurement of elastic modulus of polyacrylamide substrate
according to the report [102] is done by dropping a steel ball onto the substrate.
Young’s modulus (Y) was determined by the modification of Hertz contact theory
as the following equation:
Y = 3(1 ⌫
2)·f
4·d3/2·r1/2 (2.2)
13T3 refers to 3T3 protocol of transferring every 3 days and cell density at 3
(a)
(b)
Figure 2.5: The working principle of traction force microscopy. (a) Schematic
di-agram of widely used traction force microscopy. Cell sample is placed on top of polyacrylamide substrate where fluorescent micro-beads are embedded. The entire
gel matrix are placed onto a culturing plate (i.e., Petri dishes). (b) The typical TFM
where Poisson’s ratio (⌫) is assumed to be 0.3,f is the force that steel ball generated
on the substrate (steel ball is 7.2 g/cm3), d is measured indentation depth and
r is the radius of the steel ball. As substrate deformation indirectly determines
the traction force of the cell, it is necessary to examine the Young’s modulus of
polyacrylamide substrate every time before the traction experiment. Secondly, the
sti↵ness of the substrate will influence the contractility of cells onto/within the
matrix. Cells have the ability to sense the substrate sti↵ness so as to remodel
themselves to accommodate and compensate their behaviours, such as contraction
[59]. Thirdly, the camera resolution will also influence the measurement of traction
force as the micro bead movement is traced under the microscope. Lower resolution
will lead to the centres of beads not being accurately tracked. Three-dimensional
characteristic layers of gel would result in a difficulty for the camera to focus on
di↵erent intersecting surfaces.
2.3
Atomic force microscopy
Binning et al in 1986 invented a powerful tool, Atomic Force Microscopy (AFM),
to initially probe the mechanical property of surfaces in atomic scale [11]. Until
recently, AFM has been broadly and extensively used as a bio-analytical tool to
probe and manipulate the cellular dynamics, to analyse mechanical properties from
tissue to molecule, and to map the topography of micro-substance. AFM belongs
to the category of Scanning Probe Microscopes (SPM) which many review articles
have introduced through its applications [13,69,162] since it began to be used in the
1980s.
Atomic Force Microscopy aims to detect the attractive or repulsive force by a
tip connected to the cantilever. The basic components of an AFM are illustrated in
Figure 2.6: Basic constitution of Atomic Force Microscopy. During testing, signals
are sent to move the system along z-axis. A laser beam was launched, reflected
diode, and a z-axis piezo-stage. The output of the system would be the voltage
versusz-axis displacement. The micro-fabricated cantilever tip requires remounting
and calibration every time before the experiment as each tip has a distinctive sti↵
-ness of silicon or silicon nitride probe. The final output is plotted as force versus
displacement. Various shapes of the front tip can be mounted with the cantilever,
for instance, cone, pyramidal, spherical or flat shape tip.
Atomic Force Microscopy was originally designed to determine the Young’s
moduli of biological samples and to generate high-resolution images of surface
topog-raphy. Both applications share the similarity of testing procedures. At the start of
testing, the cantilever tip and laser beam are calibrated (calibration procedure can
be found in chapter 6.2.2). Force-Displacement curve is generated on one specific
position of the sample drawing approaching and retraction of the tip. Mechanical
models will be used to fit the curve in order to find out the Young’s moduli of the
sample. If AFM is programmed to generate multiple Force-Displacement in one
spe-cific area, a surface image can be mapped to each measurement point. AFM has been
used to test single molecules [41, 115, 140], nucleus [56, 64], cytoskeleton [128, 135],
ECM sti↵ness [141, 149, 160] and cell elasticities [24, 25, 139].
The major challenge in AFM measurement technique is to determine the
point of contact. When the tip approaches the sample very closely but not in
con-tact, electrostatic force, electrical double layer (EDL) force, van der Waals force, and
chemical force (e.g.hydrogen bonding) a↵ects the determination of actually
contact-ing position, especially when AFM is used to manipulate molecules and
nanoma-terials. Furthermore, the shape of tip and point of contact would ultimately a↵ect
the nature of Force-Displacement curve. Results vary by using di↵erent commercial
2.4
Aims and objectives
The primary aim of this study is to examine cellular contraction force of fibroblast
and adhesion force of HK2 cells in a quantitative manner. More specifically, to
examine the contraction force of fibroblast, the study develops a novel biomechanical
testing platform to examine the mechanical property of bio-materials. The model is
based on the modification of cell-embedded collagen matrix. A 3D static contraction
model is developed to characterise the contraction force in vitro (Chapter 4). As
the model is based on the cell-embedded collagen matrix, the matrix e↵ect on the
fibroblast contraction is also discussed (Chapter 5). Furthermore, the study also
focuses on the AFM single cell force spectroscopy to characterise cell-to-cell adhesion
force (Chapter 6). The main objectives are listed as follows:
• To develop a cell contraction model based on the fibroblast-embedded collagen
matrix.
• To develop and test micro-indentation instrumentation to examine the
me-chanical characteristics of collagen gel matrices.
• To examine cell contraction force of fibroblast based on the cell-embedded
collagen matrices.
• To quantify the agonist triggered single cell contraction force.
• To investigate matrix sti↵ness e↵ect on fibroblast contraction force by the
micro-mechanical testing method.
• To examine Ketamine-induced loss of cell-to-cell adhesion energy by a new
Chapter 3
A novel nano-biomechanical
tester
In this chapter, a novel instrumentation of a biomechanical tester will be described.
There will be an overall introduction to metrology and industry, followed by a
de-tailed description of each component including their specifications, calibration
proce-dures and integrated software development. It aims to provide repeatable proceproce-dures
for the design and building of the novel instrument.
3.1
Introduction to micro-mechanical metrology
In the modern engineering discipline, the fabrication and manufacture of sensors
have a tendency to minimise the size of products. The accuracy and resolution of
instruments, however, have increased to meet the requirement of the highly-precise
design of materials, such as biomaterial. It can be predicted that the sub-µm or even
nanometre precision could become popular since the emergence of interdisciplinary
![Figure 1.3: (a) Young’s modulus of di↵erent bio-materials (adapted from [4]). (b)](https://thumb-us.123doks.com/thumbv2/123dok_us/9493204.455155/35.595.126.517.237.518/figure-young-modulus-erent-bio-materials-adapted-from.webp)