888
Corrosion Behaviour of Heat Treated Rolled Medium Carbon Steel
in Marine Environment
1
O.O. Daramola, 2B.O. Adewuyi and 2I.O. Oladele
1
Ajaokuta Steel Company Limited, Ajaokuta Steel City, Kogi State, Nigeria
2
Metallurgical and Materials Engineering Department, Federal University of Technology, Akure, Ondo State, Nigeria.
1
Corresponding Author: [email protected] Phone Number: 2348166814002
ABSTRACT
Investigation were carried out to study the corrosion behaviour of heat treated rolled medium carbon steel and as-rolled medium carbon steel in sodium chloride medium. The as-rolled medium carbon steel was heated to a temperature of 830oC to completely austenize it and water quenched; it was reheated to the ferrite-austenite dual phase region at a temperature of 745oC below the effective Ac3 point. The steel was then rapidly quenched in water and tempered at a
temperature of 480oC. The corrosion behaviour of the steel in marine medium (NaCl) was studied by weight loss measurement. The weight loss is between 0.02g-0.11g for the as-rolled steel and 0.01g – 0.013g for the heat treated steel. The results obtained showed that the as-rolled medium carbon steel is more susceptible to corrosion than the heat treated rolled medium carbon steel.
Keywords: Corrosion, Medium carbon steel, sodium chloride.
1. INTRODUCTION
Corrosion is the destruction of a metal by its reaction with the environment; this reaction is an electrochemical oxidation process that usually produces rust or other metal oxide [1].
erosion corrosion, and biological corrosion) and many methods for corrosion control. Heat treatment of structural steel is one of the way of improving its resistance to corrosion. Heat treatment involves the application of heat to a material to obtain desired material properties (e.g. Mechanical, corrosion, electrical, magnetic e-t-c) [3]. During the heat treatment process, the material usually undergoes phase microstructural and crystallographic changes and this has effect on the corrosion, mechanical and electrical properties of the steel [4].
Rolled medium carbon steel products are produced through a forming process called rolling. The process is carried out in a rolling mill which consist of a complex machine for deforming metal in rotary rolls and performing auxiliary operations such as transportation of stock to rolls, disposal after rolling, cutting, cooling, piling or coiling e-t-c [5]. To study the corrosion behaviour of heat treated rolled medium carbon steel and the as-rolled steel in marine medium (NaCl); 24 specimens were prepared from the as-rolled medium carbon steel sample; 12 out of the specimens were heat-treated. The corrosion susceptibility of the heat treated specimens and as-rolled specimens were investigated.
The objective of this work is to investigate the effects of heat treatment on the corrosion susceptibility of rolled medium carbon steel.
2. MATERIALS AND METHODS
The material used in this study was 12mm diameter rolled medium carbon steel. The spectrometric analysis of the steel was carried out; The Chemical compositions from the analysis are shown in Table 1. Twenty four specimens were prepared from this material using lathe machine; Twelve out of these specimens were heat treated. The corrosion test and metallographic examination of the as-rolled and heat treated specimens were carried out.
2.1.Determination of Operating Temperature
The lower critical temperature (AC1) and upper critical temperature (AC3) were determined by Grange empirical formula [6] as presented here.
[image:2.612.67.556.641.704.2]AC1(oC) = (1333 – 25Mn + 40Si +42Cr– 26 Ni)- (32) 5/9 ---1.1 AC3(oC) = (1570 – 323C – 25Mn + 80Si – 3Cr – 32Ni) – (32) 5/9 –----1.2
Table 1. Chemical Composition of As – Rolled Medium Carbon Steel
C Si Mn P S Cr Mo Ni Al Co Cu Nb Ti
0.353 0.290 0.987 0.050 0.057 0.071 0.005 0.11 0.025 0.015 0.185 0.005 0.0037
V W Pb Sn Zn Fe
2.2. Heat Treatment Processes
Representative samples of as-rolled medium carbon steel were subjected to heat treatment processes
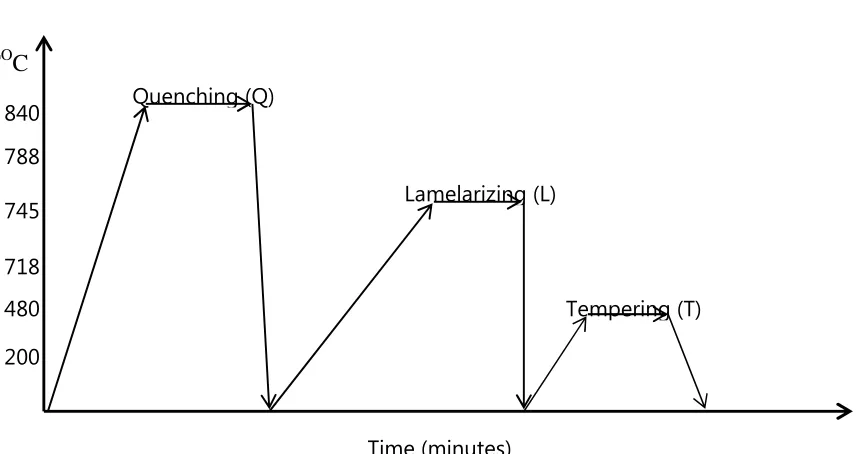
2.2.1. Quenching + Quenching + Lamelarizing + Tempering (Q+Q+L+T)
The steel specimens were heated to the austerizing temperature of 830oC, soaked for 20 minutes and quenched in water, this process was repeated again before the specimens were thereafter heated to the dual phase region at a temperature of 745oC, soaked for 20 minutes again and quenched in water. The specimens were finally tempered at a temperature of 480oC for 30 minutes.
2.2.2 Quenching + Lamelarizing + Tempering (Q + L + T)
The steel specimens were heated to 830oC, soaked for 20 minutes and quenched in water, the specimens were reheated to the dual phase region at a temperature of 745oC, soaked for 20 minutes and quenched in water. The specimens were tempered at temperature of 480oC for 30minutes.
2.2.3 Lamerlarizing + Tempering (L + T)
The specimens were heated to the dual phase region at a temperature of 745oC, soaked for 20 minutes, quenched in water and tempered at 480oC for 30 minutes.
ToC
Figure 1: Temperature- Time Graph involving Quenching, Quenching, Lamelarizing and Tempering (Q + Q + L + T)
200 480 718 745 788
840 Quenching (Q) Quenching (Q)
Lamelarizing (L)
Tempering (T)
[image:3.612.94.531.471.666.2]TOC
Figure 2: Temperature – Time Graph involving Quenching, Lamelarzing and tempering (Q + L + T)
Figure 3: Temperature – Time Graph involving Lamelarzing and Tempering (L+T)
2.3 Corrosion Test
The corrosion rates of as-rolled specimen and heat treat treated specimens were measured by immersing these specimens in a solution of sodium chloride (NaCl). The cross-sectional area of
200 480 718 745 788
840 Quenching (Q)
Lamelarizing (L)
Tempering (T)
Time (minutes)
200 480 718 745 788 840 ToC
Lamelarizing (L)
Tempering (T)
[image:4.612.142.438.388.586.2]each of the specimens was calculated; each of the specimens was also weighed on a chemical balance and the weight recorded. The PH and the electrode potential of the corrosive medium were measured and recorded. After every 3 days interval (72 hours); specimens were retrieved, washed properly in water, dried and
weighed on a weighing balance to determine the weight loss during exposure. The laboratory simulation experiments were carried out in NaCl (O.5M and 1.OM) medium..
Finally, the corrosion rate was calculated using
mpy = 3.45 x 10⁶W ATD
where W = weight loss in g
D = density of specimen in g/cm3
A = Area in cm2
T = Exposure Time in hour
2.4 Metallographic Examination
Samples of as-rolled and heat – treated specimen were mounted in hot phenolic powder and were ground on a water lubricated hand grinding set-up of abrasive papers, progressing through from the coarsest to the finest grit sizes. The 240, 320, 400 and 600 grades were used in that order. Polishing was carried out on a rotating disc of a synthetic velvet polishing cloth impregnated with micron alumna paste. Final polishing was carried out with diamond paste. The specimens were then etched with the standard 2% Nital so as to reveal the ferrite grain boundaries.
The optical microscopic examinations were carried out on a metallurgical microscope at a magnification of 400X. The specimens were illuminated with 100 kilowatts detachable quartz iodine lamp.
3. RESULTS AND DISCUSSION
3.1 Corrosion Properties
contact with the steel and greatly reduces the corrosion rate[8]. After 20 days of exposure, the corrosion rate becomes uniform, this is because the steel is in the thermodynamically stable phase, the surface of the steel becomes immuned and no corrosion occurs as shown in
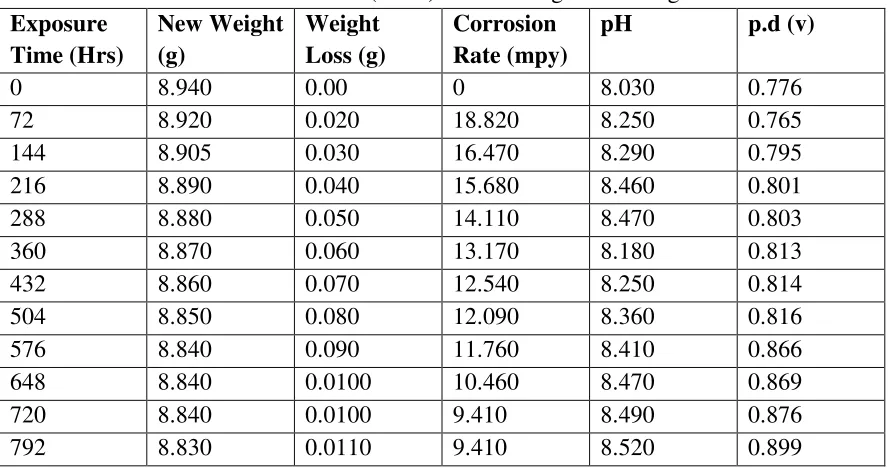
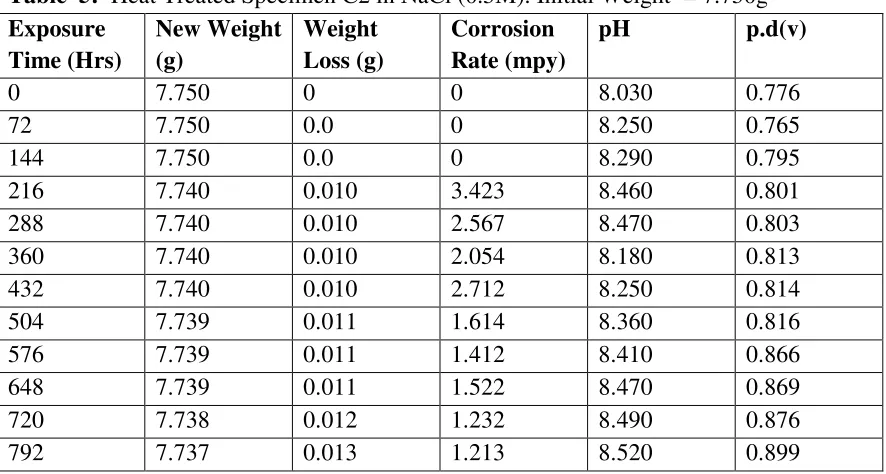
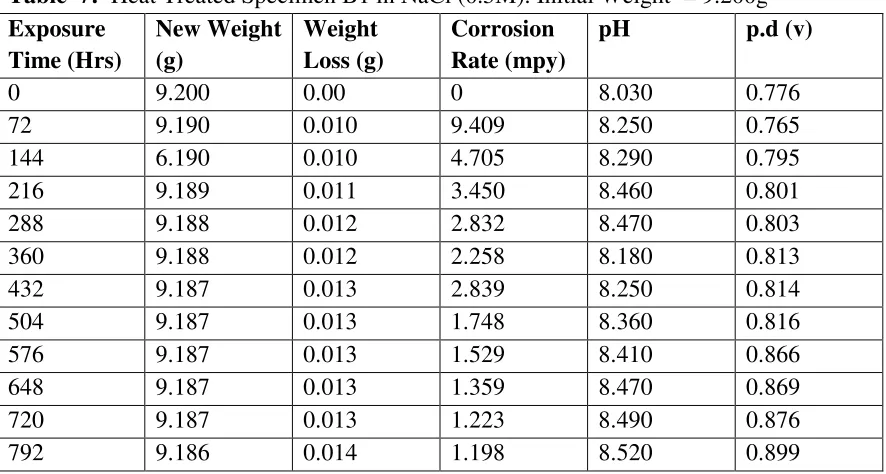
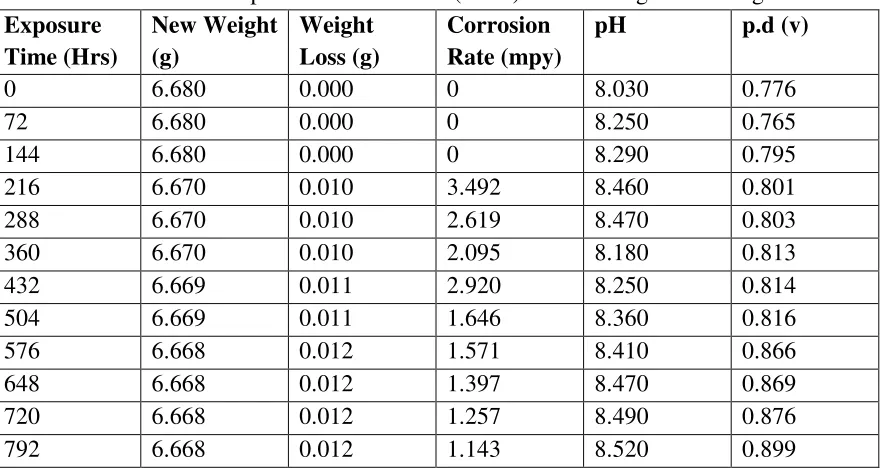
[image:6.612.67.511.195.429.2]Figures 5 – 16. It could be seen that the same trend of corrosion rate hold for all the specimens but the steel developed by Q + L + T process have the least corrosion rate followed by L + T process and Q + Q + L + T process.
Table 2: As – Rolled Steel in NaCl (0.5M). Initial Weight = 8.940g Exposure
Time (Hrs)
New Weight (g)
Weight Loss (g)
Corrosion Rate (mpy)
pH p.d (v)
0 8.940 0.00 0 8.030 0.776
72 8.920 0.020 18.820 8.250 0.765
144 8.905 0.030 16.470 8.290 0.795
216 8.890 0.040 15.680 8.460 0.801
288 8.880 0.050 14.110 8.470 0.803
360 8.870 0.060 13.170 8.180 0.813
432 8.860 0.070 12.540 8.250 0.814
504 8.850 0.080 12.090 8.360 0.816
576 8.840 0.090 11.760 8.410 0.866
648 8.840 0.0100 10.460 8.470 0.869
720 8.840 0.0100 9.410 8.490 0.876
[image:6.612.67.514.201.679.2]792 8.830 0.0110 9.410 8.520 0.899
Table 3: Heat Treated Specimen A2 in NaCl (0.5M). Initial Weight = 7.540g Exposure
Time (Hrs)
New Weight (g)
Weight Loss (g)
Corrosion Rate (mpy)
pH p.d(v)
0 7.540 0 0 8.030 0.776
72 7.530 0.010 10.780 8.250 0.765
144 7.528 0.012 6.740 8.290 0.795
216 7.528 0.012 4.314 8.460 0.801
288 7.528 0.012 2.235 8.470 0.803
360 7.528 0.012 2.588 8.180 0.813
432 7.528 0.012 2.157 8.250 0.814
504 7.528 0.012 1.849 8.360 0.816
576 7.528 0.013 1.753 8.410 0.866
648 7.527 0.013 1.558 8.470 0.869
720 7.526 0.014 1.509 8.490 0.876
Table 4: Heat Treated Specimen B2 in NaCl (0.5M). Initial Weight = 8.120g Exposure
Time (Hrs)
New Weight (g)
Weight Loss (g)
Corrosion Rate (mpy)
pH p.d (v)
0 8.120 0.00 0 8.030 0.776
72 8.110 0.010 9.89 8.250 0.765
144 8.108 0.012 5.936 8.290 0.795
216 8.107 0.013 4.287 8.460 0.801
288 8.106 0.014 2.463 8.470 0.803
360 8.106 0.014 2.770 8.180 0.813
432 8.106 0.014 1.308 8.250 0.814
504 8.106 0.014 1.979 8.360 0.816
576 8.106 0.014 1.731 8.410 0.866
648 8.106 0.014 1.539 8.470 0.869
720 8.105 0.015 1.484 8.490 0.876
792 8.105 0.015 1.349 8.520 0.899
Table 5: Heat Treated Specimen C2 in NaCl (0.5M). Initial Weight = 7.750g Exposure
Time (Hrs)
New Weight (g)
Weight Loss (g)
Corrosion Rate (mpy)
pH p.d(v)
0 7.750 0 0 8.030 0.776
72 7.750 0.0 0 8.250 0.765
144 7.750 0.0 0 8.290 0.795
216 7.740 0.010 3.423 8.460 0.801
288 7.740 0.010 2.567 8.470 0.803
360 7.740 0.010 2.054 8.180 0.813
432 7.740 0.010 2.712 8.250 0.814
504 7.739 0.011 1.614 8.360 0.816
576 7.739 0.011 1.412 8.410 0.866
648 7.739 0.011 1.522 8.470 0.869
720 7.738 0.012 1.232 8.490 0.876
[image:7.612.68.511.374.611.2]Table 6: Heat Treated Specimen A1 in NaCl (0.5M). Initial Weight = 6.890g Exposure
Time (Hrs)
New Weight (g)
Weight Loss (g)
Corrosion Rate (mpy)
pH p.d (v)
0 6.980 0.00 0 8.030 0.776
72 6.970 0.010 11.275 8.250 0.765
144 6.970 0.010 5.637 8.290 0.795
216 6.970 0.010 3.758 8.460 0.801
288 6.969 0.011 3.101 8.470 0.803
360 6.969 0.011 2.481 8.180 0.813
432 6.969 0.011 2.057 8.250 0.814
504 6.969 0.011 1.771 8.360 0.816
576 6.968 0.012 1.691 8.410 0.866
648 6.968 0.012 1.503 8.470 0.869
720 6.967 0.013 1.353 8.490 0.876
792 6.967 0.013 1.333 8.520 0.899
Table 7: Heat Treated Specimen B1 in NaCl (0.5M). Initial Weight = 9.200g Exposure
Time (Hrs)
New Weight (g)
Weight Loss (g)
Corrosion Rate (mpy)
pH p.d (v)
0 9.200 0.00 0 8.030 0.776
72 9.190 0.010 9.409 8.250 0.765
144 6.190 0.010 4.705 8.290 0.795
216 9.189 0.011 3.450 8.460 0.801
288 9.188 0.012 2.832 8.470 0.803
360 9.188 0.012 2.258 8.180 0.813
432 9.187 0.013 2.839 8.250 0.814
504 9.187 0.013 1.748 8.360 0.816
576 9.187 0.013 1.529 8.410 0.866
648 9.187 0.013 1.359 8.470 0.869
720 9.187 0.013 1.223 8.490 0.876
[image:8.612.68.511.374.611.2]Table 8: Heat Treated Specimen C1 in NaCl (0.5M). Initial Weight = 6.680g Exposure Time (Hrs) New Weight (g) Weight Loss (g) Corrosion Rate (mpy)
pH p.d (v)
0 6.680 0.000 0 8.030 0.776
72 6.680 0.000 0 8.250 0.765
144 6.680 0.000 0 8.290 0.795
216 6.670 0.010 3.492 8.460 0.801
288 6.670 0.010 2.619 8.470 0.803
360 6.670 0.010 2.095 8.180 0.813
432 6.669 0.011 2.920 8.250 0.814
504 6.669 0.011 1.646 8.360 0.816
576 6.668 0.012 1.571 8.410 0.866
648 6.668 0.012 1.397 8.470 0.869
720 6.668 0.012 1.257 8.490 0.876
792 6.668 0.012 1.143 8.520 0.899
0 5 10 15 20 25 30 35 40
0 200 400 600 800 1000
Exposure Time (Hrs)
C o rr o s io n R a te ( m p y ) As-Rolled Steel
[image:9.612.76.424.393.611.2]Heat Treated Steel A2 (Q+Q+L+T)
Fig. 4: Corrosion Rate of Heat-Treated Specimen A2(Q+Q+L+T) and As-Rolled Steel in 0.5M NaCl Environment
0 10 20 30 40 50 60 70
0 200 400 600 800 1000
Exposure Time (Hrs)
C o rr o s io n R a te ( m p y ) As-Rolled Steel
Heat Treated Specimen B2 (Q+L+T)
Fig.5: Corrosion Rate of Heat-Treated Specimen B2(Q+L+T) and As-Rolled Steel in 0.5M NaCl Environment 0 10 20 30 40 50 60 70
0 200 400 600 800 1000
Exposure Time (Hrs)
C o rr o s io n R a te ( m p y ) As-Rolled Steel
Heat Treated Specimen C2 (L+T)
Fig.6: Corrosion Rate of Heat-Treated Specimen C2(L+T) and As-Rolled Steel in 0.5M NaCl Environment
0 5 10 15 20 25
0 200 400 600 800 1000
Exposure Time (Hrs)
C o rr o s io n R a te ( m p y
) As-Rolled Steel
[image:11.612.75.406.78.273.2]Heat Treated Specimen A1 (Q+Q+L+T)
Fig. 7: Corrosion Rate of Heat-Treated Specimen A1(Q+Q+L+T) and As-Rolled Steel in 0.5M NaCl Environment
0 5 10 15 20 25
0 200 400 600 800 1000
Exposure Time (Hrs)
C o rr o s io n R a te ( m p y ) As-Rolled Steel
Heat Treated Specimen B1 (Q+L+T)
[image:11.612.76.405.361.568.2]Fig. 9: Corrosion Rate of Heat-Treated Specimen C1(L+T) and As- Rolled Steel in 0.5M NaCl
Environment
3.2Microstructure
The microstructures obtained are shown in Plates 1-7. The microstructure produced by the as-rolled steel consist of pearlite while the microstructure produced by Q + Q + L + T, Q + L + T and L + T processes consist of a duplex ferrite martensite but may contain bainite and retained austenite [9].
The corrosion rates of the heat treated specimens in marine medium (NaCl) is low when compared to that of as-rolled steel. This is because the as-rolled steel which consist of mainly alternate layers of ferrite and cementite, ferrite is anodic to cementite and this corrode with moisture as electrolyte [9-10].
0 2 4 6 8 10 12 14 16
0 200 400 600 800 1000
Exposure Time (Hrs)
C
o
rr
o
s
io
n
R
a
te
(
m
p
y
)
As-Rolled Steell
Plate 1: Microstructure of As – Rolled 5SP Steel etched in 2% Nital (400X) (Pearlitic Structure)
Plate 2: Microstructure of Heat Treated Specimen A2 (Q+Q+L+T) (400X) (Duplex Ferrite – Martensite Microstructure)
Plate 4: Microstructure of Heat Treated Specimen C2 (L+T) (400X) (Duplex ferrite – Martensite Microstructure)
Plate 6: Microstructure of Heat Treated Specimen B1 (Q+L+T) (400X) (Duplex ferrite – Martensite Microstructure)
Plate 7: Microstructure of Heat Treated Specimen C1 (L+T) (400X) (Duplex ferrite – Martensite Microstructure)
4. CONCLUSION
(Q+L+T) process has the best corrosion properties followed by Lamelarizing + Tempering (L+T) process and Quenching + Quenching + Lamelarzing + Tempering (Q+Q+L+T) process. REFERENCES
1. Scully, J.C. (1990). The Fundamental of Corrosion. Maxwell Macmillan Perganman Publishing Corporation, Oxford.
2. Mamoru, O. Yukito, T; Hitoshi, K. and Yuji, F. (1990). Development of New Steel Plates for building Structural use, Nippon Steel Technical Report, No44 pp. 8 – 15.
3. Rajan, T.V; Sharma, C.P. and Sharma, A. (1989). Heat Treatment Principles and Techniques, Prentice Hall of India Private Limited, New Delhi. pp. 36 – 58.
4. O.O. Daramola, B.O. Adewuyi and I.O. Oladele (2010), Effects of Heat Treatment on the Mechanical Properties of Rolled Medium Carbon Steel, Journal of Minerals and Materials Characterization and Engineering; Vol. 9, No. 8, pp. 693 – 708.
5. Thomas, G., Ahn, J.H. and Kin, N.J. (1986) Controlled Rolling Process for Dual-Phase Steel and Shapes. The Metal Society, London, Book 285, pp. 121 – 124.
6. Gorni, A.A. (2004). Steel Forming and Heat-Treating Hand Book; Vol. 2, Saova Center, Brazil, p. 4.
7. Faleke, E.O. (1987). Metallurgical Investigation of a Corroded Peugeot Car Body. Unpublished Thesis, Federal University of Technology, Akure
8. Baboian and Turcotte, (1985). Corrosion Sceince. Elservier Science Limited, Great Britain. Volume 25, No 13, pp. 958 – 1009.
9 Davies, D.J. and Harold, W. (1971). Practical Microcopical Metallography, Chapman and Hall Limited, London.
10. Davis, D.J. and Oelman, L.A. (1983). The Structure, Properties, and Heat Treatment of Metals, London, Pitman Books, pp. 44 – 52.
11. Smith, W.F. and Hashemi, J. (2006). Foundations of Materials Science and Engineering, 4th Edition; Mcgraws – Hill Book. pp. 28 – 36.