doi:10.4236/jbise.2010.312154 Published Online December 2010 (http://www.SciRP.org/journal/jbise/).
Published Online December 2010 in SciRes. http://www.scirp.org/journal/JBiSE
A wavelet-approximate entropy method for epileptic activity
detection from EEG and its sub-bands
Hamed Vavadi, Ahmad Ayatollahi, Ahmad Mirzaei
School of Electrical Engineering, Iran University of Science and Technology, Tehran, Iran. Email: [email protected]; [email protected]; [email protected]
Received 11 October 2010; received 20 October 2010; accepted 26 October 2010.
ABSTRACT
Epilepsy is a common brain disorder that about 1% of world's population suffers from this disorder. EEG signal is summation of brain electrical activities and has a lot of information about brain states and also used in several epilepsy detection methods. In this study, a wavelet-approximate entropy method is ap-plied for epilepsy detection from EEG signal. First wavelet analysis is applied for decomposing the EEG signal to delta, theta, alpha, beta and gamma sub- ands. Then approximate entropy that is a chaotic measure and can be used in estimation complexity of time series applied to EEG and its sub-bands. We used this method for separating 5 group EEG signals (healthy with opened eye, healthy with closed eye, interictal in none focal zone, interictal in focal zone and seizure onset signals). For evaluating separation ability of this method we used t-student statistical analysis. For all pair of groups we have 99.99% separation probability in at least 2 bands of these 6 bands (EEG and its 5 sub-bands). In comparing some groups we have over 99.98% for EEG and all its sub-bands.
Keywords: Approximate Entropy (ApEn); Wavelet Transform; Epilepsy Detection; EEG Signal; T-Student
1. INTRODUCTION
Epilepsy is a common and important brain disorder and about 1% of world population suffers from this disorder. So diagnosis of epileptic activity in brain can be useful for these patients. As we know, abnormal neuronal firing in the brain is the reason of epileptic activities or seizure onsets. And these activities are evident in Electroen-cephalogram (EEG) signal. EEG is summation of neu-ronal electrical Activities and widely used in diagnosis epileptic disorders and seizure onsets. Three different states (healthy, interictal and ictal) obvious in monitoring
EEG signal for diagnosis epileptic activities. Brain ac-tivity in the ictal, interictal and healthy states are sig-nificantly different. Since 1970s EEG signal used for automatic diagnosis of epileptic activities in brain. Till now several methods used for this purpose, since the first days of automatic seizure detection, representations based on Fourier transform and parametric methods have been applied [1].
Through the complex and chaotic behavior of brain activity chaos related parameters are useful to identify-ing epilepsy. Entropies, fractal dimensions, Lyapunov exponents are main complexity parameters. Also artifi-cial neural network based methods and wavelet based methods used to diagnosis epilepsy. Also time-frequency methods used for feature extraction from EEG signal. Alexandros T. Tzallas has been used t-f analysis to de-termine the EEG segments, which contains epileptic seizures and extraction feature from power spectral den-sity (PSD) [2]. It seems that using Discrete Wavelet Transform (DWT) is better than the Fourier and Fast Fourier Transform since by wavelet transform we have better time-frequency localization, multi-rate filtering, and scale-space analysis [3].
Hiram Firpi presented a methodology to capture one or more deterministic dynamic components of EEG sig-nal Using Genetically Programmed Artificial Features [4].
Al-though there is different definition for entropy and the way to calculate it but all kind of entropies show system randomness and regularity.
Some researches based on sample and spectral en-tropy [10] have been done in application of automatic seizure detection. Also Shannon entropy [11,12] and Permutation entropy [13] have been used as suitable features in the case of non-stationary time series. How-ever all of these kinds of entropies are so useful and ap-plicable. in the other hand, approximate entropy is the most usable parameter in this field[14-16]. In the last decade of century 20, STEVEN M. PINCUS introduces approximate entropy as an efficient measure of systems complexity [17]. Till now this parameter used in several EEG based applications [18,19]. In some researches just approximate entropy have been calculated for EEG [20] and some methods have been used approximate entropy with another parameter for increasing accuracy [21]. In this study, a wavelet-approximate entropy method is used for epilepsy detection. We used EEG standard
subbands that are suitable in analysis and conclusion.
2. MATERIALS AND METHODS
2.1. EEG Dataset
The dataset contains 500 single channel EEG segments in five different sets (100 single channel EEG segments for each O, Z, F, N, and S sets). Sets O and Z are in healthy state with eyes open and closed, respectively. This two sets of segments (O, Z) captured by external surface electrodes. Sets F and N are in interictal state obtained from epileptic zone and hippocampus zone of brain, respectively. Set S refer to ictal state. These three sets of segments (F, N and S) attained by intracranial electrode.
[image:2.595.115.481.344.707.2]The duration of each segment is 23.6 sec and sampled by 173.61 Hz, so each segment contains 4096 samples. All these EEG segments are recorded with the same 128-channel amplifier that converts by 12 A/D convertor with bit rate of 12, and then were sampled on 173.61 Hz [22].
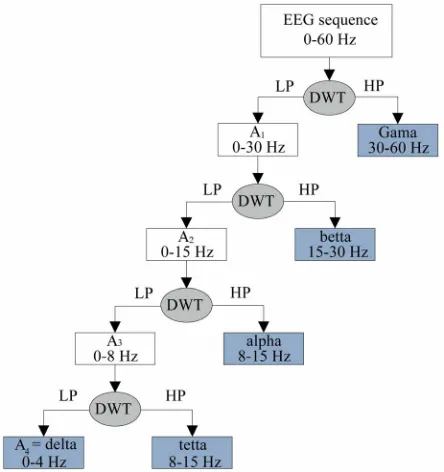
2.2. Wavelet Decomposition
The time-frequency representation based on Fourier analysis suffers from a significant problem because the spectral election is based on a sinusoidal representation that has an infinite extent in the basis function. Wavelet analysis idea was developed because of this defect of time-frequency analysis. A wavelet is a “short wave”, which has its energy concentrated in time to give a tool for the analysis of transient, non-stationary, or time- varying phenomena [8]. Several works applied the Wavelet Transform to the study of EEGs. Wavelet analy-sis can represent EEG sub bands as a weighted sum of shifted and scaled versions of the original wavelet, without any loss of information and energy.
To achieve better results in feature extraction with ApEn algorithm, with wavelet decomposition has been used as a preprocessing level for EEG segments to ex-tract five physiological EEG bands,delta (0-4 Hz), theta (4-8 Hz), alpha (8-13 Hz), beta (13-30), and gamma (30-60 Hz).
For this goal four levels discrete wavelet transform (DWT) with third-order Daubechies (db3) wavelet func-tion have been used. Since our dataset is in range 0-60 Hz, coefficients D1, D2, D3, D4 and A4 corresponding to 30-60 Hz, 15-30 Hz, 8-15 Hz, 4-8 Hz and 0-4 Hz re-spectively that are almost standard physiological sub-bands. Now we can calculate Approximate Entropy for each sub-band in the next level.
2.3. Approximate Entropy
Approximate entropy (ApEn) is a quantification measure which gives us lots of information about complexity and regularity of time series data.
For a given N point time series data
1 , 2 , 3 , ,
X x x x x N
Choose m points subsequences of EEG signal as be-low:
1 , 2 , 3 , , 1
X i x i x i x i x i m
For 1 i N m 1
Then define the distance between X(i) and X(j), d[X(i),
X(j)], as the maximum absolute difference between them as below:
k=1,2,L,m
, max 1
d X i X j x i k X jk 1
And define RCO as:
RCO r std
[image:3.595.314.536.80.316.2]That STD is the standard deviation of sequence, and r can be varying between 0 and 1. Then we define as below:
Figure 2. Decomposition of EEG sequence with five level discrete wavelet transform and extract five phisiological sub- bands.
1 , 1
0
j
if d X i X j RCO for j N m
other wise
We define Cim
1
1 1 1 N m m i j i C RCO
N m
Then we can define m as below
r
1 m
i 1 1 log C 1 N m m i r N m
For fixed m and r, ApEn value of sequence is:
1 ApEn m,RCO m RCO m RCO
We used the EEG and its sub-bands extracted from the wavelet decomposition as inputs for ApEn algorithm. We calculate ApEn value for each sub-band with r = 0.15. For calculating ApEn value for each segment we used 0.5 second sub-segments of each segment and av-eraged the calculated values over length of each seg-ment.
Although it’s not necessary to average ApEn value calculated for sub-segments over each segment but it can be useful and reduce noise and artifacts effects on ApEn value for each segment. We performed this procedure for all 100 segments in each group and finally we have 100 ApEn value for each group (1 ApEn value for each seg-ment in group). The mean and standard deviation of ApEn value for each group has been shown in Table 1
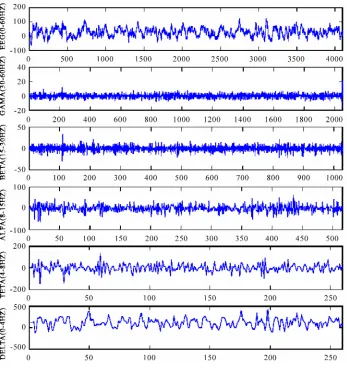
Figure 3. Wavelet coefficient for a segment of EEG signal decomposed by 4 levels DWT.
and Table 2.
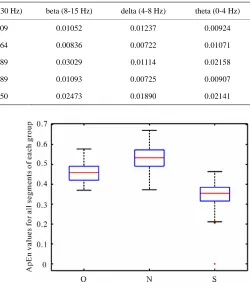
The ApEn value has been calculated for EEG as we see in Figure 4 although has different mean for all 5 group and we can see this difference in Figure 4. As we see in Figure 5 without any analysis clearly it has dif-ferent value for most segments of healthy with eyes close and interictal in nonfocal zone and ictal segments. But ApEn values for healthy segments and interictal in focal zone have overlap with other groups in original EEG segments.
2.4. T-student Analytical Analysis
Statistical tests allow us to make statements with a de-gree of precision, but cannot actually prove or disprove anything. A significant result at the 95% probability level tells us that our data are good enough to support a conclusion with 95% confidence (but there is a 1 in 20 chance of being wrong). In biological work we accept this level of significance as being reasonable. T–test is a statistical analysis for estimate the probability of segre-gate between two groups of data.
T –test uses the mean and variance of each group to calculate segregation probability (p-value). For this goal we must first calculate t-score and degree of freedom (df).
For calculating t-score we need first to calculate that is variance of the difference between the two means.
d S
2 2 2 1 2 1 2
d
S S
S
n n
And and are variance of group 1 and group 2 respectively and also are length of group 1 and group
1 1
S S12
1
n n2
1 2
d
X X
t S
Which X1 and X2 are mean of group 1 and group
2 respectively. And degree of freedom is calculated as:
2 2 2 2
2 1
2 1 2
2
1 1 2 1
d
S S
n n
df S
n n
Table 1. Mean of ApEn value for each group of EEG segments and their sub-bands.
EEG (0-60 Hz) gamma (30-60 Hz) alpha (15-30 Hz) beta (8-15 Hz) delta (4-8 Hz) theta (0-4 Hz)
Z 0.19405 0.10457 0.11704 0.17796 0.17155 0.17670
O 0.23011 0.10396 0.11104 0.18613 0.17508 0.17457
F 0.30957 0.16150 0.15622 0.20147 0.16922 0.15888
N 0.34250 0.12386 0.15622 0.18628 0.16964 0.16554
[image:5.595.56.543.96.208.2]S 0.19994 0.22115 0.15962 0.18498 0.16751 0.15719
Table 2. Standard deviation of ApEn value for each group of EEG segments and their sub-bands.
EEG (0-60 Hz) gamma (30-60 Hz) alpha (15-30 Hz) beta (8-15 Hz) delta (4-8 Hz) theta (0-4 Hz)
Z 0.02819 0.01611 0.00909 0.01052 0.01237 0.00924
O 0.04149 0.00977 0.00764 0.00836 0.00722 0.01071
F 0.05089 0.08510 0.06089 0.03029 0.01114 0.02158
N 0.04585 0.04233 0.06089 0.01093 0.00725 0.00907
[image:5.595.284.534.235.523.2]S 0.03344 0.07088 0.04150 0.02473 0.01890 0.02141
Figure 4. ApEn value for all 100 segments of EEG data for each group (O-healthy with eyes open, Z-healthy with eyes close, F- interictal in focal zone, N- interictal in nonfocal zone and S- ictal).
After calculating score and we can extract p-value from p-value table of t-test analysis.
t df
In this work ApEn value computed for each segment and its sub-bands used to compare same sub-band of each group with other group.
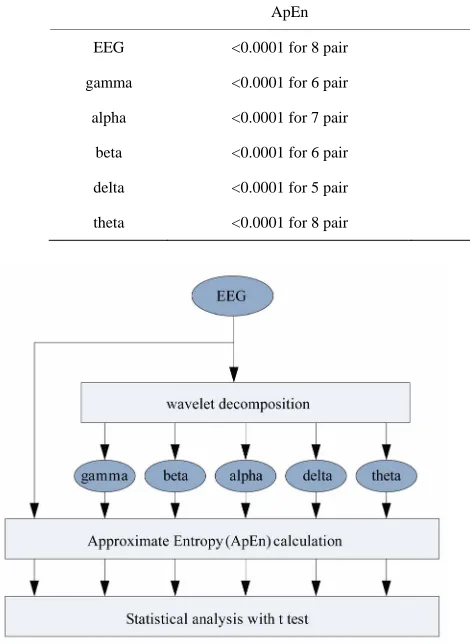
2.5. Summary of method
Step 1: wavelet decomposition of EEG signal to achieve standard physiological sub-bands
Step 2: calculating Approximate Entropy (ApEn) value for EEG and its sub-bands
Step 3: statistical analysis with t test for investigate
Figure 5. ApEn value for all 100 segments of EEG data for 3 different states (O-healthy with eyes open, N- interictal in nonfocal zone and S- ictal).
the potential of separation between groups with extracted features with Approximate Entropy (ApEn) for EEG and its sub-bands.
3. RESULTS
Means and variances of ApEn values have been calcu-lated for these 5 groups are shown in Table 1 and 2. With these parameters we calculate t-score and degree of freedom for all EEG data and their sub-bands. With these values we tabulate P-values of two sided t-test and the results shown as Table 3.
The confidence interval for most groups are so good and as we see in Table 3 most of parameters extracted
[image:5.595.59.307.238.521.2]Table 3. Assuming the null hypothesis for each pair of groups and their sub-bands.
EEG gamma alpha beta delta theta
Z&O <0.0001 0.9759 0.0005 0.0002 <0.0001 0.0026
Z&F 0.002 <0.0001 <0.0001 <0.0001 <0.0001 <0.0001
Z&N <0.0001 <.0001 <0.0001 <0.0001 <0.0001 <0.0001
Z&S <0.0001 <0.0001 <0.0001 <0.0001 0.0011 <0.0001
O&F <0.0001 <0.0001 <0.0001 0.0066 0.0041 0.0061
O&N 0.0949 <0.0001 <0.0001 0.4511 <0.0001 0.1092
O&S <0.0001 <0.0001 0.0002 <0.0001 <0.0001 0.0001
F&N <0.0001 0.0002 NaN 0.5883 0.0043 0.9731
F&S <0.0001 0.0353 <0.0001 <0.0001 0.1371 <0.0001
N&S <0.0001 0.9816 <0.0001 <0.0001 0.0087 <0.0001
Table 4. Comparison significance of ApEn and CD and LLE.
ApEn CD [3] LLE [3]
EEG <0.0001 for 8 pair <0.0001 for 2pair <0.0001 for 3pair
gamma <0.0001 for 6 pair --- <0.0001 for 2pair
alpha <0.0001 for 7 pair --- <0.0001 for 2pair
beta <0.0001 for 6 pair <0.0001 for 2pair <0.0001 for 3pair
delta <0.0001 for 5 pair <0.0001 for 2pair ---
theta <0.0001 for 8 pair <0.0001 for 2pair ---
Figure 6. Block diagram of overall method.
for these 5 groups show considerable difference between these groups.
We compared all pairs of groups but distinguishment between states shows that different epileptic state (healthy,
interictal and ictal) was more important in our approach. But the parameters extracted by this method can separate even groups in same state (such Z and O or F and S) as well as other groups. For example we can find out our signal is interictal and it is from focal or nonfocal zone.
For Z and O except the gamma sub-bands we have very noticeable separation (all of the sub-bands over 99.95% except gamma).
[image:6.595.60.295.322.644.2]sub-bands have separation rate over 99.99%. distin-guishment for this pair of group in beta sub-band is 54. 99% and for delta sub-band is 89.08%.
Comparing O with S shows up to 99.99% separation probability for EEG, gamma, beta, delta and theta sub-bands and 99.98% for alpha subband.
For groups F and N the EEG signal has separation with over 99.99% probability and 99.98% for gamma sub-band. For alpha sub-band we can’t tabulate P-value since both of the t-score and degree of freedom were zero. Beta and theta sub-bands don’t show good separa-tion rate (41.17% and 0.269%) but delta sub-band has 99.57% probability for separation rate.
For comparing interictal and ictal states (F and S, and N and S) EEG signal and alpha, beta and theta sub-bands have separation probability over 99.99% for both pairs F, S and N, S. As we see in table 3 separation probability between F and S for gamma sub-band is 96.47% and 86.29% for delta sub-band.
Separation rate for pair N, S in gamma sub-band isn’t good not at all (1.84%) but for alpha sub-band is suitable (99.13%).
4. DISCUSSION
Some other studies have been done in feature extraction for epilepsy detection. But most of them just have used for separate 3 groups of these 5 groups and have ignored the other ones [3,23]. The extracted parameters in this study can separate all of these 5 groups. Considering just 3 groups of these 5 groups shows significant difference (see Figure 5). In comparison ApEn with CD and LLE [3] we can see two major improvements.
1) We calculate separation rates for all 10 pairs with all of 5 groups but in [3] and some other studies just 3 groups have been considered.
2) ApEn values can separate most sub-bands of each pair but as we see in Table 4. In some sub-bands corre-lation dimension or largest lyapanov exponent don't show significant difference. And in other sub-bands these values just can separate 2 or 3 pair of groups.
5. Conclusion
In this study, the Approximate Entropy combined with wavelet analysis used to extract the features for epilepsy detection. In order to automatic detection of epileptic activity in EEG signals we have 3 different states (healthy, interictal and ictal) and significant results are obtained. The value of ApEn can be used to distinguish the different EEG state. According to ApEn analysis features of EEG and their sub-bands show acceptable performances in our approach. Our extracted feature can be useful and applicable for automatic detection of brain diseases such as epilepsy. The approaches of using ApEn
combined with wavelet analysis suggest new idea and method for detecting the features of epileptic activities in EEG signal.
This method also can be used for other non-stationary signals and other approach. Because the speed of this method is high enough, we can use this method for real-time non-stationary signals.
REFERENCES
[1] Subasi, A. and Erçelebi, E. (2005) Classification of EEG signals using neural network and logistic regression. Computer Methods and Programs in Biomedicine, 78, 87-99.
[2] Sakkalis, V. and Doru Giurc˘aneanu, C. (2009) Assess-ment of linear and nonlinear synchronization measures for analyzing EEG in a mild epileptic paradigm. IEEE Transaction on Information Technology in Biomedicine, 13, 433-441.
[3] Adeli, H., Ghosh-Dastidar, S. and Dadmehr, N. (2007) A wavelet-chaos methodology for analysis of EEGs and EEG sub-bands to detect seizure and epilepsy. IEEE Transac-tions on Biomedical Engineering, 54, 205-211.
[4] Firpi, H., Goodman, E.D. and Echauz, J. (2007) Epileptic seizure detection using genetically programmed artificial features. IEEE Transactions on Biomedical Engineering, 54, 212-224.
[5] Babloyantz, A. and Destexhe, A. (1986) Low-dimen-sional chaos in an instance of epilepsy. Proceedings of the National Academy of Science (USA), 83, 3513-3517. [6] Lai, Y.-C., Osorio, I., Harrison, M.A.F. and Frei M.G.
(2002) Correlation-dimension and autocorrelation fluc-tuations in epileptic seizure dynamics. Journal of Ameri-can Physical Society, 65, 1-5.
[7] Natarajan, K., Acharya, R., Alias, F., Tiboleng, T. and Puthusserypady, S.K. (2004) Nonlinear analysis of EEG signals at different mental states. BioMedical Engineer-ing, 3, 1-11.
[8] Ghosh-Dastidar, S., Adeli, H. and Dadmehr, N. (2007) Mixed-band wavelet-chaos-neural network methodology for epilepsy and epileptic seizure detection. IEEE Trans-actions on Biomedical Engineering, 54, 1545-1551. [9] Bibian, S., ZlKov, T., Dumont, G.A. Ries, C.R. Puil, E.,
Ahmad, H., Huzmeza’N, M. and Macleod, B.A. (2001) Estimation the Anesthetic depth using wavelet analysis of electroencephalogeram. Proceedings of the 23rd Annual EMBS International Conference. Istanbul, Turkey, Octo-ber 2001, 951-955.
[10] Kumar, S.P., Sriraam, N. and Benakop, P.G. (2008) Auto-mated detection of epileptic seizures using wavelet en-tropy feature with recurrent neural network classifier. IEEE Region 10 Conference, Heyderabad, 1-5.
[11] Kannathalab, N., Choob, M.L., Acharyab, U.R. and Sa-dasivana, P.K. (2005) Entropies for detection of epilepsy in EEG. Computer Methods and Programs in Biomedi-cine, 80, 187-194.
[12] Bruhn, J., Lehmann, L.E., Röpcke, H., Bouillon T.W. and Hoeft A. (2001) Shannon entropy applied to the meas-urement of the lector encephalographic effects of desflu-rane. American Society of Anesthesiologists Jurnal, 95,
30-35.
[13] Cao, Y.H., Tung, W.W., Gao, J.B., Protopopescu, V.A. and Hively, L.M. (2004) Detecting dynamical changes in time series using the permutation entropy. Journal of American Physical Society, 70, 1-7.
[14] Vukkadala, S., Vijayalakshmi, S. and Vijayapriya, S. (2009) Automated detection of epileptic EEG using ap-proximate entropy in elman networks. International Journal of Recent Trends in Engineering, 1, 307-312. [15] Filho, A.P., Cukiert, A. and Diambra, L. (2006) Peri-ictal
complexity loss as determined by approximate entropy analysis in the electrocorticogram obtained from chronic subdural recordings in patients with refractory temporal lobe epilepsy. Journal of Epilepsy and Clinical Neuro-physiology, 12, 191-199.
[16] Ocak, H. (2009) Automatic detection of epileptic seizures in EEG using discrete wavelet transform and approxi-mate entropy. Elsevier Journal of Expert Systems with Applications, 36, 2027-2036.
[17] Pincus, S.M. (1991) Approximate entropy as a measure of system complexity. Proceedings of the National Academy of Science (USA), 88, 2297-2301.
[18] Wang, L., Xu, G.Z., Wang, J. Yang, S. and Yan, W.L. (2007) Feature extraction of mental task in BCI based on the method of approximate entropy. Proceedings of the 29th Annual International Conference of the IEEE EMBS, Cité Internationale, Lyon, August 2007, 1941-1944.
[19] Wang, Y.R., Wang, W., Liu, Y.L., Wang, D., Liu, B.W. Shi, Y.J. and Gao, P. (2009) Feature Extracting of Weak Signal in Real-Time Sleeping EEG with Approximate Entropy and Bispectrum Analysis. ICBBE 2009. 3rd In-ternational Conference on Bioinformatics and Biomedi-cal Engineering, Beijing, June 2009, 1-4.
[20] Srinivasan, V., Eswaran, C. and Sriraam N. (2007) Ap-proximate entropy-based epileptic EEG detection using artificial neural networks. IEEE Transaction on Informa-tion Technology in Biomedicine, 11, 288-295.
[21] Abásolo, D., James, C.J. and Hornero, R. (2007) Non- linear analysis of intracranial electroencephalogram re-cordings with approximate entropy and lempel-ziv com-plexity for epileptic seizure detection. Proceedings of the 29th Annual International Conference of the IEEE EMBS, Cité Internationale, Lyon, France, Aug 2007, 1953-1956. [22] Andrzejak, R.G., Lehnertz, K., Mormann, F., Rieke, C.,
David, P. and Elger, C.E. (2001) Indications of nonlinear deterministic and finite-dimensional structures in time series of brain electrical activity: Dependence on re-cording region and brain state. Journal of American Physical Society, 64, 1-8.