ISSN Online: 2331-4249 ISSN Print: 2331-4222
DOI: 10.4236/wjet.2019.73032 Aug. 20, 2019 429 World Journal of Engineering and Technology
Availability, Performance
and Reliability Evaluation
for PV Distributed Generation
Abdulrahman K. Al-Sefri, Abdullah M. Al-Shaalan
King Saud University, Riyadh, KSA
Abstract
Nowadays, renewable energy resources play an important role in replacing conventional energy resources such as fossil fuel by integrating solar, wind and geothermal energy. Photovoltaic energy is one of the very promising re-newable energy resources which grew rapidly in the past few years, it can be used to produce electric energy through photovoltaic process. The primary objective of the research proposed in this paper is to facilitate the increasing penetration levels of PV systems in the electric distribution networks. In this work, the PV module electrical model is presented based on the mathematical equations and was implemented on MATLAB to simulate the non-linear characteristics I-V and P-V curves with variable input parameters which are irradiance and temperature based on Riyadh region. In addition, the reliabil-ity evaluation of distribution networks, including distributed generators of so-lar photovoltaic (PV) with varying output power capacity is presented also. The Monte Carlo simulation algorithm is applied to test the distribution net-work which is RBTS Bus 2 and the same has been conducted on the original case of distribution network substation 7029 which is located at KSA Riyadh. The two distribution networks have been modified to include the PV’s distri-buted generators. The distridistri-buted generators contribute to supply a part of the load during normal mode and supply the entire load during component failure or failure of grid operation supply. The PV stochastic models have been used to simulate the randomness of these resources. Moreover, the study shows that the implementation and integration of renewable resources as distributed generations have improved the reliability of the distribution networks.
Keywords
Renewable Resources, Photovoltaic (PV) Energy, Distributed Generation (DG), Distribution Networks
How to cite this paper: Al-Sefri, A.K. and Al-Shaalan, A.M. (2019) Availability, Per-formance and Reliability Evaluation for PV Distributed Generation. World Journal of Engineering and Technology, 7, 429-454.
https://doi.org/10.4236/wjet.2019.73032
Received: June 21, 2019 Accepted: August 17, 2019 Published: August 20, 2019
Copyright © 2019 by author(s) and Scientific Research Publishing Inc. This work is licensed under the Creative Commons Attribution International License (CC BY 4.0).
http://creativecommons.org/licenses/by/4.0/
DOI: 10.4236/wjet.2019.73032 430 World Journal of Engineering and Technology
1. Introduction
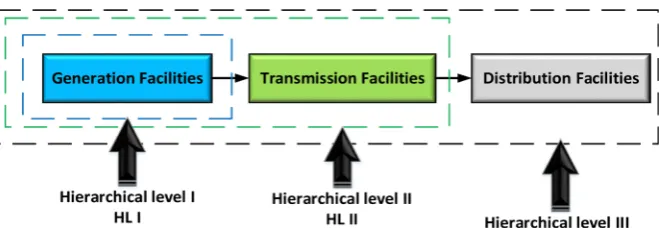
The electric power system has been used to generate, transmit and distribute power since the advent of electricity evolution and the foremost important ob-jective of an electrical utility is to deliver economical, reliable, and quality power to its consumer. The electrical power network is extremely complex, a failure may result in loss of power to a large number of customers or sometimes cata-strophic events such as blackouts and it is difficult to analyze the entire system at once. For this reason, the power system is divided into three functional zones such as generation facility, transmission facility and distribution facility to eva-luate the reliability of the system. These functional zones in series can be consi-dered as the hierarchical levels of the power system reliability studies as shown in Figure 1 [1]. Hierarchical level I deals with the reliability evaluation of only generation system and the main indices analyzed in this study are loss of load expectation (LOLE), loss of energy expectation (LOEE), failure frequency and failure duration. Hierarchical level II is composed of generation and transmis-sion facilities and it deals with the reliability evaluation of both generation and transmission systems. Hierarchical level III includes all of the three functional zones and refers to the complete electric power system. It deals with the reliabil-ity evaluation of the generation, transmission and distribution systems.
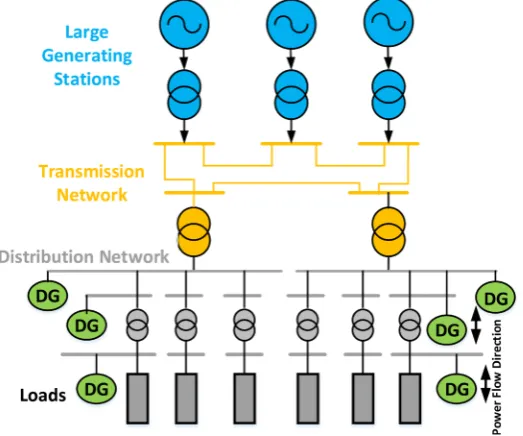
The conventional structure of electrical power systems has been developed mainly to become as following arrangement shown below in Figure 2. The elec-tric power is generated in large generating plants at a relatively small number of locations which will here be called central stations.
The incorporation and integration of non-conventional or renewable energy sources in the network result in a new term called Distributed Generation (DG). DG can be defined as small-scale power generation units of electricity (a few ki-lowatts kW) connected directly to the grid, distribution network, on consumer side of the meter to serve a customer on site and at the same time to provide the support to distribution networks or work standalone with different rating levels.
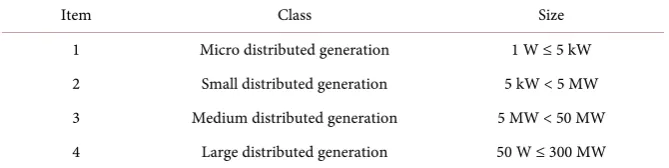
Table 1 presented the generation of DG at different levels [2].
[image:2.595.210.540.593.707.2]The integration of DGs becomes the most economical solution to meet the increased demand due to load growth in the conventional system. While pro-viding environmentally friendly energy and while helping to meet the increasing load economically. It can play an important role in electrical power network
DOI: 10.4236/wjet.2019.73032 431 World Journal of Engineering and Technology
Figure 2. Conventional large electric power system.
Table 1. Generation of DG at different level [2].
Item Class Size
1 Micro distributed generation 1 W ≤ 5 kW
2 Small distributed generation 5 kW < 5 MW
3 Medium distributed generation 5 MW < 50 MW
4 Large distributed generation 50 W ≤ 300 MW
and by employing this technology in power systems has big advantages as fol-lowing:
• Improving the reliability of the electrical network by providing an alternative source during power disturbance events.
• Reducing the electrical transmission power losses caused by the power trav-eling through long transmission lines and high voltage transformers.
• Providing better voltage support, used to supporting peak load and supply electricity during peak periods.
• Improving the power quality and enabling consumers to select the source of energy based on the cost and awareness of the environmental issues.
• Relieving the congested of electrical transmission networks and reducing the need to expand the electrical transmission networks.
• DGs considered as a viable alternative of energy storage alternative when in-terruptions are frequent. It works as Backup supply to ensure the uninter-rupted electricity.
[image:3.595.206.541.342.426.2]DOI: 10.4236/wjet.2019.73032 432 World Journal of Engineering and Technology wind, and geothermal. Moreover, the last few years, a number of factors have led to an increased interest in distributed generation schemes such as availability of modular generating plant, ease of finding sites for smaller generators, short con-struction time and lower capital costs for smaller plant, reduction in gaseous emissions (mainly CO2). Due to the DG sources have a potential solution for
some issues, like the deregulation in power system and improving the perfor-mance of distribution system as well as reliability evaluation, that is making it more popular. The presence of the DGs, especially when the DG share is signifi-cantly high, will obviously impact on way of power system operation. The dis-tribution networks can be designed for (radial) unidirectional power flow, and the electric power systems with DGs spread across the distribution network is shown in Figure 3.
In recent years there has been an increase in the global trend in general and particular in Kingdom of Saudi Arabia (KSA) towards finding and exploiting sources of renewable energy to generate electricity. This may be due to the ur-gent need for new and renewable sources of energy that are not fading and dep-leting. One of the reasons for this is that these sources limit the emission of toxic gases as well as saving energy costs and conserving their stocks from fossil sources (oil and natural gas) and not relying on it total. Due to the high prices of fossil fuels with the rapid rises in oil prices, capital costs of conventional power plants, escalation in power demand due to rapid growth in population and indu-strialization in the last several years especially in Saudi Arabia.
[image:4.595.244.506.490.708.2]The conventional generation, low quality fuels and the methods of generation typical in KSA is a chief cause of environmental pollution and impacts human health through emissions of harmful gases that are remains a threat to public health around the world. Therefore, it is essential to find green power source that re-duce the gasses emission and preserves oil in Saudi Arabia. So, the renewable energy
DOI: 10.4236/wjet.2019.73032 433 World Journal of Engineering and Technology resources have been globally accepted for power generation, utilizing and inte-grated them with conventional generation around the globe.
The solar radiation is variable in different parts of the world and the highest value of solar radiation located at Sunbelt. Saudi Arabia is most suitable country over the world for using solar power and its solar irradiances are among the highest in the world because it located in the “Global Sunbelt”, a geographic re-gion situated between 35˚N and 35˚S. The generally characterized by high solar irradiation which can be witnessed in Figure 4.
KSA has widespread desert land, year-round clear skies and abundant solar resource which it to become one of the largest solar photovoltaic (PV) energy producers in future and a world leader in renewable electricity generation. Stu-dies show that the use of solar equipment in KSA is very suitable and can easily provide part of the energy that nation needs.
The Several sources, including Snapshot of Global PV Markets 2016 [4], state that the total installed PV capacity at the end of 2016 was at least 303 GW. In addition, there is an estimated capacity of between 3000 GW and 10,000 GW expected to be installed by the year 2030 [5]. As part of the kingdom’s 2030 vi-sion, to build the largest PV generation plant over the world, and KSA aims to cut down overreliance on oil and gas as the principal sources of energy in the generation of electricity and KSA government is backing the process of energy source diversification to keep the oil for next generations. The KSA targeting to generate 3.45 GW of renewable energy by 2020 and 9.5 GW by 2022 [6]. In re-cent years the KSA was is ranked as the 12th largest consumer of total primary
[image:5.595.211.538.514.705.2]energy in year 2013, of which about 60% is petroleum based and the rest was accounted to natural gas. Energy consumption per capita is twice that of Europe and three times the world average [6]. By the Year 2032, the electricity peak de-mand is anticipated to surpass 120 GW [7]. The King Abdullah City for Atomic and Renewable Energy (KACARE) program seeks to ensure that half of the elec-tricity generated in Saudi Arabia comes from renewable sources by 2032 [8].
DOI: 10.4236/wjet.2019.73032 434 World Journal of Engineering and Technology
2. Solar Radiation
[image:6.595.208.540.251.476.2]The solar resource and weather conditions of a place are often intermittent and prone to vary from one year to another year, so the datasets need to be compiled over a number of years to create historical site data. The statistical model of solar radiation is based on data for the solar irradiance at KSA-Riyadh, during period Jan 2013-Jan 2016 which is available in King Abdullah City for Atomic and Re-newable Energy’s (K.A.CARE’s) ReRe-newable Resource Monitoring and Mapping (RRMM). Figure 5 shows the calculated distribution of the hourly average glob-al, direct, and diffuse Solar Irradiance. Figure 6 shows the calculated monthly distribution average GHI of solar irradiance throughout the past time frame in Riyadh city.
Figure 5. Hourly average DNI, DHI and GHI of solar irradiance (Wh/m2).
[image:6.595.208.541.502.704.2]DOI: 10.4236/wjet.2019.73032 435 World Journal of Engineering and Technology The solar radiation in Riyadh is characterized by long radiation period with high irradiance during summer and short radiation period with low irradiance during winter due to the differences in the sun’s height at the summer and win-ter solstice. The solar irradiance is fluctuated from month to month based on the sun orbit. The highest value of monthly solar irradiance was for May, Jun, and July with maximum value 8134 (Wh/m2) for Jun.
3. DG Model
It is well known that due to the fact that solar insolation is intermittent and the output power of PV systems is not deterministic. For this reason need for a sto-chastic model to simulate PV outputs. A stosto-chastic model is a simulation-based technique to describe a non-deterministic behavior and the randomness of the system. The statistical data of solar insolation and temperature have been col-lected from (K.A.CARE’s) and implemented in our study.
a) Photovoltaic Power System Generation
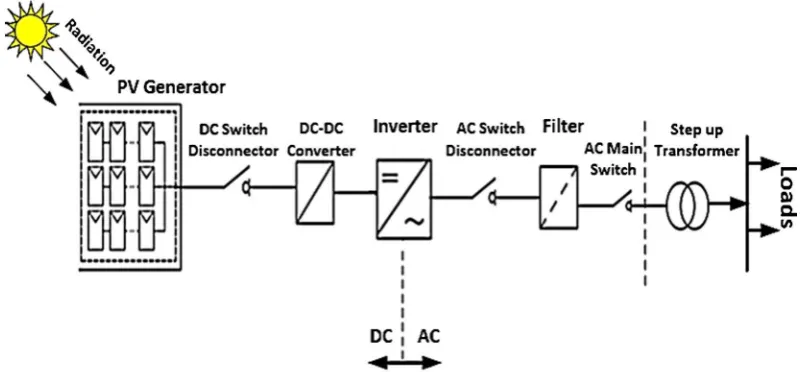
[image:7.595.139.540.520.706.2]The Solar photovoltaic (PV) is widely used as renewable energy source. The solar of PV has a high reliability in modules (>20 years), and high public accep-tance. PV is the technology that generates direct current (DC) electrical power measured in Watts (W) or kilo Watts (kW) from semiconductors when they are illuminated by photons. As long as light is shining on the solar cell, it produces both a current and a voltage to generate electric power which is known as Pho-toelectric Effect [9]. A general representation of a grid-connected solar PV sys-tem is shown in Figure 7. The most essential components in a grid-connected solar PV system are solar PV generator which consists of a large number of solar arrays, DC-DC converter, inverters, filter and step up transformers. A solar cell module produces only a small amount of current and voltage, and in order to produce a large amount of electric power, the solar cell modules are connected into arrays. The output voltage from a PV array changes with solar radiation and ambient temperature. Moreover, to connect the PV system to the transmission
DOI: 10.4236/wjet.2019.73032 436 World Journal of Engineering and Technology grid, the output DC voltage from PV system should be first regulated by a DC-DC converter. Then DC-AC inverter converts the DC power produced by the PV modules into AC power. A filter is used to eliminate harmonics. The power elec-tronic components have the tasks to guarantee safe and efficient operation, to track the maximum power point (MPP) of the PV system, and to maintain power quality of the PV system output. The transformer is an essential when the gener-ated electricity is to be injected into the utility grid.
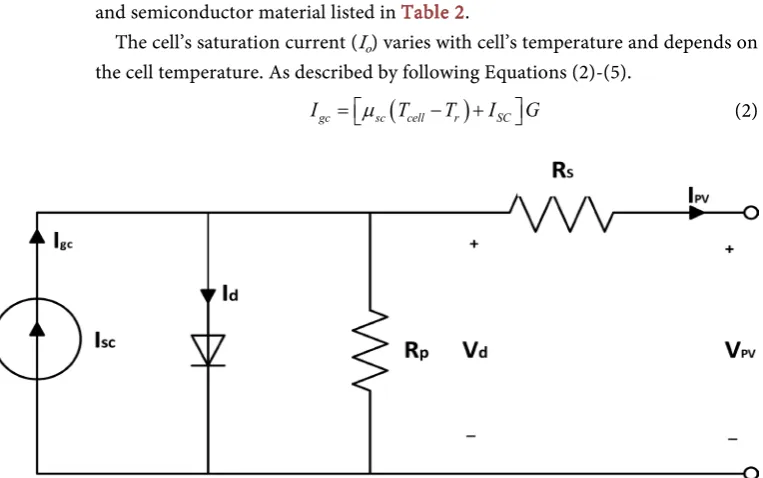
b) The PV Module
The ideal model of a solar cell consists of a photocurrent source and diode with an internal resistance connected to a parallel resistor. The current representing the photo generated current (Igc) in parallel with a diode which is directly
propor-tional to the light falling (solar irradiation) on the cell. A PV cell is physically modelled using the equivalent circuit model as represented in Figure 8.
Many researchers have been examined the general mathematical model de-scription of a solar cell current-voltage output characteristic over the past three decades [10]. According to well know Kirchhoff’s current law, the current flow-ing in the circuit can be modelled by the followflow-ing Equation (1) [11].
e 1
D cell
qV
nKT S
PV sc o sc D
P
V IR
I I I I I
R + = − = − − − (1)
where: IPV is the PV output current. Isc is the cell’s short circuit current at 25˚C
and 1 KW/m2. q is the electron charge equal to 1.602 × 10⁻¹⁹ C. k is the Boltzmann
constant (1.381 × 10⁻²³ J/K). V
D is the voltage across the diode terminals. V is the
output voltage. RS and RP are the series and parallel resistances. n is the ideality
factor, also known as the quality factor or sometimes the emission coefficient and usually takes values in the range 1 to 2, which depends on the construction and semiconductor material listed in Table 2.
The cell’s saturation current (Io) varies with cell’s temperature and depends on
the cell temperature. As described by following Equations (2)-(5).
(
)
gc sc cell r SC
[image:8.595.159.541.467.706.2]I =
µ
T −T +I G (2)DOI: 10.4236/wjet.2019.73032 437 World Journal of Engineering and Technology
Table 2. Ideality factor n dependence on PV technology [12].
Technology Type Ideal Factor (n)
Si-Mono 1.2
Si-Poly 1.3
CdTe 1.5
CIS 1.5
e cellD 1
qV nKT
D o
I =I −
(3)
1 1 3 e d r c ev
KF T T
cell o o r T I I T α − =
(4)
e oc
SC o ev KFT I I α
α
=
(5)
where: ID is the diode current. Tcell is the cell’s absolute temperature. Tr is the
cell’s reference temperature. Ioα is the cell’s reverse saturation current at solar
radiation and reference temperature. G is the solar radiation in kW/m2.
A solar cell alone can produce only output power from 1 to 2 Watt [13]. Fur-thermore, to increase the output power, the cell connected in series-parallel con-figuration on a module then array. A PV array is a group of several PV module and these arrays can be of sizes ranging from a few hundred watts to hundreds of kilowatts. The interconnection of PV modules in series and parallel or various other connections forms a PV array. The PV array composed of NS series and NP
parallel connected modules. And in order to calculate the generated photovoltaic current and the output power of a PV module consisted of (Ns × Np) cells as
fol-lowing Equation (6).
e 1
d s s p s c
v IR
e s p d
R R
N KFT s
PV p gc p o
p N V
N
I N I N I
R + = − − − (6)
c) Non-Linear Characteristics of PV’s
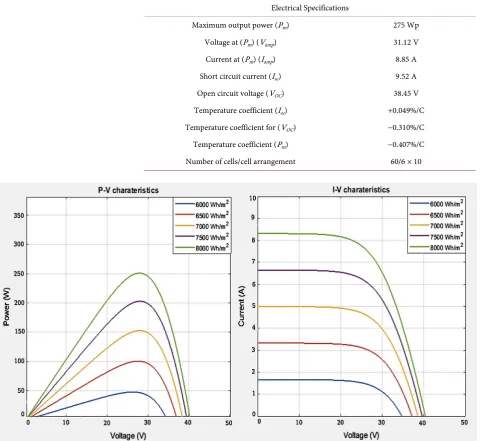
DOI: 10.4236/wjet.2019.73032 438 World Journal of Engineering and Technology An insolation-oriented model of PV module is built by using MATLAB to il-lustrate and verify the nonlinear I-V and P-V output characteristics of PV mod-ule. Both I-V and P-V output characteristics of PV module at various insolation and temperatures based on Riyadh region data are carried out. Figure 9 and
Figure 10 show the effect of changing the temperature and solar irradiance on PV’s output current, voltage, and power as well.
[image:10.595.62.543.267.708.2]It is clear from the previous figures that the output power of PV’s is directly proportional with the amount of solar irradiance falling on PV’s panel, and in-versely proportional with its temperature. We can see the effect of change in solar irradiation on PV characteristics from Figure 9. It is illustrated that as we increase the solar irradiation short circuit current increases, and current increases from
Table 3. Astronergy CHSM6610P polycrystalline specifications.
Electrical Specifications
Maximum output power (Pm) 275 Wp
Voltage at (Pm) (Vamp) 31.12 V
Current at (Pm) (Iamp) 8.85 A
Short circuit current (Isc) 9.52 A
Open circuit voltage (VOC) 38.45 V
Temperature coefficient (Isc) +0.049%/C
Temperature coefficient for (VOC) −0.310%/C
Temperature coefficient (Pm) −0.407%/C
Number of cells/cell arrangement 60/6 × 10
DOI: 10.4236/wjet.2019.73032 439 World Journal of Engineering and Technology
Figure 10. The temperature changing effect on I-V and P-V output characteristics.
1.8 A to 8.3 A approximately. The effect of variation of solar irradiation on P-V characteristics result that as solar irradiation increases, power generated increases also. Increase in power is mainly due to increment in current. Decreasing the irra-diance will reduce the overall performance of the PV module. On other hand, we observe from Figure 10 that, with an increase in the temperature the maximum power output of P-V curves are decreases whilst the short circuit current decrease also. As the temperature increases, the efficiency of the panel decreases. We can see the variation of temperature on I-V curves mostly effects voltage, as we increase the temperature, voltage decreases but current remains almost unaltered.
d) The PV Output Power Model
The PV output power system was proposed to assess the reliability of distribu-tion system containing renewable energy resources (solar energy generadistribu-tion plants with different capacity). The PV system output power can be calculated by the following Equation (7) [14]:
( )
( )
( )
( )
( )
2
0 C
C
S I t I t K
P out K
S I t I t K
η
η
∗ ∗ < ≤
=
∗ ∗ >
(7)
where (ηC) is the efficiency of the PV system, K is a threshold and I t
( )
is the hourly solar insolation. The value of (ηC) is not constant when I t( )
is less than or equal, it is proportional with the solar insolation. That means when the solar insolation increase the PV system efficiency will increase and vice versa. The following equation can express the hourly solar insolation (8) [12].( )
max 361 2 23 3 6 180 0 6 and 18 24 0
I t t t
I t
t t
− + − ≤ ≤
=
≤ < ≤ ≤ ≥
DOI: 10.4236/wjet.2019.73032 440 World Journal of Engineering and Technology
4. Load Model
The load modelling is an important part of power system modelling process and has a significant effect on power system simulation results. The load model is created by using daily or monthly or yearly peak loads with respect to time in seconds or minutes or hours. The energy consumption can be displayed with load curve as shows the amount of demand used per period of time but Load Duration Curve (LDC) shows the amount of maximum ranking until the mini-mum demand is used. LDC is the basic tool used in the analysis of electric power systems such as estimating the operating cost of resource plans, and as tool to integrate the demand side management in the planning of electricity generation and enables to evaluate the operation of the power system more accurately than the traditional approach. Figure 11 shows LDC displaying various load-related variables. This load duration curve has a shape of a monotonously decreasing function and in this load duration curve, we can know that the slope varies ac-cording to time.
Over the last several years, the peak of electricity demand in Kingdom of Sau-di Arabia (KSA) is continuously increasing. The SauSau-di Electricity Company (SEC) operates an interconnected transmission system for all main areas in KSA. SEC system is divided into four operating areas, named as Central, Eastern, Western and Southern Operating areas. Since Riyadh city is the major load center in Central operating area it faces unique issues in every day operation of the system
[15]. Figure 12 and Figure 13 show the measured average values of daily and monthly electrical energy consumption in Riyadh city in the year 2018. It can be observed that the summer months from June to October have consistently high-er loads than the non-summhigh-er months.
[image:12.595.237.511.552.706.2]The behavior of power system loads is a frequent pattern during normal con-ditions, and a time varying load model can be developed by using historical data. The model used in this study is the hourly load curve which can be converted to load duration curve by arranging the data in descending order. The following equation used to find the predicated the load for any load point at any desired time (9).
DOI: 10.4236/wjet.2019.73032 441 World Journal of Engineering and Technology
Figure 12. Variation of daily average load demand of Riyadh city in the year 2018.
Figure 13. Variation of monthly average load demand of Riyadh city in the year 2018.
( )
( )
i h m Li
P W h W m P= × ×
(9)
where, W hh
( )
= hourly weight factor, W mm( )
= monthly weight factor, and LiP = peak load for load point.
5. System Reliability Indices
The basic function of an electric power system is to supply customers with rea-sonably economical and reliable electricity. The reliability level of one distribu-tion system is often evaluated from two aspects which are consumer level and system level. These two frequently used reliability indices for users of load points are as follow. The first one is average failure rate (λi) which is number of
out-ages/year and defined as the probability of failure occurrence during a specific period for load point. The second one is average annual interruption time (Ui)
which is sum of the outages time/year and defined as the average interruption time of load point in a specific period. These two indices can be expressed as following Equations (10)-(11) [16].
1 n
i i
λ λ
=
=
∑
(10)n i i i
[image:13.595.217.528.245.394.2]DOI: 10.4236/wjet.2019.73032 442 World Journal of Engineering and Technology where λi is the failure rate of the series components from the source point to
load point, n is the total number of components which affect load point, ri is
av-erage restoration time of network component to restore load point i due to the failure of component j.
The commonly reliability induces of the system defined as functions of aver-age failure rate over the total number of customers, and averaver-age interruption time [16]. The reliability system indices measure by some factors which can be aggregated to provide an appreciation of the system performance using a series of system indices such as System Average Interruption Frequency Index (SAIFI) which refers to the ratio of the total number of customer interruptions to total number of customers served and is the number of permanent interruption that customers would experience in one year. System Average Interruption Duration Index (SAIDI) which refers to the ratio of the sum of customer interruption du-rations to total number of customers and usually measures the duration of per-manent interruption that customers would experience in one year. Customer Average Interruption Duration Index (CAIDI) which refers to the ratio of the sum of customer interruption durations to total number of customer interrup-tions and is the average time needed to restore service to the average customer per sustained interruption. Expected Energy Not Supply (ϵENS) measures the total of energy interruption that customers would experience in one year and its dimension (MWh/year). These indices can be calculated by following Equations (12)-(14) [16] [17].
1 1 SAIFI n i i i n i i N N λ = = =
∑
∑
(12)1 1 SAIDI n i i i n i i U N N = = =
∑
∑
(13)1 1 SAIDI CAIDI SAIFI n i i i n i i i U N N λ = = =
∑
=∑
(14)1
ENS n i i i
E N
= =
∑
(15)
where Ni is number of customers at load points i, Ui is the annual outage time,
Ni is the number of customers at load point i, Ei is the average of average
inter-ruption energy per load point.
6. Monte Carlo Simulation
compo-DOI: 10.4236/wjet.2019.73032 443 World Journal of Engineering and Technology nents which in real time will be all different in varying degrees, including the number of failures, times to failure, restoration times. The Simulation tech-niques used to estimate the reliability indices by simulating the actual process and random behavior of the system. The time sequential simulation is one of the MCS types used when the system behavior depends on past events to examine and predict behavior patterns in order to obtain the probability distributions of the various reliability parameters. The system reliability indices can be obtained from the artificial history that needed in time sequential simulation, and this can be ob-tained by generating the up (where expressed the element is in the operating state) and down (where expressed the element is inoperable due to failure) times ran-domly for the system elements. These artificial histories depend on the reliability parameters the elements and the system operating/restoration modes.
Time to failure (TTF) or failure time (FT) is the duration that it would take the component to fail or the time during the element remains in the up state. This time is predicted randomly and calculated by the following Equation (16)
[16] [17].
( )
1
TTF= − ×λ ln n (16)
where λ is failure rate of system component and n is a random number (range from 0 to1).
Time to repair (TTR) or time to replace (TTR) is the time required to repair a failed component or the time during the element remains in the down state and it is used to indicate the cycle time of failure. Also, this time is predicted ran-domly by the following (17) [16] [17].
( )
1
TTR ln n
µ
= − × (17)
where μ is repair rate of system component.
The process of transiting from the up state to the down state is the failure process and can be caused by the failure of an element or by the removal of ele-ments for maintenance time. The parameters TTF and TTR are random variables and it is obvious from Equations (14) and (15) that TTF and TTR follow expo-nential distributions. So, to predict the artificial history of system components, TTF and TTR can be generated to cover simulation times (e.g. one year) in chro-nological order. MCS have to be performed for a large number of scenarios, and the simulation time can be expanded to be a very long time (e.g. a thousand years or more) depending on the case study and also the desired accuracy. After that, the average can be calculated. Figure 14 shows an example of simulated com-ponent operating/restoration history of a comcom-ponent.
DOI: 10.4236/wjet.2019.73032 444 World Journal of Engineering and Technology
Figure 14. Element operating/repair history [16].
evaluation algorithms which are MV network that does not contain DGs of PV and a MV network that containing DGs of PV.
As the main purpose of this study is to evaluate the reliability of MV network system with renewable energy resource which is the PV distributed generation with vary output power capacity to see their impact on the reliability, the fol-lowing assumptions were created that shouldn't have a major impact on the re-sults:
1) The permanent faults only are included in the study and all protection de-vices operate with success to isolate the faults.
2) The primary main feeder failures only are included in the analysis and every section protected by a breaker to isolate the faults.
3) It takes one hour to transfer the loads from the failed feeder to a neighbor-ing feeder through a normal operatneighbor-ing point.
4) Each circuit breaker is controlled by a bi-directional protection device. The simulation procedures of reliability evaluation of distribution networks do not contain and contain renewable energy of PV distributed generators are shown in Figure 15 and Figure 16. It shows the algorithms of distribution sys-tem reliability evaluation indices without and with PVs distributed generators respectively.
7. Case Study Application
DOI: 10.4236/wjet.2019.73032 445 World Journal of Engineering and Technology
DOI: 10.4236/wjet.2019.73032 446 World Journal of Engineering and Technology
DOI: 10.4236/wjet.2019.73032 447 World Journal of Engineering and Technology point to be moved and customers to be supplied from alternative supply points.
Figure 17 and Figure 18 show the modified single line diagram for the distribu-tion networks system of RBTS bus 2 and substadistribu-tion 7029 with DGs of PV.
The data of RBTS Bus 2 distribution network may be found in reference [18]. The modified RBTS and substation 7029 have one type of distributed generator, is photovoltaic solar energy with vary of output power capacity. The maximum output power of PV1, PV2 and PV3 is 200 KW, 400 KW and 800 KW. The fail-ure rate of PV1, PV2 and PV3 generators are taken as 0.11, 0.15 and 0.21 f/yr respectively. The average repair time for DGs of PV is taken as 32, 31 and 30 hr respectively. The all distributed generators of RBTS and substation 7029 contain all feeders (1, 2, 3 and 4) and are supplied by PV1, PV2 and PV3, except feeder 2 of RBTS and substation 7029 due to this feeder has less numbers of load points. The distributed generators of PV can operate in islanded mode, if there is enough
DOI: 10.4236/wjet.2019.73032 448 World Journal of Engineering and Technology
Figure 18. Distribution network for MV substation 7029 with PV of DG.
DOI: 10.4236/wjet.2019.73032 449 World Journal of Engineering and Technology
Figure 19. Annual average failure rate for all load points of RBTS and S/S7029.
Figure 20. Average interruption time for all load points of RBTS and S/S7029.
[image:21.595.214.533.331.562.2]DOI: 10.4236/wjet.2019.73032 450 World Journal of Engineering and Technology
Figure 21. Average interruption energy for all load points of RBTS and S/S7029. the other hand, the load points with distributed generators of PV located at the end of the main feeder have low failure rates. This reduction in failure rate is due to the excess generation capacity provided by the DGs during the outage of the main sources. From Figure 19, it is obvious that there is no reduction and im-provement in the average failure rates for load points 1, 2, 8, 10, 11 and 16 in the RBTS and load points 1, 9, 13, 25 and 26 in the substation 7029 since a probabil-istic simulation was used in this study.
The average interruption time is a function of failure rates and average resto-ration time of RBTS and substation 7029 network components. Therefore, the all previous observations are applicable to Figure 20. As a result, it is observed from
Figure 20 that RBTS and substation 7029 with DGs of PV can reduce the aver-age interruption time for most of load points slightly. Comparing the result be-tween RBTS Bus 2 and substation 7029 it demonstrated that the average inter-ruption time of substation 7029 is higher than RBTS Bus 2 due to has a greater numbers of load points and long lines. The calculated average interruption time for all load points of substation 7029 without and with DGs of PV is 32.305 per hour and 30.556 per hour. Whilst, the RBTS Bus 2 has total of average interrup-tion time without and with DGs of PV are 17.847 per hour and 17.309 per hour.
The average interruption energy of all load points is described as a function of the average interruption time and the load of each load point. Therefore, all of the previous observations and clarifications are applicable to Figure 21. It is ob-vious that most of the load points have a little improvement in interruption energy after adding DGs of PV.
Table 4 shows the results of the overall reliability indices of the entire system for RBTS Bus 2 and substation 7029 for the two cases (without and with DGs of PV). All cases are using the method proposed in this study.
DOI: 10.4236/wjet.2019.73032 451 World Journal of Engineering and Technology DGs of PV in distribution networks can improve the reliability of distribution networks by offering a backup source when the main source is not available. In addition, the overall reliability indices have improved after adding DGs of PV which is shown in Table 4. Based on the previous Figures 19-21 we observe that the reliability improvement associated in the presence of network with distri-buted generators not only depend on the size of DGs but the location of DGs is play an important role also. The DGs of PV integration have a positive impact on whole system reliability irrespective of the penetration level or the existing conditions.
[image:23.595.59.544.314.705.2]The summary of these system reliability indices (SAIFI, SAIDI, CAIDI and ϵENS) are shown in Figure 22. SAIFI has least impact and lowest interruptions per customer on RBTS Bus 2 distribution network. The reliability indices of dis-tribution networks (SAIDI) affected very slightly after adding DGs of PV. RBTS Bus 2 has the highest impact on system reliability indices (CAIDI) than S.S 7029.
Table 4. Reliability indices of RBTS Bus 2 and substation 7029.
Index RBTS W/O DGs RBTS with DGs S.S.7029 W/O DGs S.S.7029 with DGs
SAIFI (Inter./customer yr) 0.2098 0.1918 0.3514 0.2827
SAIDI (hr/customer yr) 0.8745 0.8462 0.9017 0.8814
CAIDI (hr/customer inter) 4.1682 4.4118 2.5660 3.1177
ϵENS (MWh/yr) 8.3848 8.0246 8.9307 8.5821
DOI: 10.4236/wjet.2019.73032 452 World Journal of Engineering and Technology As the faulted feeder and all load points suffer power outage when a fault occurs either at any location between feeders and main bus or at any feeder circuit breaker or on the main bus. Thus, it has highest impact on ϵENS. We observed that, there is a slight improvement after adding DGs of PV for two distribution networks. RBTS Bus 2 has better system reliability (ϵENS) than S.S 7029. These reliability indices (SAIFI, SAIDI, CAIDI and ϵENS) can be used to determine the system performance of the composite distribution system. The system reliability indices can also be used to make assessment for the severity of system failures on future reliability analysis.
8. Conclusions
The implementation of renewable resources in distribution networks is promis-ing in many environment and economic aspects, such as reducpromis-ing green gas emis-sions, reducing the power losses on distribution networks and improving reliabili-ty of power services. The distributed generators of PV could pave the way to inte-grate solar energy in distribution systems, which can deal with different modes of operation such as interconnected mode and islanded mode. The excess of PV gen-eration does not lead to any negative impact on the system reliability, but they surely have significant economic impacts. Due to high correlation of PV output power during the peak hours of the load, the PV integration results in reduced net loads which lead to higher effective load carrying capability.
DOI: 10.4236/wjet.2019.73032 453 World Journal of Engineering and Technology RBTS containing DGs of PV SAIFI, SAIDI, CAIDI and EENS were improved by 8.57% 3.23% 5.84% 4.29% respectively. In the Substation 7029 containing DGs of PV SAIFI, SAIDI, CAIDI and EENS were improved by 19.5% 2.25% 21.5% 3.9%respectively.
Conflicts of Interest
The authors declare no conflicts of interest regarding the publication of this pa-per.
References
[1] Roy, B. and Jonnavithula, S. (1996) A Test System for Teaching Overall Power Sys-tem Reliability Assessment. IEEE Transactions on Power Systems, 11, 1670-1676. https://doi.org/10.1109/59.544626
[2] Viral, R. and Khatod, D.K. (2012) Optimal Planning of Distributed Generation Sys-tems in Distribution System: A Review. Renewable and Sustainable Energy Reviews, 16, 5146-5165.https://doi.org/10.1016/j.rser.2012.05.020
[3] Energy Trend PV Price Qut. http://pv.energytrend.com/pricequotes
[4] International Energy Agency (2016) Snapshot of Global Photovoltaic Markets. 1-16. [5] Haegel, N.M., Margolis, R., Buonassisi, T., Feldman, D., Froitzheim, A., Garabedian, R., Green, M., Glunz, S., Henning, H.-M., Holder, B., Kaizuka, I., Kroposki, B., Matsubara, K., Niki, S., Sakurai, K., Schindler, R.A., Tumas, W., Weber, E.R., Wil-son, G., Woodhouse, M. and Kurtz, S. (2017) Terawatt-Scale photovoltaics: Trajec-tories and Challenges. Science, 356, 141-143.
https://doi.org/10.1126/science.aal1288
[6] International Renewable Energy Agency (2016) Renewable Energy Market Analysis: The GCC Region.IRENA, Abu Dhabi.
[7] Vision 2030 (2016) Kingdom of Saudi Arabia, April 2016.
[8] U.S. Energy Information Administration (2017) Country Analysis Brief: Saudi Ara-bia.
http://www.eia.gov/beta/international/analysis_includes/countries_long/Saudi_Ara bia/saudi_arabia.pdf
[9] Wu, T.F., Shen, C.L., Nein, H.S. and Li, G.F. (2005) A Single-Phase 3 W Inverter with Grid Connection and Active Power Filtering Based on Nonlinear Program-ming and Fast-Zero-Phase Detection Algorithms. IEEE Transactions on Power Electronics, 20, 218-226.https://doi.org/10.1109/TPEL.2004.839786
[10] Firdaus, M. and Daniyal, H. (2013) Modeling and Simulation of Photovoltaic Mod-ule with MPPT. 2nd Annual International Conference on Sustainable Energy and Environmental Sciences, Singapore, 25-26 February 2013.
[11] Natsheh, E.M., Blackhurs, E.J. and Albarbar, A. (2011) PV System Monitoring and Performance of a Grid Connected PV Power Station Located in Manchester-UK. IET Conference on Renewable Power Generation, Edinburgh, 6-8 September 2011, 1-6.
[12] Liang, H., Su, J. and Liu, S. (2010) Reliability Evaluation of Distribution System Containing Microgrid. China International Conference Electricity Distribution (CICED)2010 Proceedings, Nanjing, 3-6 September 2010, 1-7.
DOI: 10.4236/wjet.2019.73032 454 World Journal of Engineering and Technology [14] Cha, S., Jeon, D., Lee, I. and Kim, J. (2004) Reliability Evaluation of Distribution
System Connected Photovoltaic Generation Considering Weather Effects. 2004 In-ternational Conference on Probabilistic Methods Applied to Power Systems, Ames, IA, 12-16 September 2004, 451-456.
[15] SEC (2015) Electrical Data 2000-2013. Saudi Electricity Company. https://www.se.com.sa/en-us/Pages/ElectricalData.aspx
[16] Faulin, J., Juan, A.A.,·Martorell, S. and Ramírez-Márquez, J.-E. (2010) Simulation Methods for Reliability and Availability of Complex Systems. Springer, Dordrecht, Heidelberg.https://doi.org/10.1007/978-1-84882-213-9
[17] Billinton, R. and Allan, R.N. (1996) Reliability Evaluation of Power Systems. 2nd Edition, Plenum Press, New York.https://doi.org/10.1007/978-1-4899-1860-4 [18] Allan, R.N., Billinton, R., Sjarief, I., Goel, L. and So, K.S. (1991) A Reliability Test
![Figure 4. Best countries for using solar power source [3].](https://thumb-us.123doks.com/thumbv2/123dok_us/8996206.396433/5.595.211.538.514.705/figure-best-countries-using-solar-power-source.webp)

![Table 2. Ideality factor n dependence on PV technology [12].](https://thumb-us.123doks.com/thumbv2/123dok_us/8996206.396433/9.595.234.539.83.304/table-ideality-factor-n-dependence-pv-technology.webp)