Proceedings of the 2019 Conference on Empirical Methods in Natural Language Processing 3471
Evaluating Topic Quality with Posterior Variability
Linzi Xing† and Michael J. Paul‡ and Giuseppe Carenini†
†University of British Columbia, Vancouver, Canada
‡University of Colorado, Boulder, Colorado, USA
{lzxing, carenini}@cs.ubc.ca, [email protected]
Abstract
Probabilistic topic models such as latent Dirichlet allocation (LDA) are popularly used with Bayesian inference methods such as Gibbs sampling to learn posterior distributions over topic model parameters. We derive a novel measure of LDA topic quality using the variabilityof the posterior distributions. Com-pared to several existing baselines for auto-matic topic evaluation, the proposed metric achieves state-of-the-art correlations with hu-man judgments of topic quality in experiments on three corpora.1 We additionally demon-strate that topic quality estimation can be fur-ther improved using a supervised estimator that combines multiple metrics.
1 Introduction
Latent Dirichlet Allocation (LDA) (Blei et al.,
2003) topic modeling has been widely used for NLP tasks which require the extraction of latent themes, such as scientific article topic analysis (Hall et al.,2008), news media tracking (Roberts et al.,2013), online campaign detection (Paul and Dredze,2014) and medical issue analysis (Huang et al.,2015,2017). To reliably utilize topic models trained for these tasks, we need to evaluate them carefully and ensure that they have as high qual-ity as possible. When topic models are used in an extrinsic task, like text categorization, they can be assessed by measuring how effectively they con-tribute to that task (Chen et al.,2016;Huang et al.,
2015). However, when they are generated for hu-man consumption, their evaluation is more chal-lenging. In such cases, interpretability is critical, and Chang et al. (2009); Aletras and Stevenson
(2013) have shown that the standard way to eval-uate the output of a probabilistic model, by mea-suring perplexity on held-out data (Wallach et al.,
1Our code and data are availablehere.
2009), does not imply that the inferred topics are human-interpretable.
A topic inferred by LDA is typically represented by the set of words with the highest probability given the topic. With this characteristic, we can evaluate the topic quality by determining how co-herent the set of topic words is. While a variety of techniques (Section 2) have been geared towards measuring the topic quality in this way, in this pa-per, we push such research one step further by making the following two contributions: (1) We propose a novel topic quality metric by using the variability of LDA posterior distributions. This metric conforms well with human judgments and achieves the state-of-the-art performance. (2) We also create a topic quality estimator by combining two complementary classes of metrics: the metrics that use information from posterior distributions (including our new metric), along with the set of metrics that rely on topic word co-occurrence. Our novel estimator further improves the topic qual-ity assessment on two out of the three corpora we have.
2 Automatic Topic Quality Evaluation
There are two common ways to evaluate the qual-ity of LDA topic models: Co-occurrence Based MethodsandPosterior Based Methods.
Figure 1: Two example topics and their distributions ofµ,σandcvfrom the NYT corpus. Two topics are:Topic1 (in blue):{financial, banks, bank, money, debt, fund, loans, investors, funds, hedge}.Topic2 (in orange):{world, one, like, good, even, know, think, get, many, got}. Their human rating scores are 3.4 and 1.0 respectively.
by the normalized pointwise mutual information (NPMI) (Bouma,2009), which has an even higher correlation with human judgments. Another line of work exploits the co-occurrence statistics in-directly. Aletras and Stevenson (2013) devised a new method by mapping the topic words into a se-mantic space and then computing the pairwise dis-tributional similarity (DS) of words in that space. However, the semantic space is still built on PMI or NPMI.Roder et al. (2015) studied a unifying framework to explore a set of co-occurrence based topic quality measures and their parameters, iden-tifying two complex combinations, (named CV andCPin that paper2), as the best performers on their test corpora.
Posterior Based Method Recently, Xing and Paul (2018) analyzed how the posterior of LDA parameters vary during Gibbs sampling inference (Geman and Geman,1984;Griffiths and Steyvers,
2004) and proposed a new topic quality measure-ment namedTopic Stability. The Gibbs sampling for LDA generates estimates for two distributions: for topics given a document (θ), and for words given a topic (φ). Topic stability considersφand is defined as:
stability(Φk) = 1
|Φk|
X
φk∈Φk
sim(φk,φ¯k) (1)
The stability of topick is computed as the mean cosine similarity between the mean (φ¯k) of all
the sampled topick’s distribution estimates (Φk)
and topick’s estimates from each Gibbs sampler (φk). Fared against the co-occurrence based
meth-ods, topic stability is parameter-free and needs no external corpora to infer the word co-occurrence. However, due to the high frequency of common
2The framework proposed inRoder et al.(2015) has four
stages. Every stage has multiple settings. CV and CP are different at the Confirmation Measure stage, which measures how strongly a set of topic words connect with each other.
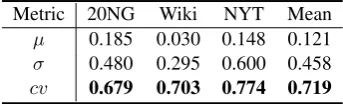
Metric 20NG Wiki NYT Mean µ 0.185 0.030 0.148 0.121 σ 0.480 0.295 0.600 0.458 cv 0.679 0.703 0.774 0.719
Table 1: Pearson’srof each potential metric of poste-rior variability with human judgments
words across the corpus, low quality topics may also have high stability, and this undermines the performance of this method.
3 Variability Driven from Topic Estimates
In this paper, we also use Gibbs sampling to in-fer the posterior distribution over LDA parame-ters. Yet, instead ofφ, our new topic evaluation method analyzes estimates of θ, the topic distri-bution in documents. Let Θbe a set of different estimates ofθ, which in our experiments will be a set of estimates from different iterations of Gibbs sampling. Traditionally, the final parameter esti-mates are taken as the mean of all the sampled es-timates, θˆdk = |Θ1|
P
θ∈Θθdk. In this paper, we
use the shorthandµdk to denoteθˆdk for a
particu-lar documentdand topick.
In the rest of this section, we first discuss what types of information can be derived from the topic posterior estimates from different Gibbs samplers. Then, we examine how the corpus-wide variabil-ity can be effectively captured in a new metric for topic quality evaluation.
Two types of information can be derived from the topic posterior estimates: (1) the mean of es-timates,µdk, as discussed above, and (2) the
vari-ation of estimates. For varivari-ation of estimates, we considered using the standard deviationσdk.
How-ever, this measure is too sensitive to the order-of-magnitude differences ofµdk, that typically occur
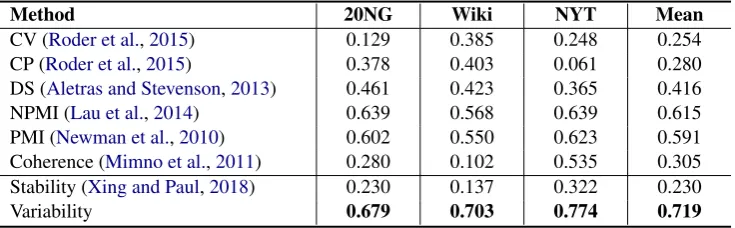
[image:2.595.330.502.207.259.2]Method 20NG Wiki NYT Mean
CV (Roder et al.,2015) 0.129 0.385 0.248 0.254 CP (Roder et al.,2015) 0.378 0.403 0.061 0.280 DS (Aletras and Stevenson,2013) 0.461 0.423 0.365 0.416
NPMI (Lau et al.,2014) 0.639 0.568 0.639 0.615
PMI (Newman et al.,2010) 0.602 0.550 0.623 0.591
Coherence (Mimno et al.,2011) 0.280 0.102 0.535 0.305 Stability (Xing and Paul,2018) 0.230 0.137 0.322 0.230
[image:3.595.116.484.63.177.2]Variability 0.679 0.703 0.774 0.719
Table 2: Pearson’srcorrelation with human judgments for metrics.
more stable dispersion of estimates from different iterations of Gibbs sampling, we propose to com-pute the variation of topic k’s estimates in docu-mentdas its coefficient of variance (cv)(Everitt,
2002), which is defined as:cvdk =σdk/µdk
Notice that bothµdkandcvdkcan arguably help
distinguish high and low quality topics because:
• High quality topics will have highµdkfor
re-lated documents and low µdk for unrelated
documents. But low quality topics will have relatively closeµdkthroughout the corpus.
• High quality topics will have lowcvdkfor
re-lated documents and highcvdk for unrelated
ones. But low quality topics will have rela-tively highcvdkthroughout the corpus.
Now, focusing on the design of the new met-ric, we consider using the corpus-wide variabil-ity of topics’ estimates as our new metric. Fig-ure 1shows a comparison of the distributions of mean of estimates (µ) and variation of estimates (σ,cv) for two topics across the NYT corpus (Sec-tion5.1). We can see thecvdistributions of good (Topic1) and bad (Topic2) topics are the most dif-ferent. Thecvdistribution of Topic1 covers a large span and has a heavy head and tail, whilecv val-ues of Topic2 are mostly clustered in a smaller range. In contrast, the difference between Topic1 and Topic2’s distributions ofµandσ throughout the corpus appears to be less pronounced. Tak-ing the corpus-wide variability difference between good and bad topics observed in Figure 1, we choose cvto measure the corpus-wide variability of topick’s estimates as our new metric. Formally, it can be defined as:
variability(k) =std(cv1k, cv2k,· · ·, cvDk) (2)
where D is the size of the corpus. High quality topics will have higher variability and low quality
topics will have lower variability. Table1shows a comparison in performance (correlation with hu-man judgment) of our variability defined by cv with the variability defined by µ or σ on three commonly used datasets (Section5.1). The vari-ability defined bycvis a clear winner.
4 Topic Quality Estimator
Our new method, like all other methods driven from the posterior variability, does not use any information from the topic words, which is in contrast the main driver for co-occurrence meth-ods. Based on this observation, posterior vari-ability and co-occurrence methods should be com-plementary to each other. To test this hypothe-sis, we investigate if a more reliable estimator of topic quality can be obtained by combining these two classes of methods in a supervised approach. In particular, we train a support vector regression (SVR) estimator (Joachims, 2006) with the esti-mations of these methods as features, including all the topic quality measures introduced in Section2
along with our proposedvariabilitymethod.
5 Experiments
5.1 Datasets
We evaluate our topic quality estimator on three datasets: 20NG, Wiki and NYT. 20NG is the 20 Newsgroup dataset (Joachims, 1997) which consists of 9,347 paragraphs categorized into 20 classes3. Wiki consists of 10,773 Wikipedia ar-ticles written in simple English4. NYT consists of 8,764 New York Times articles collected from April to July, 20165.
3
http://archive.ics.uci.edu/ml/ datasets/twenty+newsgroups
4
http://simple.wikipedia.org/
5https://www.kaggle.com/nzalake52/
Test Train Mean Variability
20NG Wiki NYT Wiki+NYT 0.801 0.679
0.790 0.804 0.810
Wiki 20NG NYT 20NG+NYT 0.716 0.703
0.707 0.731 0.710
NYT 20NG Wiki 20NG+Wiki 0.770 0.774
[image:4.595.305.521.61.163.2]0.762 0.775 0.773
Table 3: Pearson’srcorrelation with human judgments for the topic quality estimator.
We removed stop words, low-frequency words (appearing less than 3 times), proper nouns and digits from all the datasets, followingChang et al.
(2009), so the topic modeling can reveal more gen-eral concepts across the corpus.
Following the common setting shared by most of the papers we compared with, for each dataset we built an LDA model which consists of 100 top-ics represented by the 10 most probable words. The gold-standard annotation for the quality of each topic is the mean of 4-scale human rat-ing scores from five annotators, which were col-lected through a crowdsourcing platform, Figure Eight6. In order to obtain more robust estimates given the variability in human judgments, we re-moved ratings from annotators who failed in the test trail and recollected those with additional re-liable annotators. To verify the validity of the collected annotations, we computed the Weighted Krippendorff’sα(Krippendorff,2007) as the mea-sure of Inter-Annotator Agreement (IAA) for three datasets. The average human rating score/IAA for 20NG,WikiandNYTare 2.91/0.71, 3.23/0.82 and 3.06/0.69, respectively.
5.2 Experimental Design
Topic Modeling Following the settings inXing and Paul(2018), we ran the LDA Gibbs samplers for 2,000 iterations (Griffiths and Steyvers,2004) for each datasets, with 1,000 burn-in iterations, collecting samples every 10 iterations for the fi-nal 1,000 iterations. The set of estimatesΘthus contains 100 samples.
Estimator Training was performed following the cross-domain training strategy (Bhatia et al.,
2018). With the ground truth (human judgments), we train the estimator on all topics over one dataset, and test it on another (one-to-one). To enlarge the training set, we also train the esti-mator on two datasets merged together and test
[image:4.595.75.289.62.138.2]6https://www.figure-eight.com/
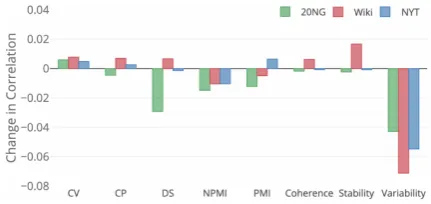
Figure 2: The ablation analysis.
it on the third one (two-to-one). Given the lim-ited amount of data and the need for interpretabil-ity, we experimented only with non-neural clas-sifiers, including linear regression, nearest neigh-bors regression, Bayesian regression, and Support Vector Regression (SVR) using sklearn ( Pe-dregosa et al., 2011); we report the results with SVR, which gave the best performance. We also experimented with different kernels of SVR and rbf kernel worked best.
Baselines include seven commonly adopted measures for topic quality assessment: CV, CP (Roder et al., 2015), DS (Aletras and Steven-son, 2013), PMI (Newman et al., 2010), NPMI (Mimno et al.,2011),Coherence(Newman et al.,
2010) andStability(Xing and Paul,2018). All of them are introduced in Section2.
5.3 Results
Following (Roder et al.,2015), we use Pearson’s r to evaluate the correlation between the human judgments and the topic quality scores predicted by all the automatic metrics. The higher is the Pearson’s r, the better the metric is at measur-ing topic quality. Table2 shows the Pearson’sr correlation with human judgments for all the met-rics. Our proposed variability-based metric sub-stantially outperforms all the baselines.
Table3 shows the Pearson’sr correlation with our proposed topic quality estimator trained and tested on different datasets. The average cor-relations of the estimator dominates our pro-posed variability-based metric on two out of three datasets, and on one of them by a wide margin.
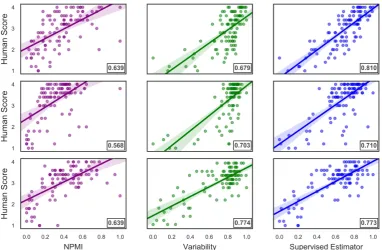
Additionally, to better investigate how well the metrics align with human judgments, in Figure3
Figure 3: Scatter plots illustrating the correlation between human rating scores and the three metrics: NPMI, VariabilityandSupervised Estimatoron three datasets:20NG(top row),Wiki(middle row) andNYT(bottom row). The numerical Pearson’srcorrelations are shown in the bottom-right corner.
high human scores tend to be above the pur-ple line), but it performs relatively well for low-quality topics. On the contrary, the top performer posterior based metric,variability, is more likely to overestimate topic quality by assigning high rat-ings to relatively bad topics (dots with low human scores tend to be below the green line), but it per-forms relatively well for high-quality topics. Thus, when we combine all the metrics in a supervised way, the topic quality estimation becomes more accurate, especially on 20NG corpus (i.e. the top row).
Ablation Analysis: Since some features in the topic quality estimator are closely related, their overlap/redundancy may even hurt the model’s performance. To better understand the contribu-tions of each feature in our proposed estimator, we conduct ablation analysis whose results are il-lustrated in Figure 2. We track the change of performance by removing one feature each time. The more significant drop in performance indi-cates that the removed feature more strongly con-tributes to the estimator’s accuracy. By training on two datasets and testing on the third dataset, we find that only Variability and NPMI consis-tently contributes to accurate predictions on all three datasets. This indicates that our new
Vari-ability metric and NPMI are the strongest ones from the two families of Posterior-based and Co-occurrence-based metrics, respectively.
6 Conclusion and Future Work
We propose a novel approach to estimate topic quality grounded on the variability of the variance of LDA posterior estimates. We observe that our new metric, driven by Gibbs sampling, is more ac-curate than previous methods when tested against human topic quality judgment. Additionally, we propose a supervised topic quality estimator that by combining multiple metrics delivers even bet-ter results. For future work, we intend to work with larger datasets to investigate neural solutions to combine features from different metrics, as well as to apply our findings to other variants of LDA models trained on low-resource languages, where high-quality external corpora are usually not avail-able (Hao et al.,2018).
Acknowledgments
[image:5.595.108.491.64.314.2]References
Nikolaos Aletras and Mark Stevenson. 2013. Evaluat-ing topic coherence usEvaluat-ing distributional semantics. InProceedings of the 10th International Conference on Computational Semantics (IWCS 2013) – Long Papers, pages 13–22.
Shraey Bhatia, Jey Han Lau, and Timothy Baldwin. 2018. Topic intrusion for automatic topic model evaluation. InProceedings of the 2018 Conference on Empirical Methods in Natural Language Pro-cessing, pages 844–849.
David M. Blei, Andrew Y. Ng, and Michael I. Jordan. 2003. Latent Dirichlet allocation. Journal of Ma-chine Learning Research, 3:993–1022.
Gerlof Bouma. 2009. Normalized ( pointwise ) mutual information in collocation extraction. In Proceed-ings of the Biennial GSCL Conference’09, pages 31– 40.
Jonathan Chang, Jordan Boyd-Graber, Chong Wang, Sean Gerrish, and David M. Blei. 2009. Reading tea leaves: How humans interpret topic models. In Proceedings of the Neural Information Processing Systems, pages 288–296.
Qiuxing Chen, Lixiu Yao, and Jie Yang. 2016. Short text classification based on lda topic model. In2016 International Conference on Audio, Language and Image Processing (ICALIP).
Brian Everitt. 2002. The Cambridge dictionary of statistics. Cambridge University Press.
Stuart Geman and Donald Geman. 1984. Stochas-tic relaxation, Gibbs distributions, and the bayesian restoration of images.IEEE Transactions on Pattern Analysis and Machine Intelligence, pages 503–512.
Thomas L. Griffiths and Mark Steyvers. 2004. Find-ing scientific topics. InProceedings of the National academy of Sciences, pages 5228–5235.
David Hall, Daniel Jurafsky, and Christopher D Man-ning. 2008. Studying the history of ideas using topic models. InProceedings of the Conference on Em-pirical Methods in Natural Language Processing, pages 363–371.
Shudong Hao, Jordan Boyd-Graber, and Michael J. Paul. 2018. Lessons from the Bible on modern top-ics: Low-resource multilingual topic model eval-uation. In Proceedings of the 2018 Conference of the North American Chapter of the Association for Computational Linguistics: Human Language Technologies, Volume 1 (Long Papers), pages 1090– 1100.
Xiaolei Huang, Xin Li, Tianli Liu, David Chiu, Ting-shao Zhu, and Lei Zhang. 2015. Topic model for identifying suicidal ideation in Chinese microblog. In Proceedings of the 29th Pacific Asia Conference on Language, Information and Computation, pages 553–562.
Xiaolei Huang, Linzi Xing, Jed R. Brubaker, and Michael J. Paul. 2017. Topic model for identify-ing suicidal ideation in Chinese microblog. InIEEE International Conference on Healthcare Informatics (ICHI), pages 470–477.
Thorsten Joachims. 1997. A probabilistic analysis of the Rocchio algorithm with TF-IDF for text catego-rization. In International Conference on Machine Learning (ICML), pages 143–151.
Thorsten Joachims. 2006. Training linear svms in lin-ear time. InProceedings of the 12th ACM SIGKDD International Conference on Knowledge Discovery and Data Mining, pages 217–226.
Klaus Krippendorff. 2007. Computing krippendorffs alpha reliability. Departmental papers (ASC) (2007), 43.
Jey Han Lau, David Newman, and Timothy Baldwin. 2014. Machine reading tea leaves: Automatically evaluating topic coherence and topic model quality. InProceedings of the 14th Conference of the Euro-pean Chapter of the Association for Computational Linguistics, pages 530–539.
David Mimno, Hanna Wallach, Edmund Talley, Miriam Leenders, and Andrew McCallum. 2011. Optimizing semantic coherence in topic models. In Proceedings of the 2011 Conference on Empirical Methods in Natural Language Processing, pages 262–272.
David Newman, Jey Han Lau, Karl Grieser, and Tim-othy Baldwin. 2010. Automatic evaluation of topic coherence. InHuman Language Technologies: The 2010 Annual Conference of the North American Chapter of the Association for Computational Lin-guistics, pages 100–108.
Michael J Paul and Mark Dredze. 2014. Discovering health topics in social media using topic models. PLOS ONE, page 9(8):e103408.
F. Pedregosa, G. Varoquaux, A. Gramfort, V. Michel, B. Thirion, O. Grisel, M. Blondel, P. Pretten-hofer, R. Weiss, V. Dubourg, J. Vanderplas, A. Pas-sos, D. Cournapeau, M. Brucher, M. Perrot, and E. Duchesnay. 2011. Scikit-learn: Machine learning in Python. Journal of Machine Learning Research, 12:2825–2830.
Margaret E Roberts, Brandon M Stewart, Dustin Tin-gley, and Edoardo M Airoldi. 2013. The structural topic model and applied social science. InAdvances in Neural Information Processing Systems Workshop on Topic Models: Computation, Application, and Evaluation.
Hanna M. Wallach, David M. Mimno, and Andrew Mc-Callum. 2009. Rethinking lda: Why priors matter. In Proceedings of the Neural Information Process-ing Systems, pages 1973–1981.