A Graph-based Readability Assessment Method using Word Coupling
Zhiwei Jiang, Gang Sun, Qing Gu∗, Tao Bai, Daoxu Chen
State Key Laboratory for Novel Software Technology Nanjing University, Nanjing 210023, China
[email protected], [email protected], [email protected], [email protected], [email protected]
Abstract
This paper proposes a graph-based read-ability assessment method using word coupling. Compared to the state-of-the-art methods such as the readability for-mulae, the word-based and feature-based methods, our method develops a coupled bag-of-words model which combines the merits of word frequencies and text fea-tures. Unlike the general bag-of-words model which assumes words are indepen-dent, our model correlates the words based on their similarities on readability. By applying TF-IDF (Term Frequency and Inverse Document Frequency), the cou-pled TF-IDF matrix is built, and used in the graph-based classification framework, which involves graph building, merging and label propagation. Experiments are conducted on both English and Chinese datasets. The results demonstrate both ef-fectiveness and potential of the method. 1 Introduction
Readability assessment is a task that aims to eval-uate the reading difficulty or comprehending easi-ness of text documents. It is helpful for education-ists to select texts appropriate to the reading/grade levels of the students, and for web designers to or-ganize texts on web pages for the users doing per-sonalized searches for information retrieval.
Research on readability assessment starts from the early 20th century (Dale and Chall, 1948). Many useful readability formulae have been devel-oped since then (Dale and Chall, 1948; McLaugh-lin, 1969; Kincaid et al., 1975). Currently, due to the development of natural language processing, the methods on readability assessment have made a great progress (Zakaluk and Samuels, 1988;
∗Corresponding author.
Benjamin, 2012; Gonzalez-Dios et al., 2014). The word-based methods compute word frequencies in documents to estimate their readability (Collins-Thompson and Callan, 2004; Kidwell et al., 2009). The feature-based methods extract text features from documents and train classification models to classify the readability (Schwarm and Osten-dorf, 2005; Feng et al., 2010; Franc¸ois and Fairon, 2012; Hancke et al., 2012).
In this paper, we propose a graph-based method using word coupling, which combines the mer-its of both word frequencies and text features for readability assessment. We design a cou-pled bag-of-words model, which correlates words based on their similarities on sentence-level read-ability computed using text features. The model is used in a graph-based classification frame-work, which involves graph building, graph merg-ing/combination, and label propagation. We per-form experiments on datasets of both English and Chinese. The results demonstrate both effective-ness and potential of our method.
The rest of this paper is organized as follows: Section 2 introduces backgrounds of our work. Section3presents the details of the method. Sec-tion 4 designs the experiments and explains the re-sults. Finally, Section 5 concludes the paper with planned future work.
2 Background
In this section, we introduce briefly three research topics relevant to our work: readability assess-ment, the bag-of-words model and the graph-based label propagation method.
2.1 Readability Assessment
Research on readability assessment has devel-oped three types of methods: the readability for-mula, the word-based methods and the feature-based methods (Kincaid et al., 1975; Collins-Thompson and Callan, 2004; Schwarm and
tendorf, 2005). During the early time, many well-known readability formulae have been devel-oped to assess the readability of text documents (Dale and Chall, 1948; McLaughlin, 1969; Kin-caid et al., 1975). Surface text features are de-fined in these formulae to measure both lexical and grammatical complexities of a document. The word-based methods focus on words and their fre-quencies in a document to assess its readability, which mainly include the unigram/bigram/n-gram models (Collins-Thompson and Callan, 2004; Schwarm and Ostendorf, 2005) and the word acquisition model (Kidwell et al., 2009). The feature-based methods focus on extracting text features from a document and training a classifi-cation model to classify its readability (Feng et al., 2010; Franc¸ois and Fairon, 2012; Hancke et al., 2012). Suitable text features are usually essen-tial to the success of these methods. The Support vector machine and logistic regression model are two classification models commonly used in these methods.
2.2 The Bag-of-Words Model
The bag-of-words model is mostly used for doc-ument classification. It constructs a feature space that contains all the distinct words in a language (or the document set). A document is repre-sented by a vector, whose components reflect the weight of every distinct word contained in the doc-ument. Normally, it assumes the words are inde-pendent. Now the capturing of the relationship among words has attracted considerable attention (Wong et al., 1985; Cheng et al., 2013). Inspired by these works, this paper adopts the bag-of-words model in readability assessment, and refines the model by computing similarity among words on reading difficulty.
2.3 The Graph-based Label Propagation Method
Graph-based label propagation is applied on a graph to propagate class labels from labeled nodes to unlabeled ones (Kim et al., 2013). It has been successfully applied in various applications, such as dictionary construction (Kim et al., 2013), word segmentation and tagging (Zeng et al., 2013), and sentiment classification (Ponomareva and Thel-wall, 2012). Typically, a graph-based label propa-gation method consists of two main steps: graph construction and label propagation (Zeng et al., 2013). During the first step, a similarity function
is required to build edges and compute weights between pairs of the nodes (Daitch et al., 2009). Some form of edge pruning is required to refine the graph (Jebara et al., 2009). After that, effective algorithms have been developed to propagate the label distributions to all the nodes (Subramanya et al., 2010; Kim et al., 2013).
3 The Proposed Method
In this section, we present GRAW (Graph-based Readability Assessment method using Word cou-pling), which constructs a coupled bag-of-words model by exploiting the correlation of readabil-ity among the words. Unlike the general bag-of-words model which models document relationship on topic, the coupled bag-of-words model extends it to model the relationship among documents on readability. In the following sections, we describe in detail how to build the coupled bag-of-words model. The model is then used in the graph-based classification framework for readability as-sessment.
3.1 The General Bag-of-Words Model
TF-IDF (Term Frequency and Inverse Document Frequency) is the most popular scheme of the bag-of-words model. Given the set of documentsD, the TF-IDF matrixM can be calculated based on the logarithmically scaled term (i.e. word) fre-quency (Salton and Buckley, 1988) as follows.
Mt,d=tft,d·idft,d
= (1 + logf(t, d))· log|{d||D|t∈d}| (1)
where f(t, d) is the number of times that a term (word)toccurs in a documentd∈ D.
3.2 The Coupled Bag-of-Words Model
As shown in Figure 1, three main stages are required to construct the coupled bag-of-words model: per-sentence readability estimation, word coupling matrix construction and coupled TF-IDF matrix calculation. The following sections de-scribe the details of these stages.
3.2.1 Per-Sentence Readability Estimation
Documents
g
g
g
g
g
g
&RUSXV &RUSXV
Corpus
Extract documents
Calculate coupled TF-IDF matrix
Label the nodes Estimate the
readability of sentences
Construct word coupling matrix
Construct TF-IDF matrix
Levels
g
g
g
g
g
g
Sentences
Levels
g
g
g
Documents Terms
Terms
Label propagation Documents
Terms
Build graph Documents
T
er
[image:3.595.90.510.65.169.2]ms
Figure 1: The Framework of GRAW
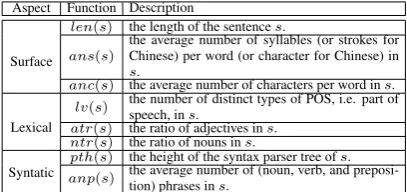
Step 1. Given a sentences, its reading diffi-culty can be quantified as a reading score which is a continuous variable denoted byr(s). The more difficult s is, the greater r(s) will be. Based on text features ofs,r(s)can be computed by one of the eight heuristic functions listed in Table 1 which are grouped into three aspects.
Aspect Function Description
Surface
len(s) the length of the sentences.
ans(s) the average number of syllables (or strokes forChinese) per word (or character for Chinese) in s.
anc(s) the average number of characters per word ins.
Lexical
lv(s) the number of distinct types of POS, i.e. part ofspeech, ins.
atr(s) the ratio of adjectives ins.
ntr(s) the ratio of nouns ins.
Syntatic anppth((ss)) the height of the syntax parser tree ofthe average number of (noun, verb, and preposi-s.
tion) phrases ins.
Table 1: Three aspects of estimating reading diffi-culty of sentences using heuristic functions
Step 2.Letηdenote the pre-determined number of difficulty levels,rmaxandrmindenote the
max-imum and minmax-imum reading score respectively of all the sentences inD. To determine the difficulty level l∗(s) (l∗(s) ∈ [1, η]) of a sentence s, the
range [rmin, rmax]is divided into η intervals, so
that each interval contains the reading scores of 1
η
of all the sentences. The assumption is that all the sentences are equally distributed among the diffi-culty levels. l∗(s) will be i, if the reading score
r(s)resides in thei-th interval.
For each of the three aspects, we compute one l∗(s) for a sentencesby combining the heuristic
functions using the following equations. The as-sumption is that the reading difficulty of a sentence may be determined by the maximum measure on the text features.
lsur(s) = max [llen(s), lans(s), lanc(s)]
llex(s) = max [llv(s), latr(s), lntr(s)]
lsyn(s) = max [lpth(s), lanp(s)]
(2)
3.2.2 Word Coupling Matrix Construction
LetV denote the set of all the words, a word cou-pling matrix is defined asC∗ ∈ R|V|×|V|, the
ele-ment of which reflects the correlation between two words (i.e. terms). Two steps are required to con-struct this matrix. The first is to count the difficulty distributions of words, and the second is to com-pute the correlation between each pair of words according to the similarity of their difficulty dis-tributions.
Step 1. Let S denote the set of all the sen-tences, pt denote the difficulty distribution of a
word (term)t. ptis a vector containingη(i.e. the
number of difficulty levels) values, thei-th part of which can be calculated by the following formula.
pt(i) = n1 t·
X
s∈S
δ(t∈s)·δ(l∗(s) =i) (3)
where nt refers to the number of sentences in
whicht appears. The indicator functionδ(x) re-turns1ifxis true and0otherwise.l∗(s)refers to
one of the functionslsur(s),llex(s)orlsyn(s).
Step 2. Given two words (terms) t1 and
t2, whose level distributions are pt1 and pt2 re-spectively, we measure the distribution difference cKL(t1, t2)using the Kullback-Leibler divergence
(Kullback and Leibler, 1951), computed by the following formula.
cKL(t1, t2) = 12(KL(pt1||pt2) +KL(pt2||pt1)) (4) where KL(p||q) = Pip(i) logpq((ii)). After that, the logistic function is applied on the computed difference to get the normalized distribution simi-larity, i.e.
sim(t1, t2) = 1 +ecKL2 (t1,t2) (5)
Given a wordti, onlyλother words with
[image:3.595.79.283.328.424.2]neighbor set ofti, denoted asN(ti). If a wordtj
is not selected (i.e. tj ∈ N/ (ti)), the
correspond-ingsim(ti, tj)will be assigned 0. After that, the
word coupling matrix (i.e. C∗) with sim(t
i, tj)
as elements is normalized along the rows so that the sum of each row is 1. Based on three different l∗(s), we construct three word coupling matrices
Csur,ClexandCsyn.
3.2.3 Coupled TF-IDF Matrix Calculation
In the general bag-of-words model, the words are treated as independent of each other. However, for readability assessment, words may be correlated according to the similarity of their difficulty dis-tributions. To improve the TF-IDF matrixM de-scribed in Section 3.1, we multiply it by the word coupling matrix C∗, so that the term frequencies
are shared among the highly correlated (coupled) words. We denote the coupled TF-IDF matrix as M∗, obtained by the following formula.
M∗ =C∗·M (6)
Specifically, three homogenous coupled TF-IDF matricesMsur,MlexandMsyn can be built
according to the three word coupling matricesC∗.
3.3 Graph-based Readability Assessment
We employ the coupled bag-of-words model for readability assessment under the graph-based clas-sification framework as described in the previ-ous work (Zhu and Ghahramani, 2002). Firstly, we construct a graph representing the readabil-ity relationship among documents by using the coupled bag-of-words model to compute the rela-tions among these documents. Secondly, we esti-mate reading levels of documents by applying la-bel propagation on the graph.
3.3.1 Graph Construction
We build a directed graphG∗to represent the
read-ability relation among documents, where nodes represent documents, and edges are weighted by the similarities between pairs of documents. Given a similarity function, we link documents di todj
with an edge of weightG∗
ij, defined as:
G∗
i,j=
(
sim(di, dj) ifdj ∈ N(di)
0 otherwise (7)
whereN(di) is the set of k-nearest neighbors of
didetermined by the similarity function.
common neighbors candidate neighbors
0 2
0 4
1
v
[image:4.595.338.492.62.158.2]3
Figure 2: Illustration of the graph merging strategy
Given the coupled matrixM∗ ∈Rm×|D|which
maps each document into a m-dimension feature space, the similarity functionsim(di, dj) can be
defined by the Euclidean distance as follows.
sim(di, dj) = pPm 1
k=1(Mk,i−Mk,j)2+
(8)
whereis a small constant to avoid zero denomi-nators.
Merge the three graphs Refer to Section 3.2, the three coupled TF-IDF matrices will lead to three different document graphs, denoted asGsur,
GlexandGsyn respectively. To take advantage of
the three aspects at one time, we need to merge the three graphs into one, denoted asGc.
In Gc, each node also keeps k neighbors, and
some edges shall be filtered out from the three graphs. The basic idea is to remove edges con-taining redundant information, as shown in Fig-ure 2. For each nodev, we firstly select the neigh-bors which are common in all the three graphs (i.e.
Nsur(v)∩ Nlex(v)∩ Nsyn(v)). Secondly, for the
rest candidate nodes, which are the neighbors of v in at least one graph, we select one by one the node which possesses the least number of com-mon neighbors (from all the three graphs) with the nodes that are already selected inNc(v). The
ob-jective is to keep the number of triangles inGcto
a minimum. The edge weights ofGcare averaged
on the corresponding edges appeared in the three graphs.
computation depends on pre-assigned class labels, and represent a document as a vector of the feature values. We compute the similarity between any pair of documents using the Euclidean distance, and built the feature-based graph (denoted asGf)
in the same way as above.
Additionally, to take advantage of both graphs, we combine them into one (denoted asGcf) using
the following formula.
Gcfi,j = max [Gci,j, Gfi,j] (9)
3.3.2 Graph Propagation
Given a graphG∗constructed in previous sections,
its nodes are divided into two sets: the labeled set Vl and the unlabeled set Vu. The goal of label
propagation is to propagate class labels from the labeled nodes (i.e. documents) to the entire graph. Here, we use a simplified version of the label prop-agation method presented in (Subramanya et al., 2010), which has been proved effective (Kim et al., 2013). The method iteratively updates the la-bel distribution on a document node using the fol-lowing equation.
p(i) d (l) =κ1
d
p0d(l)δ(d∈Vl) + X
v∈N(d)
Gd,vp(vi−1)(l)
(10)
At the left side of Eq.10, p(di)(l) is the afterward probability ofl(i.e. the class label) on a nodedat thei-th iteration. At the right side,κd is the
nor-malizing constant to make sure the sum of all the probabilities is 1, andp0
d(l)is the initial
probabil-ity oflondifdis initially labeled (i.e. belonging to the labeled set Vl). δ(x) is the indicator
func-tion. N(d)denotes the set of neighbors ofd. The iteration stops when the changes inp(di)(l) for all the nodes and label values are small enough (e.g. less thane−3), oriexceeds a predefined number
(e.g. greater than30). 4 Empirical Studies
In this section, we conduct experiments on datasets of both English and Chinese, to investi-gate the following three research questions:
RQ1: Whether the proposed method (i.e. GRAW) outperforms the state-of-the-art methods for readability assessment?
RQ2: What are the effects of adding the word coupling matrix to the general bag-of-words model?
RQ3: Whether the graph merging strategy is effective, and whether the performance can be
further improved by combining the feature-based graph.
4.1 Corpus and Metrics
To evaluate our proposed method, we collected two datasets. The first is CPT (Chinese primary
textbook) (Jiang et al., 2014), which contains
Chi-nese documents of six reading levels. The second is ENCT (English New Concept textbook) which contains English documents of four reading levels. Both datasets are built from well-known textbooks where documents are labeled as grade levels by credible educationists. The details of the datasets are listed in Table 2.
Dataset Language #Grade #Doc #Sent #Word
CPT Chinese 6 637 16145 234372
ENCT English 4 279 4671 62921
Table 2: Statistics of the datasets on both English and Chinese
We conduct experiments on both datasets us-ing the cross-validation which randomly divides a dataset into labeled (training) and unlabeled (test) sets. The labeling proportion is varied to inves-tigate the performance of GRAW under differ-ent circumstances. To reduce variability, given certain labeling proportion, 100rounds of cross-validation are performed, and the cross-validation re-sults are averaged over all the rounds. We choose the precision (P), recall (R) and F1-measure (F1) as the performance metrics.
4.2 Comparison to the State-of-the-Art Methods
Dataset Level Metric SMOG FK SUM LRMethods SVM GRAWc GRAW cf
CPT (Chinese)
Gr.1 RP 5717..4831 749..6907 3671..3176 7171..1787 6773..2818 7373..2826 8375..2917
F1 26.14 15.25 47.67 71.23 69.70 72.98 78.89
Gr.2 RP 3431..7306 3128..4400 2937..7394 5651..4862 5950..4578 5752..3605 6655..8306
F1 32.66 29.42 33.13 53.67 54.53 54.40 60.37
Gr.3 RP 2058..0584 2075..7953 2528..0612 4344..9415 4948..9489 5846..5933 6851..7241
F1 29.89 32.40 26.35 43.72 49.04 51.57 58.74
Gr.4 RP 4125..0606 2831..9482 2528..7660 3331..8235 3333..6492 3539..4290 4428..1588
F1 31.03 29.69 26.91 32.24 33.58 37.32 34.57
Gr.5 RP 334..0057 452..7100 3428..4171 3637..1270 3437..2930 4527..1202 1937..3300
F1 7.02 4.95 31.10 36.61 35.47 33.35 24.45
Gr.6 RP 00..0000 60..6735 4532..8121 3940..0347 4643..4853 5145..8191 5444..2406
F1 0.00 0.67 37.55 39.48 44.65 48.38 48.15
Avg. RP 2825..4838 3424..4868 3337..3539 4646..4353 4848..0143 5050..6041 5351..4326
F1 21.12 18.73 33.78 46.16 47.83 49.67 50.86
ENCT (English)
Gr.1 RP 5467..6550 6073..7950 9684..7759 8988..3260 8590..4574 8395..7742 8395..5395
F1 60.18 66.36 90.09 88.64 87.76 89.01 89.18
Gr.2 RP 5059..1128 5663..2393 3578..0730 8685..0751 9092..8680 9688..7660 9689..0386
F1 54.17 59.69 48.11 85.54 91.68 92.42 92.70
Gr.3 RP 2924..4922 3226..0994 6840..3353 8688..1731 8489..7808 9485..1736 9689..7356
F1 26.40 29.15 50.77 86.94 86.16 89.40 92.92
Gr.4 RP 8514..7364 9418..0021 9769..6430 8987..0779 8581..2120 7791..9370 9585..2636
F1 24.06 29.46 80.81 88.02 81.79 83.84 89.81
Avg. RP 5541..0041 6045..7865 7171..4518 8788..1605 8787..0895 8890..1627 9092..3968
[image:6.595.93.511.66.314.2]F1 41.20 46.16 67.44 87.28 86.85 88.67 91.15
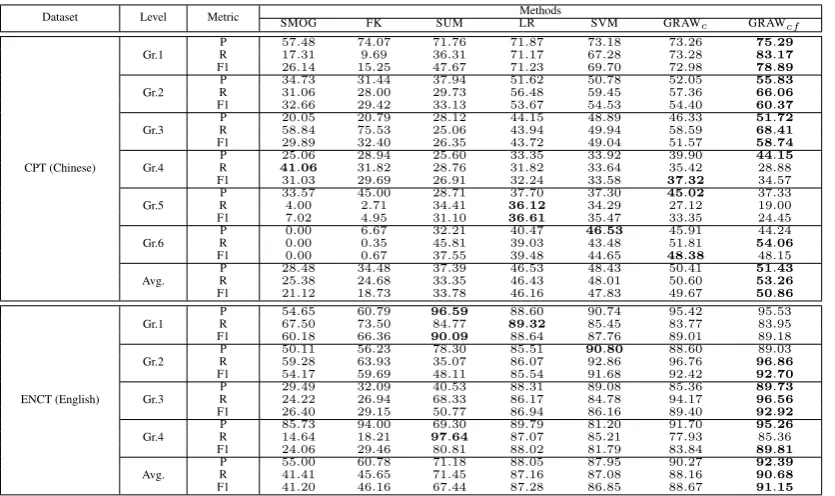
Table 3: The average Precision, Recall and F1-measure (%) per reading level of the seven methods for readability assessment on both datasets when the labeling proportion is0.7
support vector machine are used as the classifiers respectively.
For GRAW, we implement label propagation on both the merged graphGcand the final graphGcf
(Section 3.3), denoted as GRAWc and GRAWcf
respectively. Table 3 gives the average perfor-mance measure per reading level resulted by the implemented methods on both datasets. Unless otherwise specified, we fixedηto3, andλto2800
for CPT and 2000 for ENCT. The proportion of the labeled (training) set is set to0.7.
In Table 3, the precision, recall and F1-measure of all the seven methods are calculated per read-ing (grade) level on both English and Chinese datasets. The values marked in bold in each row refer to the maximum (best) measure gained by the methods.
From Table 3, the readability formulae (SMOG and FK) perform poorly on either the precision or recall measure, and their F1-measure values are generally the poorest. Both SMOG and FK are designed for English, and have acceptable per-formance on the English dataset ENCT. The un-igram model (SUM) performs a little better than the readability formulae. On ENCT, It has rel-atively good performance on grade levels 1 and 4, while on the Chinese dataset CPT, the perfor-mance is not satisfactory. The feature-based meth-ods (LR and SVM) perform well on both ENCT
0.1 0.2 0.3 0.4 0.5 0.6 0.7 0.8 0.9 0.1
0.2 0.3 0.4 0.5 0.6
Proportion of the labeled set
F
1
−me
a
su
re
(C
h
in
e
se
)
SMOG FK SUM SVM LR GRAWc
GRAWcf
0.1 0.2 0.3 0.4 0.5 0.6 0.7 0.8 0.9 0.3
0.4 0.5 0.6 0.7 0.8 0.9 1
Proportion of the labeled set
F
1
−me
a
su
re
(En
g
lish
)
SMOG FK SUM SVM LR GRAWc
GRAWcf
Figure 3: The average F1-measure of the seven methods on both datasets with the labeling pro-portion varied from0.1to0.9
and CPT, which means both the text features de-veloped and the classifiers trained are useful. In general, GRAWcperforms better than both LR and
SVM, which demonstrates the effectiveness of our method. In addition, by combining the feature-based graph (GRAWcf), GRAW can be improved,
and performs the best on all the three metrics over the majority of reading levels on both datasets. The only exception is on level 5 in CPT, which suggests the requirement of further improvements. We study the effect of labeling proportion on the performance of these methods on both datasets. The F1-measure averaged over the reading levels is used, since it is a good representative of the three metrics according to Table 3. Figure 3 depicts the performance trends of all the methods.
[image:6.595.311.519.369.454.2]0.1 0.2 0.3 0.4 0.5 0.6 0.7 0.8 0.9 0 0.1 0.2 0.3 0.4 0.5 0.6
Proportion of the labeled set
F 1 −me a su re (C h in e se ) TF−IDF Msur Mlex Msyn
0.1 0.2 0.3 0.4 0.5 0.6 0.7 0.8 0.9
0.65 0.7 0.75 0.8 0.85 0.9
Proportion of the labeled set
F 1 −me a su re (En g lish ) TF−IDF Msur Mlex Msyn
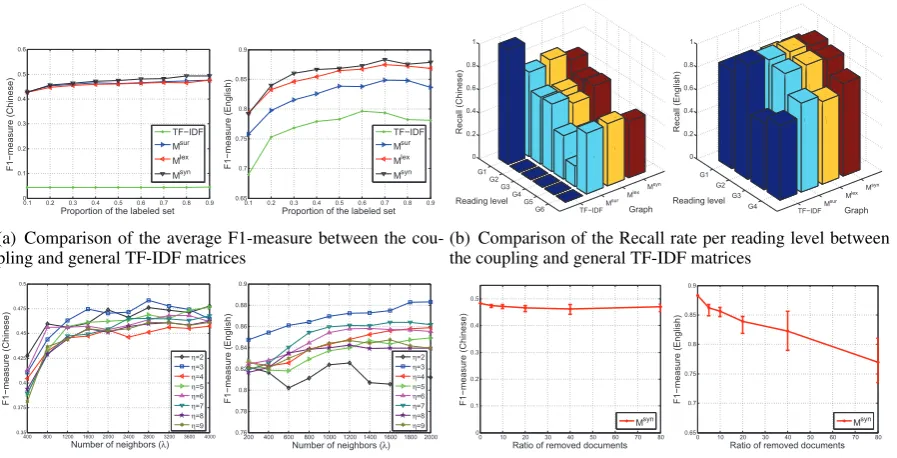
(a) Comparison of the average F1-measure between the cou-pling and general TF-IDF matrices
G1 G2 G3 G4 G5 G6 0 0.2 0.4 0.6 0.8 1 Msyn Graph Mlex Msur TF−IDF R e ca ll (C h in e se ) Reading level G1 G2 G3 G4 0 0.2 0.4 0.6 0.8 1 Msyn Graph Mlex Msur TF−IDF R e ca ll (En g lish ) Reading level
(b) Comparison of the Recall rate per reading level between the coupling and general TF-IDF matrices
400 800 1200 1600 2000 2400 2800 3200 3600 4000
0.35 0.375 0.4 0.425 0.45 0.475 0.5
Number of neighbors (λ)
F 1 −me a su re (C h in e se ) η=2 η=3 η=4 η=5 η=6 η=7 η=8 η=9
200 400 600 800 100012001400 160018002000 0.76 0.78 0.8 0.82 0.84 0.86 0.88 0.9
Number of neighbors (λ)
F 1 −me a su re (En g lish ) η=2 η=3 η=4 η=5 η=6 η=7 η=8 η=9
(c) The effects ofη and λon the performance of the word coupling matrix
0 10 20 30 40 50 60 70 80
0 0.1 0.2 0.3 0.4 0.5
Ratio of removed documents
F 1 −me a su re (C h in e se ) Msyn
0 10 20 30 40 50 60 70 80 0.65 0.7 0.75 0.8 0.85 0.9
Ratio of removed documents
F 1 −me a su re (En g lish ) Msyn
[image:7.595.77.526.62.291.2](d) The effect of corpus size on the performance of the word coupling matrix
Figure 4: Four perspectives on the effectiveness of the word coupling matrices
from the increasing size of the labeled set. This suggests that the performance of the readability formulae can hardly be improved by accumulat-ing trainaccumulat-ing data. The other 5 methods achieve better performance on larger labeled set, and out-perform the two formulae even if the labeling pro-portion is small. Both LR and SVM perform bet-ter than SUM, but the performance is not good when the labeling proportion is less than 0.3, es-pecially on the Chinese dataset. On the Chinese dataset, SVM performs better than LR, while on the English dataset, the situation is reversed. Both versions of GRAW outperform the other methods over the labeling ranges on both datasets. In ad-dition, GRAW performs well when the labeling proportion is still small. Again, by combining the feature-based graph, the performance of GRAW is consistently improved.
In summary, GRAW can outperform the state-of-the-art methods for readability assessment on both English and Chinese datasets. By combin-ing the feature-based graph, the performance of GRAW can be further improved.
4.3 Effects of the Word Coupling Matrix
For RQ2, we firstly compare the coupled bag-of-words model to the general model in the process of graph construction. Four graphs are built by us-ing each of the three word couplus-ing matrices (i.e. Msur, Mlex and Msyn) and the TF-IDF matrix
respectively. Label propagation is applied on each graph to predict reading levels of unlabeled docu-ments. The labeling proportion is varied from0.1
to0.9 on both the English and Chinese datasets. Figure 4(a) depicts the average F1-measure re-sulted from the four graphs.
From Figure 4(a), the three word coupling ma-trices greatly outperform the TF-IDF matrix, espe-cially on the Chinese dataset. This demonstrates that the word coupling matrices are very effective in improving the performance of the general bag-of-words model for readability assessment.
Secondly, we investigate the performance of the four matrices per reading level. Figure 4(b) de-picts the recall rate per reading level of the four corresponding graphs in bar charts. The labeling proportion is set to 0.7. The recall rate is used because it makes the reason evident that the TF-IDF matrix performs poorly. From Figure 4(b), on the Chinese dataset, nearly all the unlabeled docu-ments are classified as level 1 by the TF-IDF ma-trix, in which the word frequencies are too few to make meaningful discrimination among the read-ing levels. On the English dataset, the TF-IDF matrix performs better, but still prefers to classify documents into lower levels.
[image:7.595.79.522.69.173.2]matrices. To investigate their effects on the per-formance of the built matrices, we vary the val-ues of bothηandλ, and compute the average F1-measure on the two datasets. Figure 4(c) depicts the results in line charts, whereηvaries from2to9
step by 1, whileλvaries from400to4000step by
400on Chinese and from200to2000step by200
on English (the difference is due to the dissimilar number of documents between the two datasets). The three word coupling matrices exhibit similar behavior during experiments, hence, onlyMsynis
depicted.
From Figure 4(c), a smallη(e.g. 2 or 3) is good on the Chinese dataset. However, on the English dataset,η = 2leads to the poorest performance. It seems the increasing of η causes vibrated perfor-mance, and the trend is further complicated when involving λ. Above all, η = 3 gives a prefer-able option on both datasets. For λ, most of the lines exhibit a similar trend that rises first and then keeps stable on both datasets, although some may drop whenλis too large. This suggests that mak-ing a relatively large number of the other words as the neighbors of one (i.e. λ = 2800on the Chi-nese dataset andλ= 2000on the English dataset) will make an effective word coupling matrix.
The word coupling matrix constructed in GRAW uses the whole corpus on either English or Chinese. To investigate if the corpus size takes effects on the performance of GRAW, we vary the proportion of the corpus used by randomly re-moving documents from each reading level. Fig-ure 4(d) depicts the average F1-measFig-ure resulted by Msyn. The removing ratio is selected from {0,0.05,0.1,0.2,0.4,0.8}. Both the mean values and deviations are shown on the line chart.
From Figure 4(d), on the Chinese dataset, the performance of GRAW suffers little from remov-ing documents, even if only 20% documents are left for building the word coupling matrix. How-ever, on the English dataset, the mean perfor-mance drops sharply and the deviation increases evidently. This suggests that cumulating sufficient corpus is required for building a suitable word coupling matrix in GRAW, and factors other than number of documents may influence the corpus quality, which deserves further study.
In summary, the word coupling matrix plays an essential role in GRAW. For building a suitable word coupling matrix, the number of difficulty levels of sentences (η) can be set to 3, and a
rel-atively large number of the other words should be selected as the neighbors of a word. A sufficient corpus is required for refining the matrix.
4.4 Effectiveness of Graph Combination
For RQ3, we compare graphs built on each sin-gular word coupling matrix (i.e. Msur,Mlex and
Msyn) to the merged graph (i.e. GRAWc) and the
combined graph (i.e. GRAWcf). Figure 5 depicts
the average F1-measure resulted after applying la-bel propagation on these graphs with lala-beling pro-portion varied from0.1to0.9. The feature-based graph (i.e.Gf) is also depicted for comparison.
0.1 0.2 0.3 0.4 0.5 0.6 0.7 0.8 0.9
0.3 0.35 0.4 0.45 0.5 0.55
Proportion of the labeled set
F
1
−me
a
su
re
(C
h
in
e
se
)
Msur
Mlex
Msyn
Gf
GRAWc
GRAWcf
0.1 0.2 0.3 0.4 0.5 0.6 0.7 0.8 0.9 0.7
0.75 0.8 0.85 0.9
Proportion of the labeled set
F
1
−me
a
su
re
(En
g
lish
)
Msur
Mlex
Msyn
Gf
GRAWc
GRAWcf
Figure 5: The average F1-measure of differ-ent types of graphs on the English and Chinese datasets
From Figure 5, the merged graph GRAWc
out-performs the three basic graphs on both datasets in most cases. Within the three, Msyn performs
best, especially on the English dataset, where it can outperform GRAWc slightly when the
label-ing proportion is small (0.2−0.4). By combining the feature-based graph, GRAWcf performs even
better on both datasets, although Gf performs
poorest among all the graphs. In summary, the graph merging strategy is effective, and by com-bining the feature-based graph, the performance of GRAW can be improved. This demonstrates the potential of GRAW.
5 Conclusion
[image:8.595.313.519.249.333.2]methods for readability assessment. In addition, the evaluation demonstrates the potential of the coupled bag-of-words model and the graph com-bination/merging strategies.
In our future work, we plan to verify the sound-ness of the results by applying our method on large volume corpus of both English and Chinese. In ad-dition, we will investigate other ways of comput-ing the word couplcomput-ing matrices, such as incorpo-rating word coherency or semantics, and develop efficient merging strategies which can be used for training classification models, as well as for build-ing graphs.
Acknowledgments
This work was supported by the National NSFC projects under Grant Nos. 61373012, 61321491, and 91218302.
References
Rebekah George Benjamin. 2012. Reconstructing readability: Recent developments and recommenda-tions in the analysis of text difficulty. Educational Psychology Review, 24(1):63–88.
Xin Cheng, Duoqian Miao, Can Wang, and Longbing Cao. 2013. Coupled term-term relation analysis for document clustering. In Proceedings of the 2013 International Joint Conference on Neural Networks, pages 1–8. IEEE.
Kevyn Collins-Thompson and James P Callan. 2004. A language modeling approach to predicting reading difficulty. InProceedings of the 2004 Conference of the North American Chapter of the Association for Computational Linguistics: Human Language Tech-nologies, pages 193–200. Association for Computa-tional Linguistics.
Samuel I Daitch, Jonathan A Kelner, and Daniel A Spielman. 2009. Fitting a graph to vector data. In Proceedings of the 26th Annual International Conference on Machine Learning, pages 201–208. ACM.
Edgar Dale and Jeanne S. Chall. 1948. A formula for predicting readability. Educational Research Bul-letin, 27(1):11–28.
Lijun Feng, Martin Jansche, Matt Huenerfauth, and No´emie Elhadad. 2010. A comparison of features for automatic readability assessment. In Proceed-ings of the 23rd International Conference on Com-putational Linguistics: Posters, pages 276–284. As-sociation for Computational Linguistics.
Thomas Franc¸ois and C´edrick Fairon. 2012. An ai readability formula for french as a foreign language. In Proceedings of the 2012 Joint Conference on
Empirical Methods in Natural Language Process-ing and Computational Natural Language LearnProcess-ing, pages 466–477. Association for Computational Lin-guistics.
Itziar Gonzalez-Dios, Marıa Jes´us Aranzabe, Arantza Dıaz de Ilarraza, and Haritz Salaberri. 2014. Simple or complex? assessing the readability of basque texts. InProceedings of the 25th Inter-national Conference on Computational Linguistics, pages 334–344. Association for Computational Linguistics.
Julia Hancke, Sowmya Vajjala, and Detmar Meurers. 2012. Readability classification for german using lexical, syntactic, and morphological features. In
Proceedings of the 24th International Conference on Computational Linguistics, pages 1063–1080. Asso-ciation for Computational Linguistics.
Tony Jebara, Jun Wang, and Shih-Fu Chang. 2009. Graph construction and b-matching for semi-supervised learning. InProceedings of the 26th An-nual International Conference on Machine Learn-ing, pages 441–448. ACM.
Zhiwei Jiang, Gang Sun, Qing Gu, and Daoxu Chen. 2014. An ordinal multi-class classification method for readability assessment of chinese documents. In
Knowledge Science, Engineering and Management, pages 61–72. Springer.
Paul Kidwell, Guy Lebanon, and Kevyn Collins-Thompson. 2009. Statistical estimation of word ac-quisition with application to readability prediction. In Proceedings of the 2009 Conference on Empiri-cal Methods in Natural Language Processing, pages 900–909. Association for Computational Linguis-tics.
Doo Soon Kim, Kunal Verma, and Peter Z Yeh. 2013. Joint extraction and labeling via graph propaga-tion for dicpropaga-tionary construcpropaga-tion. In Proceedings of the 27th AAAI Conference on Artificial Intelligence, pages 510–517.
J Peter Kincaid, Robert P Fishburne Jr, Richard L Rogers, and Brad S Chissom. 1975. Derivation of new readability formulas (automated readability in-dex, fog count and flesch reading ease formula) for navy enlisted personnel. Technical report, Naval Air Station, Memphis, TN.
Solomon Kullback and Richard A Leibler. 1951. On information and sufficiency. The annals of mathe-matical statistics, 22(1):79–86.
G Harry McLaughlin. 1969. Smog grading: A new readability formula. Journal of reading, 12(8):639– 646.
Empirical Methods in Natural Language Process-ing and Computational Natural Language LearnProcess-ing, pages 655–665. Association for Computational Lin-guistics.
Gerard Salton and Christopher Buckley. 1988. Term-weighting approaches in automatic text retrieval. In-formation processing and management, 24(5):513– 523.
Sarah E Schwarm and Mari Ostendorf. 2005. Read-ing level assessment usRead-ing support vector machines and statistical language models. In Proceedings of the 43rd Annual Meeting on Association for Com-putational Linguistics, pages 523–530. Association for Computational Linguistics.
Amarnag Subramanya, Slav Petrov, and Fernando Pereira. 2010. Efficient graph-based semi-supervised learning of structured tagging models. In Proceedings of the 2010 Conference on Empiri-cal Methods in Natural Language Processing, pages 167–176. Association for Computational Linguis-tics.
S. K. Michael Wong, Wojciech Ziarko, and P. C. N. Wong. 1985. Generalized vector space model in information retrieval. InProceedings of the 8th An-nual International ACM SIGIR Conference on Re-search and Development in Information Retrieval, pages 18–25. ACM.
Beverley L. Zakaluk and S. Jay Samuels. 1988. Read-ability: Its Past, Present, and Future. ERIC. Xiaodong Zeng, Derek F Wong, Lidia S Chao, and
Is-abel Trancoso. 2013. Graph-based semi-supervised model for joint chinese word segmentation and part-of-speech tagging. InProceeding of the 51st Annual Meeting of the Association for Computational Lin-guistics, pages 770–779. Association for Computa-tional Linguistics.