ISSN Online: 2151-4844 ISSN Print: 2151-481X
DOI: 10.4236/sgre.2018.93004 Mar. 30, 2018 43 Smart Grid and Renewable Energy
Analysis of T-Coefficients Using the Columnar
Cylindrical Orientation of Solar Cell Grain
Serigne Ndiangue Leye
1,2, Ibrahima Fall
1, Senghane Mbodji
1,2, Papa Lat Tabara Sow
1,
Gregoire Sissoko
21Research Team in Renewable Energies, Materials and Laser of Department of Physics, Alioune DIOP University of Bambey, Bambey, Senegal
2Laboratory of Semiconductors and Solar Energy, Department of Physics, Faculty of Science and Technology, Cheikh Anta Diop University, Dakar, Senegal
Abstract
We report the study of the temperature dependance of the performance electronic parameters of an N-P solar cell by considering as model, the co-lumnar cylindrical orientation associated to the dynamic junction velocity (SF) concept. We presented the photocurrent-photovoltage (I-V) and Pow-er-photovoltage (P-V) characteristic curves. The short-circuit photocurrent (Isc), the open circuit photovoltage (Uoc), the fill factor (FF) and the efficiency
(η) are linearly dependent on the temperature. The temperature coefficients (T-coefficient) relative to the short-circuit, open-circuit photovoltage and ef-ficiency are calculated and the comparison with data from the literature showed the accuracy of the considered model.
Keywords
Polycrystalline, Solar Cell, Junction Recombination Velocity, Temperature
1. Introduction
The photovoltaic effect was first discovered in 1839 by Edmond Becquerel [1]. The photosensitive properties of selenium and the photovoltaic effect in semi-conductors were developed in 1873 by Willough Smith and in 1875 by Werner Von Siemens, respectively [1]. The first solar cell made of selenium and gold with a 1% of efficiency [1] was then created by Charles Fritts in 1883. Since then, several research projects have significantly increased the efficiency of solar cell’s to reach 22.9% in 2015 for a crystalline silicon solar cell under the global AM1.5 spectrum (1000 W/m2) at 25˚C [2]. Due to the improved manufacturing
How to cite this paper: Leye, S.N., Fall, I., Mbodji, S., Sow, P.L.T. and Sissoko, G. (2018) Analysis of T-Coefficients Using the Columnar Cylindrical Orientation of Solar Cell Grain. Smart Grid and Renewable Energy, 9, 43-56.
https://doi.org/10.4236/sgre.2018.93004
Received: February 26, 2018 Accepted: March 27, 2018 Published: March 30, 2018
Copyright © 2018 by authors and Scientific Research Publishing Inc. This work is licensed under the Creative Commons Attribution International License (CC BY 4.0).
http://creativecommons.org/licenses/by/4.0/
DOI: 10.4236/sgre.2018.93004 44 Smart Grid and Renewable Energy
technologies and the photovoltaic industries development, the solar energy is more and more used, in all different areas of life. Solar energy is then considered as the energy of the future due to its properties: low maintenance cost, high re-liability, eco-friendly, renewable and low-carbon resources [3].
However, there are some limitations to increasing the efficiency of solar cells and photovoltaics modules. These limitations are mainly due to the recombina-tion phenomena [1] [4] [5] [6] [7] [8], the ohmic losses [9], the type of semi-conductors [9], the tracking angle [3][10], the manufacturing technologies and process [1] and the environmental conditions [3][9][11] which include the light intensity, the temperature, the wind, the dust, the humidity, the ultraviolet rays, the shading, the seasonal variations, the latitude, the cloudiness, the air pollution, the albedo of earth, the rain, the breeze, the tilt angle, etc.
Many authors, using different methods, have studied the temperature effect on the solar cell due to sunlight exposure and the effect of absorption [3][11]. These works show that the solar cell parameters like the open circuit voltage, the maximum power, the fill factor, the efficiency, the shunt resistance [12] and the energy band gap are found decreasing with cell temperature while the short-circuit current density, the reverse saturation current density, the series resistance [12] and the diode ideality factor [12] are observed to increase with temperature. Some authors have also studied the temperature effects on the solar cell or on the solar photovoltaic system (SPV) determining the temperature coefficients of the open circuit voltage, the maximum power, the fill factor, the efficiency and the short-circuit current density [12].
One can note Priyanka et al.’s work [9] which analyzed of the temperature dependence of solar cell performance. They consider semiconductor materials such as Ge, Si, GaAs, InP, CdTe and CdS and calculate the rate of change of the performance parameters of these solar cells. F. Ghani et al. [12] collected the current-voltage data from a mono-crystalline silicon cell at constant irradiance but and at temperatures within the range of 25˚C and 70˚C. They calculated the photo-generated current and reverse saturation current densities, the series and shunt resistances and the diode ideality factor using a unique numerical ap-proach which takes into consideration several points taken from the experimen-tal current-voltage data. They found that all these five modeling parameters were influenced by temperature, with the reverse saturation current followed by the series and shunt resistances being affected most significantly [12]. Impact of temperature on performance of series and parallel connected mono-crystalline silicon solar cells was studied by Subhash Chander et al.[3]. They proved that all performance parameters of solar cell, without short-circuit current density, de-crease with temperature.
effi-DOI: 10.4236/sgre.2018.93004 45 Smart Grid and Renewable Energy
ciency of the system which varies in summer, monsoon, post-monsoon and winter seasons.
Ultimately, we have noted through the literature that temperature plays an important role in the performance of photovoltaic systems but works which consider the temperature effects of the solar cell constituted of cylindrical co-lumnar grains were not produced yet [13][14]. Therefore, to bridge this gap, we undertaken a study on an N-P polycristalline silicon solar cell considering the columnar cylindrical grains orientation. Hence, considering the back-side sur-face recombination velocity (Sb) and the dynamic junction velocity (SF) [5], we determine the temperature effect on the performance of the current-voltage density characteristic, the open circuit voltage, the fill factor, the efficiency and the short circuit current density of the considered solar cell. Additionally, we studied the temperature coefficients (T-coefficients) of these parameters.
[image:3.595.220.526.421.702.2]2. Materials and Methods
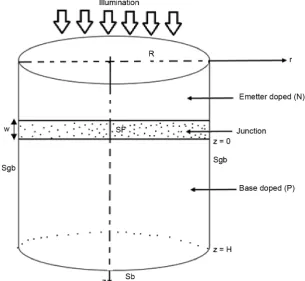
Figure 1 shows columnar cylindrical model used in this work. The model cor-responds to an isolated columnar grain of an N-P polycrystalline solar cell.
The solar cell is assumed to have three zones [8]: the emitter doped N, the base doped P and the junction N-P between the emitter and the base. Here, the thickness [8] of the junction is not considered in the calculation. The columnar cylindrical grain has a base thickness of H and a radius R. The variation of R corresponds the grains size variation.
DOI: 10.4236/sgre.2018.93004 46 Smart Grid and Renewable Energy
When the solar cell is illuminated, there is creation of electron-hole pairs in the base [1]. Using the cylindrical coordinates and considering that the emitter is a dead zone [8], we determine the carriers concentration in the excess minority carriers’ density equation in the base that is written as:
(
)
(
)
(
)
(
)
(
)
( )
( )
( )
2 2 2
2 2 2 2
2
, , , , 1 , , 1 , ,
, ,
r z r z r z r z
r r
r z r
r z G z
D T L T
δ θ δ θ δ θ δ θ
θ δ θ ∂ ∂ ∂ ∂ + + ⋅ + ⋅ ∂ ∂ ∂ ∂ − = − (1)
We assume that in our model, the intragrain material is homogeneous and the doping level in each region is assumed to be uniform, hence no electric field in the top or the base region. This leads to azimuthal symmetry and the number of independent coordinates reduces to two, namely, rand z, using the conventional cylindrical coordinate system. Therefore the continuity equation becomes:
( )
( )
( )
( )
( )
( )
( )
2 2
2 2 2
, , 1 , ,
r z r z r z r z G z
r D T
r
r z L T
δ δ δ δ
∂ ∂ ∂
+ + ⋅ − = −
∂
∂ ∂ (2)
with:
( )
r z,δ : excess minority carrier’s density;
( )
L T is the electron diffusion length in the base;
( )
D T is the electron diffusion coefficient in the base. Its specifications are
given in [15] and expressed as:
( )
( )
2
L T = ⋅
τ
D T (3)τ is the lifetime; and
( )
( )
kbD T T T
q µ
= ⋅ ⋅ (4)
( )
Tµ is the coefficient mobility [16] for electrons, given as:
( )
9 2.42 2 1 11.43 10
T T cm V S
µ
= × ⋅ − ⋅ − ⋅ −(5)
b
k is the Boltzmann constant;
q is the elementary charge of an electron;
( )
G z is the electron-hole pairs generation expressed as [17]:
( )
0(
1)
exp(
)
G z = ⋅ ⋅ −α I R ⋅ − ⋅α z (6)
The coefficient α denotes the absorption of light for wavelength λ; and I0 is
the incident photon flux [18].
While proceeding by the separation method of the variables used by [19], we can set:
( )
( )
(
)
1
, k sin k k
k
r z f r c z K
δ ∞
≥
DOI: 10.4236/sgre.2018.93004 47 Smart Grid and Renewable Energy
The general solution of the excess minority carriers density is then given by:
( )
(
)
( )
( )
( )
(
)
(
)
2
2 2 2
1 ,
1 cos
2 1 2
sin
k k k
k k k
k k k
r z
L c c H
R k K
A r G H c z K
H D T c L T H c
δ α α ∞ ≥ ⋅ ⋅ − ⋅ − ⋅ = ⋅ + ⋅ ⋅ − ⋅ ⋅ ⋅ + ⋅ + ⋅
∑
(8)Coefficients Ak and Kk are obtained from the boundaries conditions of the
solar cell:
• at the junction (z = 0) [6][8]:
(
)
( ) (
)
0 , ,
, , 0
z
r z T Sf
r T z
z D T
δ
δ =
∂
= ⋅ =
∂ (9) • at the back side of the solar cell [6][8]:
(
)
( ) (
)
, ,
, ,
z H
r z T Sb
r T z H
z D T
δ
δ =
∂
= − ⋅ =
∂ (10) • at the grain boundary (r = R) [13][14]:
( )
( ) (
)
,
,
z R
f r T Sgb
f R T
r = D T
∂
= − ⋅
∂ (11)
In Equation (9), as shown by [5][6][8], SF is the dynamic junction velocity and traduces both the losses occurring across the junction and the current flow to the external load. In our early studies we have explained concept of SF and its two terms [6]: Sf0 and Sfj.
Sb, in Equation (10), is the back-side surface recombination velocity. It quantifies the rate at which excess minority carriers are lost at the back-side sur-face of the cell [8][20]. Sgb denotes the grain boundary recombination velocity on the contact of two grains [8][14].
3. Results and Discussions
[image:5.595.191.539.97.360.2]In Figure 2, we plotted the power of the solar cell versus the dynamic junction velocity (SF) with solar cell’s temperature (T) as variable parameter which can take: 298 K, 310 K, 320 K and 330 K. We have used this temperature interval that is close to the ambient temperature for a better working of the solar cells. When the temperature of the solar cell increases, the magnitude of the solar cell’s pow-er decreases when SF ≤ 0.125 × 105 cm·s−1.
Figure 2 shows that the increase of the dynamic junction velocity (SF) in-creases the power of the solar cell, which reaches a maximum value at SF = 0.5 × 105 cm·s−1 and then decreases very slightly.
A part the open circuit operating area, the behavior of the power-SF curve matches fairly with works presented in [4]. In our work, the open circuit zone is very brief. In early works done with other models, columnar cubic grain and 1D orientations, the open circuit zone is noted when SF varies from 0 to 103 cm·s−1.
con-DOI: 10.4236/sgre.2018.93004 48 Smart Grid and Renewable Energy
sidering the solar cell in open circuit operating condition as a voltage generator. On the other hand, our model could be used to determine the shunt (Rsh) of the
solar cell. It can be also applied using characterization methods to determine the real back-side surface recombination (Sb) [21] and the effective diffusion length (Leff) [22]. These techniques are valid in short-circuit open circuit operating
condition.
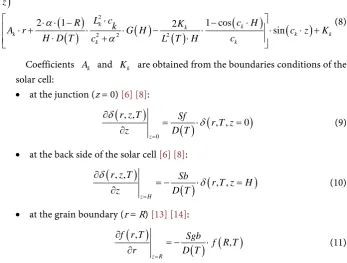
[image:6.595.210.539.217.437.2]The current-voltage (I-V) and power-voltage (P-V) characteristic curve are presented in Figure 3 and Figure 4 for various solar cell’s temperature values taking: 298 K, 310 K, 320 K and 330 K.
Figure 2. Power of the illuminated solar cell by the front surface versus SF with different temperatures (T).
[image:6.595.211.536.484.704.2]DOI: 10.4236/sgre.2018.93004 49 Smart Grid and Renewable Energy Figure 4. Power-Photovoltage (P-V) characteristics at different temperatures.
It is noted in Figure 3 that, with the temperature increasing, the short-circuit photocurrent (Isc) and the photo voltage (Voc) increases and decreases,
respec-tively as shown in [23].
Figure 4 shows that, the Power-Photovoltage (P-V) characteristics curve at different temperatures has the same behavior as the one found in [6] and can be used to determine the maximum solar cell power [6] and the “knee” of characte-ristic I-V curve as shown in [6].
The temperature dependence of the performance parameters of polycrystal-line silicon solar cell is considered. We presented the open circuit photovoltage (Voc), the fill factor (FF) and the short circuit photocurrent (Icc) variations with
the cell temperature in Figures 5-7, respectively.
In Figure 5 and Figure 6, we presented Voc-T, Icc-T and FF-T for various
grain boundary recombination velocity (Sgb) and various radius (R), respective-ly. Figure 7 and Figure 8 present the FF-T and η-T curves, respectively, for var-ious grain radius (R).
We notice in Figures 5-7, that the open circuit voltage is observed to decrease slightly with cell temperature and Sgb. But fill factor decreases very softly with cell temperature and increases when the radius (R) increases while the short-circuit current is found to increase with cell temperature [24].
It is obvious that the solar cell temperature plays a key role in the solar cell performance as shown in [23]. This is explained by the fact that, solar cell tem-perature variation affects the bandgap (Eg), the reverse saturation current (I0),
the ideality factor (n), the parasitic resistance which are the shunt (Rsh) and the
series resistance (Rs). Indeed, it is shown that [9], the higher the bandgap, the
DOI: 10.4236/sgre.2018.93004 50 Smart Grid and Renewable Energy Figure 5. Open circuit photovoltage (Voc) versus temperature for various grain boundary recombination velocity (Sgb).
Figure 6. Short circuit photocurrent (Isc) versus temperature for various solar cell grain radius (R).
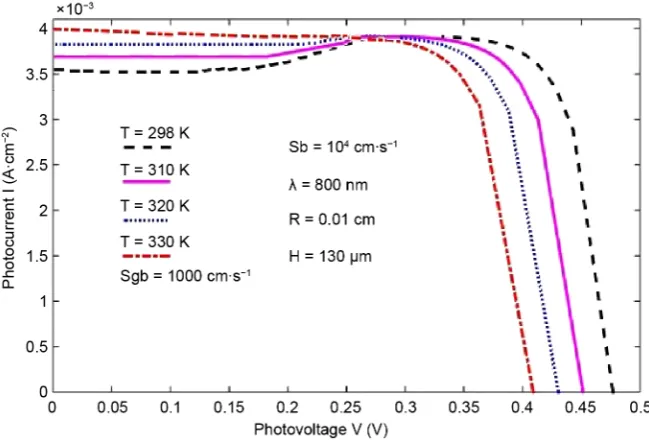
[image:8.595.209.536.504.707.2]DOI: 10.4236/sgre.2018.93004 51 Smart Grid and Renewable Energy Figure 8. Solar cell efficiency (η) versus temperature (K) for various radius (R).
which corresponds to recombination in neutral regions, increases with increas-ing temperature whereas it decreases with increasincreas-ing bandgap. I0 is the most
heavily affected parameter when the temperature varies [12].
The decrease in bandgap with increasing temperature, observed on several semi-conductors, results in an increase of the reverse saturation current. These decrease due to additional thermally generated electrons in the conductivity band and the holes in the valence band; which leads to lower open-circuit oper-ating point (Voc).
Some authors have also shown that, increasing the solar cell temperature in-creases the intrinsic concentration, ni and decreases the contact potential
differ-ence (ddp). As, the open circuit voltage (Voc) is proportional to the ddp, it
de-creases as shown in [25].
The short-circuit current (Isc) is proportional to the number of generated
charge carriers and mobility as well as it depends strongly on the generation rate and the diffusion length. The diffusion length depends on the product of the carrier lifetime and excess minority carrier mobility which is more sensitive to the temperature variation. The excess minority carrier mobility which deter-mines diffusion length evolution with the temperature is linked to the lattice scattering, ionized acceptor and donor impurities scattering and electron-hole scattering. Hence the total excess minority carriers mobility is determined con-sidering the minority electron mobility limited by lattice, acceptor, donor and hole. But it is shown [23] that for our considered solar cell, due to the predo-minance of the lattice scattering mechanism, the excess minority carriers mobil-ity limited by lattice (μL) decreases very sharply with temperature leading both
DOI: 10.4236/sgre.2018.93004 52 Smart Grid and Renewable Energy
A similar behavior of our result is also observed in earlier reported work of other researchers for silicon solar cells [12] [27] [28] [29] [30] [31] where the model cubic columnar is used in these works and the similarity of the results feels to the level of the reduction of voltage and the power and an increase of current of the solar cell’s when the value of the temperature is increased.
By plotting the FF-T and η-T curves, we remarked that the Fill Factor (FF) and efficiency (η) decrease with the increase of the temperature as shown in [12]
due to change in corresponding open circuit voltage and short circuit current. The FF-T is also observed to decrease in parallel combination which may be due to increase in the resistive loss and the η-T is strongly affected by the tempera-ture in accordance to the nominal operative cell temperatempera-ture and the typical op-erating temperature for solar cells is about 330 K which also depends on manu-facturer specifications. A significant efficiency loss is observed with increasing cell temperature over the nominal operative cell temperature range which re-vealed the linear power loss with the temperature. The decrease of these two pa-rameters is mainly controlled by the decrease of Voc and the increase of the Isc.
The increase of Isc with solar cell temperature does not affect much to FF and η
due to high variation of I0 with temperature with over 270% increase from T =
25˚C to 70˚C as shown by [11]. Although, M. Shravanth Vasisht et al.[11] re-ported in an early work that the solar cell temperature and ambient temperature majorly influence the Performance Ratio (PR) when they studied a 20 kWp solar Photovoltaic system seted up on the library roof-top in Indian Institute of Science, Bangalore, India. They also showed that η(63˚) < η(46˚) < ηi(STC) with
η the efficiency of the SPV and STC, the standard test condition.
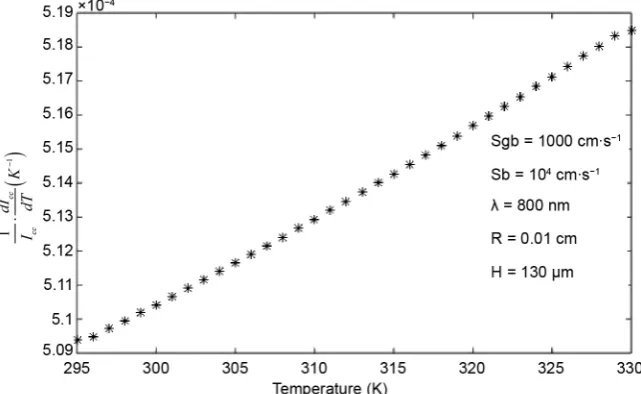
[image:10.595.213.534.508.705.2]We plotted in Figures 9-11 the temperature coefficient (T-coefficients) of short circuit photocurrent, open circuit photovoltage and efficiency versus tem-perature, respectively. Indeed, Figure 9 showed that the temperature coefficient of short-circuit photocurrent increases with the temperature of the solar cell
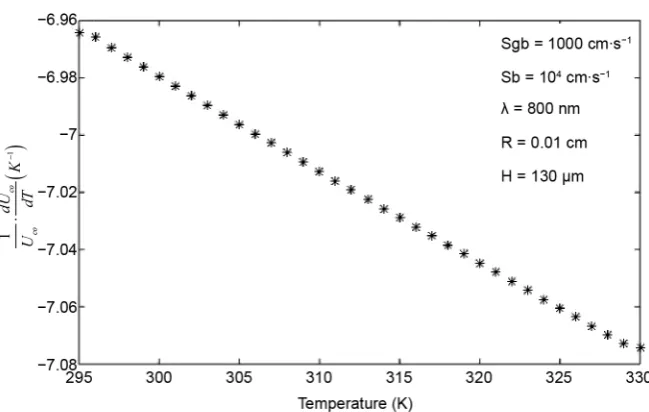
DOI: 10.4236/sgre.2018.93004 53 Smart Grid and Renewable Energy Figure 10. Temperature coefficient of open circuit photovoltage versus temperature.
Figure 11. Temperature coefficient of efficiency versus temperature.
whereas in Figure 10 and Figure 11, the coefficients of open circuit photovol-tage and efficiency decrease with the increase of the temperature of the solar cell. The coefficients of open circuit photovoltage and efficiency are negatives and can be increased by raising Uoc, which will decrease the temperature sensitivity
of the solar cell. This means that decreasing the recombination currents in the bulk and on the surfaces of the cell greatly improves the temperature coefficient of open circuit photovoltage [32].
4. Conclusion
DOI: 10.4236/sgre.2018.93004 54 Smart Grid and Renewable Energy
the open circuit photovoltage, the fill factor, the efficiency and the T-coefficients are linearly dependent on the temperature. The increase of the temperature en-tails a reduction of tension and a light growth of the current and thereafter, a relative decrease of the maximal power. Therefore, temperature influences nega-tively on the output of production of the solar cells.
References
[1] Smets, A., Jäger, K., Isabella, O., Swaaj, R.V. and Zeman, M. (2016) Solar Energy: The Physics and Engineering of Photovoltaic Conversion Technologies and Sys-tems. UIT Cambridge Ltd., England.
[2] Green, M.A., Emery, K., Hishikawa, Y., Warta, W. and Dunlop, E.D. (2010) Solar Cell Efficiency Tables (Version 45). Progress in Photovoltaics: Research and Appli-cations. Progress in Photovoltaics, 23, 1-9. https://doi.org/10.1002/pip.2573
[3] Chander, S., Purohit, A., Sharma, Nehra, S.P. and Dhaka, M.S. (2015) Impact of Temperature on Performance of Series and Parallel Connected Mono-Crystalline Silicon Solar Cells. Energy Reports, 1, 175-180.
https://doi.org/10.1016/j.egyr.2015.09.001
[4] Dieye, M., Mbodji, S., Zoungrana, M., Zerbo, I., Dieng, B. and Sissoko, G. (2015) A 3D Modelling of Solar Cell’s Electric Power under Real Operating Point. World Journal of Condensed Matter Physics, 5, 275-283.
https://doi.org/10.4236/wjcmp.2015.54028
[5] Mbodji, S., Zoungrana, M., Zerbo, I., Dieng, B. and Sissoko, G. (2015) Modelling Study of Magnetic Field’s Effects on Solar Cell’s Transient Decay. World Journal of Condensed Matter Physics, 5, 284-293. https://doi.org/10.4236/wjcmp.2015.54029
[6] Mbodji, S. and Sissoko, G. (2011) A Method to Determine the Solar Cell Resistances from Single I-V Characteristic Curve Considering the Junction Recombination Ve-locity (Sf). International Journal of. Pure Applied Science Technology, 6, 103-114. [7] Mbodji, S., Mbow, B., Zerbo, I. and Sissoko, G. (2012) Analysis of the Diffusion
Capacitance’s Efficiency of the Bifacial Silicon Solar Cell in Steady State Operating Condition. Research Journal of Applied Sciences, Engineering and Technology, 4, 282-288.
[8] Mbodji, S., Mbow, B., Barro, F.I. and Sissoko, G. (2011) A 3D Model for Thickness and Diffusion Capacitance of Emitter-Base Junction Determination in a Bifacial Polycrystalline Solar Cell under Real Operating Condition. Turkish journal of physics, 15, 281-291.
[9] Singh, P. and Ravindra, N.M. (2012) Temperature Dependence of Solar Cell Per-formance: An Analysis. Solar Energy Materials & Solar Cells, 101, 36-45.
https://doi.org/10.1016/j.solmat.2012.02.019
[10] Miloudi, L., Acheli, D. and Chaib, A. (2013) Solar Tracking with Photovoltaic Panel.
Energy Procedia, 42, 103-112. https://doi.org/10.1016/j.egypro.2013.11.010
[11] Vasisht, M.S., Srinivasan, J. and Ramasesha, S.K. (2016) Performance of Solar Pho-tovoltaic Installations: Effect of Seasonal Variations. Solar Energy, 131, 39-46.
https://doi.org/10.1016/j.solener.2016.02.013
[12] Ghani, F., Rosengarten, G., Duke, M. and Carson, J.K. (2015) On the Influence of Temperature on Crystalline Silicon Solar Cell Characterisation Parameters. Solar Energy, 112, 437-445. https://doi.org/10.1016/j.solener.2014.12.018
DOI: 10.4236/sgre.2018.93004 55 Smart Grid and Renewable Energy Junction Solar Cell with Columnar Cylindrical Grain. Revue des Energies Renouve-lables, 12, 279-297.
[14] Elnahwy, S. and Adeeb, N. (1988) Exact Analysis of a Three-Dimensional Cylin-drical Model for a Polycrystalline Solar Cell. Journal of Applied Physics, 64, 5214-5219. https://doi.org/10.1063/1.342435
[15] Leye, S.N., Diouf, A., Diao, A., Mbodji, S. and Sissoko, G. (2017) Temperature Ef-fect on the Capacitance of the Bifacial Solar Cell Considering the Columnar Cylin-drical Orientation. 33eConférence Européenne sur l’énergie solaire (EU PVSEC 2017), Amsterdam, 25-29 September 2017, 78-81.
[16] Kunst, M. and Sanders, A. (1992) Transport of Excess Carriers in Silicon Wafers.
Semiconductor Science and Technology, 7, 51-59.
https://doi.org/10.1088/0268-1242/7/1/009
[17] Mbodji, S., Dieng, M., Mbow, B., Barro, F.I. and Sissoko, G. (2010) Three Dimen-sional Simulated Modelling of Diffusion Capacitance of Polycrystalline Bifacial Sil-icon Solar Cell. Journal of Applied Science and Technology (JAST), 15, 109-114.
https://doi.org/10.4314/jast.v15i1-2.54834
[18] Green, M.A. and Keevers, M. (1995) Optical Properties of Intrinsic Silicon at 300 K.
Progress in Photovoltaics, 3, 189-192. https://doi.org/10.1002/pip.4670030303
[19] Dugas, J. (1994) 3D Modelling of a Reverse Cell Made with Improved Multicrystal-line Silicon Wafers. Solar Energy Materials and Solar Cells, 32, 71-88.
https://doi.org/10.1016/0927-0248(94)90257-7
[20] Mbodji, S., Maiga, A.S., Dieng, M., Wereme, A. and Sissoko, G. (2009) Renoval Charge Technic Applied to a Bifacial Solar Cell under Constant Magnetic Field.
Global Journal of Pure and Applied Sciences, 15, 125-132.
https://doi.org/10.4314/gjpas.v15i1.44909
[21] Lilonga-Boyenga, N.D. and Sissoko, G. (2014) Illumination Level Effects on Micro-scopic and MacroMicro-scopic Parameters of a Bifacial Solar Cell. Energy and Power En-gineering, 6, 25-36. https://doi.org/10.4236/epe.2014.63004
[22] Ly, I., Ndiaye, M., Wade, M., Thiam, N., Gueye, S. and Sissoko, G. (2013) Concept of Recombination Velocity Sfcc at the Junction of a Bifacial Silicon Solar Cell, in Steady State, Initiating the Short-Circuit Condition. Research Journal of Applied Sciences, Engineering and Technology, 5, 203-208.
https://doi.org/10.19026/rjaset.5.5105
[23] Xiao, C., Yu, X., Yang, D. and Que, D. (2014) Impact of Solar Irradiance Intensity and Temperature on the Performance of Compensated Crystalline Silicon Solar Cells. Solar Energy Materials and Solar Cells, 128, 427-434.
https://doi.org/10.1016/j.solmat.2014.06.018
[24] Zondag, H.A. (2008) Flat-Plate PV-Thermal Collectors and Systems: A Review. Re-newable Sustainable Energy Reviews, 12, 891-959.
https://doi.org/10.1016/j.rser.2005.12.012
[25] Cai, W., Chao, F., Long, T.J., Xiong, L.D., Fu, H.S. and Gang, X.Z. (2012) The In-fluence of Environment Temperatures on Single Crystalline and Polycrystalline Sil-icon Solar Cell Performance. Science China Physics, Mechanics and Astronomy, 55, 235-241. https://doi.org/10.1007/s11433-011-4619-z
[26] Chander, S., Purohit, A., Sharma, A., Arvind, Nehra, S.P. and Dhaka, M.S. (2015) A Study on the Photovoltaic Parameters of Mono-Crystalline Silicon Solar Cell with Cell Temperature. Energy Reports, 1, 104-109.
https://doi.org/10.1016/j.egyr.2015.03.004
DOI: 10.4236/sgre.2018.93004 56 Smart Grid and Renewable Energy Silicon Solar Cell for Use in Concentrated Sunlight. IEEE Transactions on Electron Devices, 24, 337-342. https://doi.org/10.1109/T-ED.1977.18738
[28] Saran, A., Prasad, B., Chandril, S., Singh, S.P., Saxena, A.K., Pathak, M., Chahar, N. and Bhattacharya, S. (2013) Study of Temperature on Performance of c-Si Homo-junction and a-Si/c-Si HeteroHomo-junction Solar Cells. International Journal of Renewa-ble Energy Research, 3, 707-710.
[29] Arora, N.D. and Hauser, J.R. (1982) Temperature Dependence of Silicon Solar Cell Characteristics. Solar Energy Materials, 6, 151-158.
https://doi.org/10.1016/0165-1633(82)90016-8
[30] Emery, K. and Osterwald, C. (1987) Measurement of Photovoltaic Device Current as a Function of Voltage, Temperature, Intensity and Spectrum. Solar Cells, 21, 313-327. https://doi.org/10.1016/0379-6787(87)90130-X
[31] Tsuno, Y., Hishikawa, Y. and Kurokawa, K. (2005) Temperature and Irradiance Dependence of the I-V Curves of Various Kinds of Solar Cells. 15th International Photovoltaic Science & Engineering Conference, Shanghai, October 2005, 422-423. [32] Berthod, C., Strandberg, R., Yordanov, G.H., Beyer, H.G. and Odden, J.O. (2015)