Application of response surface methodology to the
modeling of cellulase purification by solvent extraction
Jagdish Singh*, Anamika Sharma
Department of Biotechnology, Mata Gujri College, Fatehgarh Sahib, India Email:*[email protected]
Received 12 May 2012; revised 27 June 2012; accepted 1 July 2012
ABSTRACT
Central composite design (CCD)concerning the puri- fication of cellulase from the Bacillus sp. JS14 in a
solvent extraction was established with Response sur- face methodology (RSM). Solvent concentration, pH,
temperature and retention time were selected as pro- cess variables to evaluate the purification impact fac-tor in solvent precipitation, including the purification fold and % recovery. An experimental space with 13 purification fold and 23 recovery percentage recovery is achieved through the optimized condition based on the model. The molecular weight of the purified en-zyme was estimated to be 32.5 KDa. Optimum activ-ity of purified enzyme was at pH and temperature 6.5˚C and 40˚C respectively. Enzyme showed maxi-mum activity with carboxymethyl cellulose as sub-strate with compare to rice husk, wheat straw and sucrose. The purified cellulase activity was inhibited by Na+, Cl–, Mg2+ Tween 80 and EDTA.
Keywords:Cellulase; Purification; Solvent Extraction; Response Surface Methodology
1. INTRODUCTION
Cellulosic material is the most abundant renewable car- bon source in the world [1,2]. Cellulose is possible sub- stitutes for diminishing fossil energy resources and be- coming increasingly important. With the shortage of pe- troleum fuels and air pollution due to the incomplete combustion of fossil fuel, there has been increasing worldwide interest in the production of bioethanol from lignocellulosic biomass. To utilize these materials and to avoid waste pollution, one of the most important ap- proaches is to find appropriate cellulase enzyme to hy- drolyze the lignocellulosic biomass to produce glucose, which is used for the production of ethanol, organic acids etc. Cellulase (E.C 3.2.1.4) refers to a class of enzymes that catalyze the hydrolysis of 1,4 β-D glycosidic link- ages in cellulose are mainly produced by fungi, bacteria
and protozoans [3] and have broad range of applications especially in animal feed, textile, waste water treatment, brewing and wine-making [4-7]. An important obstruc- tion in the exploitation of cellulase is expensive purifica- tion effecting the overall cost of hydrolysis [8-11].
The problems in the purification of enzyme are an im- penetrability in the development of economically feasi- ble bioprocess. Impact of combinatorial interactions of different parameters for the solvent extraction of desired compound is abundant. Response surface methodology (RSM), which is a collection of statistical techniques for designing experiments, building models, evaluating the effects of factors and searching for the optimum condi- tions, has successfully been used in the optimization of bioprocesses [12-14]. To illuminate the relationship among the recovery percentage and solvent concentration a sta- tistical model is established by response surface metho- dology and validated with experimental data in this re- search paper. The present communication illustrate effi- ciency of statistical techniques for designing solvents extraction system for the purification of cellulase enzyme from the fermented broth with respect to the costly chromatography reliant purification matrixes. The results revealed the development of a practical criterion for sol- vent extraction of enzyme
2. MATERIALS AND METHODS
2.1. Microorganism and Enzyme Production The Bacillus sp. JS14, isolated from soil in laboratory, was cultured in a medium containing (g/l) KH2PO4, 0.1;
MgSO4·7H2O, 0.2; CMC, 10.0; Yeast extract, 1.0; Pep-
tone, 1.0; Na2HPO4, 2.5; (NH4)2SO4, 1.0; pH 7.0. The
culture was kept at agitation speed of 150 rpm and 37˚C. The supernatant was harvested after 36 h cultivation by centrifugation at 10000 g for 20 min and stored at 4˚C for further use.
tral composite design (CCD) and a second-order poly- nomial equation was employed to identify the relation- ship between four significant variables that influence cel- lulase extraction significantly. The central values (zero level) chosen for experimental design were; acetone (X1),
50%; pH (X2), 5.5; Temperatures, (X3) 17˚C and incuba-
tion Time (X4) 6.5 h in CCD I (Table 1). Different com-
bination of variables was used according to the CCD design I (Table 2) for the determination of purification fold and % recovery.
Enzyme purification achieved by acetone was further extracted with ethanol solvent according to the CCD design II (Tables 1 and 2) .The Design expert 8.0.1 soft- ware, was used for regression and graphical analyses. The optimal concentrations of critical solvents were ob- tained by ridge analysis and contour plots. The statistical analysis of the model was performed in the form of analysis of variance (ANOVA) for the determination of significant variables.
2.3. Validation of Model
The optimized conditions generated during response sur- face methodology implementation were validated by con- ducting extraction experiment on given optimal setting conditions. Study was carried out in triplicate to confirm the results.
2.4. Cellulase Assay and Protein Determination The cellulase (CMCase) activity was assayed according to Stewart and Leatherwood (1976). Appropriately en- zyme solution (0.5 ml) was added to 0.5 ml CMC (0.5% CMC dissolved in sodium acetate buffer 0.2 M, pH 5.0) and incubated at 60˚C for 30 minutes. The reaction was stopped by the addition of 3.0 ml of 3,5-dinitrosalicylic acid reagent [15] and A540 was measured in a Shimadzu
UV-160A spectrophotometer. One international unit (IU) of enzyme activity was defined as the amount of enzyme that catalyzed the liberation of reducing sugar equivalent to 1.0 µM glucose min−1 under assay conditions. The pro-
tein concentration of the crude and purified enzyme frac- tions was determined by the method of Lowry et al., [16] using bovine serum albumin (BSA) as standard.
2.5. SDS-PAGE
SDS-polyacrylamide gel electrophoresis (SDS-PAGE) was performed on 12.5% (w/v) acrylamide slab gel with 25 mM Tris for the determination of molecular weight, as described by Laemmli [17].
2.6. Optimum Temperature, pH and Thermal Stability of Purified Cellulase
Optimum temperature for activity enzyme was deter- mined by carrying out cellulose hydrolysis at various temperatures i.e. 20˚C, 30˚C, 40˚C, 50˚C and 60˚C. In each case, the substrate was preincubated at the required temperature before the addition of enzyme. The optimum pH was determined by monitoring cellulase activity at pH values 4.0, 5.0, 6.0, 6.5, 7.0 and 8.0 using different buffers.
2.7. Determination of Kinetic Parameters
Enzyme was incubated with various concentrations of carboxy methyl cellulose (0.05%, 0.1%, 0.2%, 0.5% and 1.0%) at pH 6.5 and temperature 40˚C. Kinetic parame- ters Km and Vmax were calculated by linear regression
from Line weaver Burk plot [18]. The substrate specifi- city of enzyme was tested for CMC, rice husk, wheat straw and sucrose. Chemical factors NaCl, MgSO4, Tween
[image:2.595.56.544.546.735.2]20 and EDTA at 5 mM final concentration was used to
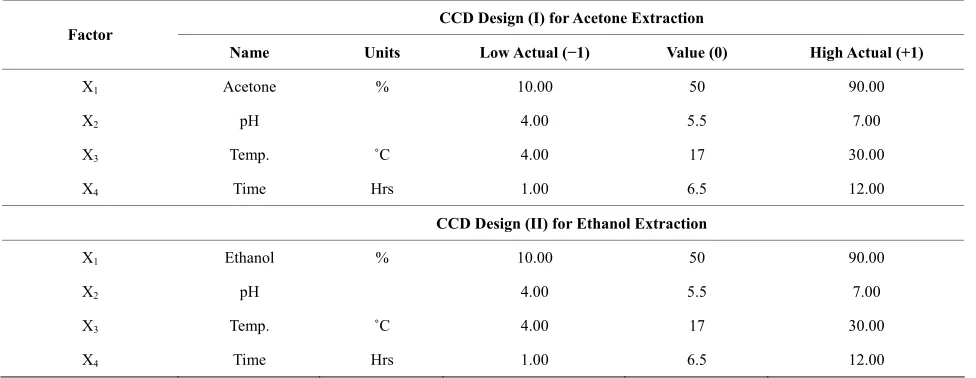
Table 1. Different parameters for purification using Response Surface Methodology.
CCD Design (I) for Acetone Extraction Factor
Name Units Low Actual (−1) Value (0) High Actual (+1)
X1 Acetone % 10.00 50 90.00
X2 pH 4.00 5.5 7.00
X3 Temp. ˚C 4.00 17 30.00
X4 Time Hrs 1.00 6.5 12.00
CCD Design (II) for Ethanol Extraction
X1 Ethanol % 10.00 50 90.00
X2 pH 4.00 5.5 7.00
X3 Temp. ˚C 4.00 17 30.00
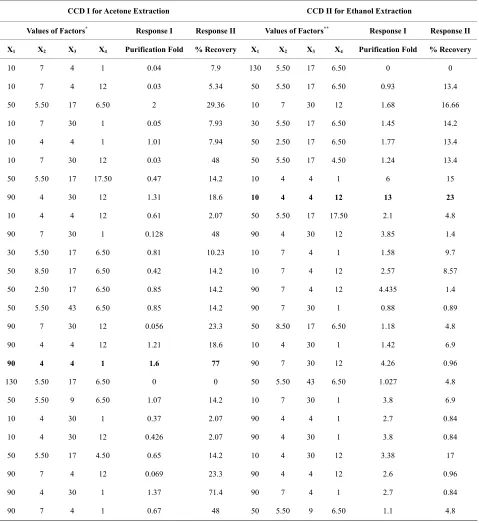
Table 2.A central composite design (CCD) for extraction of cellulase using Response surface methodology by acetone and ethanol solvents.
CCD I for Acetone Extraction CCD II for Ethanol Extraction
Values of Factors* Response I Response II Values of Factors** Response I Response II
X1 X2 X3 X4 Purification Fold % Recovery X1 X2 X3 X4 Purification Fold % Recovery
10 7 4 1 0.04 7.9 130 5.50 17 6.50 0 0
10 7 4 12 0.03 5.34 50 5.50 17 6.50 0.93 13.4
50 5.50 17 6.50 2 29.36 10 7 30 12 1.68 16.66
10 7 30 1 0.05 7.93 30 5.50 17 6.50 1.45 14.2
10 4 4 1 1.01 7.94 50 2.50 17 6.50 1.77 13.4
10 7 30 12 0.03 48 50 5.50 17 4.50 1.24 13.4
50 5.50 17 17.50 0.47 14.2 10 4 4 1 6 15
90 4 30 12 1.31 18.6 10 4 4 12 13 23
10 4 4 12 0.61 2.07 50 5.50 17 17.50 2.1 4.8
90 7 30 1 0.128 48 90 4 30 12 3.85 1.4
30 5.50 17 6.50 0.81 10.23 10 7 4 1 1.58 9.7
50 8.50 17 6.50 0.42 14.2 10 7 4 12 2.57 8.57
50 2.50 17 6.50 0.85 14.2 90 7 4 12 4.435 1.4
50 5.50 43 6.50 0.85 14.2 90 7 30 1 0.88 0.89
90 7 30 12 0.056 23.3 50 8.50 17 6.50 1.18 4.8
90 4 4 12 1.21 18.6 10 4 30 1 1.42 6.9
90 4 4 1 1.6 77 90 7 30 12 4.26 0.96
130 5.50 17 6.50 0 0 50 5.50 43 6.50 1.027 4.8
50 5.50 9 6.50 1.07 14.2 10 7 30 1 3.8 6.9
10 4 30 1 0.37 2.07 90 4 4 1 2.7 0.84
10 4 30 12 0.426 2.07 90 4 30 1 3.8 0.84
50 5.50 17 4.50 0.65 14.2 10 4 30 12 3.38 17
90 7 4 12 0.069 23.3 90 4 4 12 2.6 0.96
90 4 30 1 1.37 71.4 90 7 4 1 2.7 0.84
90 7 4 1 0.67 48 50 5.50 9 6.50 1.1 4.8
*X
1 (Acetone), X2 (pH), X3 (temperature), X4 (retention time); **X1 (Ethanol), X2 (pH), X3 (temperature), X4 (retention time).
verify the rate of enzyme activation and inhibition.
3. RESULTS AND DISCUSSION
3.1. Response Surface Experimental Design Optimum levels of the key factors and their effect of
interactions were determined by central composite de- sign of RSM. Purification fold and % recovery of 1.7 and 77 respectively was achieved with optimum parameters
i.e.; acetone (X1) 90%, pH (X2) 4, temperature (X3) 4˚C
and incubation period (X4) 1 h. (Table 2). Regression
level of response as a function of three independent variables. A quardratic model was attempted to fit the data by least squares and all terms regard less of their significance were included in the following equation:
1 2
4 1 2 1
1 4 2 3 2 4
2 2
3 4 1 2
y 284.09494 37.31286X 225.23766X 43.47243X
790.58161X 28.95995X X 0.043204X X
0.28792X X 64.21602X X 0.011021X X
1.14198X X 2.47136X 261.78389X
3
3
(1) where y is the measured response, and X1, X2, X3 and X4
are coded independent variables.
After the purification with the acetone another solvent ethanol was used for the extraction of cellulase by central composite design with QuadraticDesign to determine the optimum levels of variables. Purification fold and % re- covery of 13 and 23 respectively was achieved with the conditions having ethanol (X1) 10%, pH (X2) 4, tem-
perature (X3) 4˚C and retention time (X4,) 12 h. Regres-
sion analysis was performed to fit the response function with the experimental data. The statistical significance of the second order model equation was checked by an F-test (ANOVA) and the data are shown in Table 3. The regression model for cellulase production was highly significant with a satisfactory value of determination. The Model F-value implied the model is significant.
There is only a 0.01% chance that a “Model F-Value” this large could occur due to noise. Values of “Prob > F” less than 0.0500 indicated that the model terms were significant. The “Pred R-Squared” was as close to the “Adj R-Squared” as one might normally expect. “Adeq Precision” value measures the signal to noise ratio and greater than 4 is desirable as an adequate signal. These facts indicated that the model equation as expressed in
Eq.1 provided a suitable model to describe the response of the experiment pertaining to percentage recovery. It can be noticed from the degree of significance (Table 4) that the regression coefficients of linear and quadratic coefficients of X1, X2 and X3 were significant at 1% level
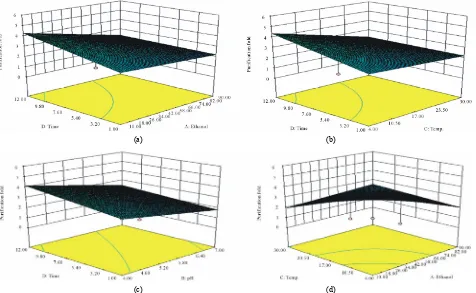
This model can be used to navigate the design space. The 3D contours response surface graph based on dependent variables are shown in Figures 1-4. The canonical analy- sis revealed a effects of variables for maximum purifica-tion fold and percentage recovery.
3.2. Model Application
The purification fold and percentage recovery of 13 and 23 respectively (16.7 IU·mg−1 protein) (Table 5) was
achieved with the conditions having ethanol (X1) 10%,
pH (X2) 4, temperature (X3) 4˚C and retention time (X4),
[image:4.595.57.538.435.733.2]12 h with the CCD experimental results of cellulase puri- fication. Established model is satisfactory and confirms
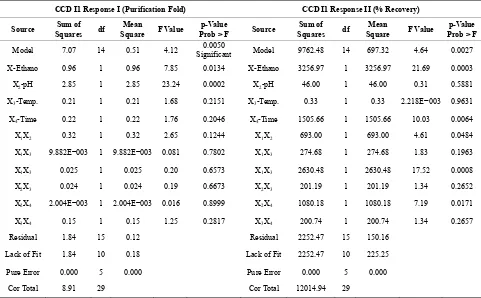
Table 3. ANOVA results for cellulase purification obtained from ethanol extraction.
CCD I1 Response I (Purification Fold) CCD I1 Response II (% Recovery)
Source SquaresSum of df SquareMean F Value Prob > Fp-Value Source SquaresSum of df SquareMean F Value Prob > Fp-Value
Model 7.07 14 0.51 4.12 Significant 0.0050 Model 9762.48 14 697.32 4.64 0.0027
X-Ethano 0.96 1 0.96 7.85 0.0134 X-Ethano 3256.97 1 3256.97 21.69 0.0003 X2-pH 2.85 1 2.85 23.24 0.0002 X2-pH 46.00 1 46.00 0.31 0.5881
X3-Temp. 0.21 1 0.21 1.68 0.2151 X3-Temp. 0.33 1 0.33 2.218E−003 0.9631
X4-Time 0.22 1 0.22 1.76 0.2046 X4-Time 1505.66 1 1505.66 10.03 0.0064
X1X2 0.32 1 0.32 2.65 0.1244 X1X2 693.00 1 693.00 4.61 0.0484
X1X3 9.882E−003 1 9.882E−003 0.081 0.7802 X1X3 274.68 1 274.68 1.83 0.1963
X1X3 0.025 1 0.025 0.20 0.6573 X1X3 2630.48 1 2630.48 17.52 0.0008
X2X3 0.024 1 0.024 0.19 0.6673 X2X3 201.19 1 201.19 1.34 0.2652
X2X4 2.004E−003 1 2.004E−003 0.016 0.8999 X2X4 1080.18 1 1080.18 7.19 0.0171
X3X4 0.15 1 0.15 1.25 0.2817 X3X4 200.74 1 200.74 1.34 0.2657
Residual 1.84 15 0.12 Residual 2252.47 15 150.16 Lack of Fit 1.84 10 0.18 Lack of Fit 2252.47 10 225.25
Table 4. ANOVA results for cellulase purification obtained from acetone extraction.
CCD 1 Response I (Purification Fold) CCD 1 Response II ( % Recovery)
Source SquaresSum of df SquareMean F Value Prob > Fp-Value Source SquaresSum of Df SquaresMean F Value Prob > Fp-Value
Model 7.51 14 0.54 4.47 significant0.0034 Model 9168.98 10 916.90 3.06 Significant0.0172
X1 0.10 1 0.10 0.84 0.3750 X1 2678.04 1 2678.04 8.95 0.0075
X2 2.05 1 2.05 4.47 0.0009 X2 12.15 1 12.15 0.041 0.8425
X3 0.066 1 0.066 0.55 0.4699 X3 213.14 1 213.14 0.71 0.4093
X4 0.059 1 0.059 0.49 0.4960 X4 1041.73 1 1041.73 3.48 0.0776
X1X2 0.16 1 0.16 1.35 0.2629 X1X2 1010.94 1 1010.94 3.38 0.0818
X1X3 0.041 1 0.041 0.34 0.5683 X1X3 0.27 1 0.27 8.868E−004 0.9766
X1X3 2.326E−004 1 2.326E−004 1.935E−003 0.9655 X1X3 3061.99 1 3061.99 10.23 0.0047
X2X3 4.523E−003 1 4.523E−003 0.038 0.8488 X2X3 11.90 1 11.90 0.040 0.8441
X2X4 0.002 1 0.022 0.18 0.6740 X2X4 1126.93 1 1126.93 3.76 0.0673
X3X4 0.025 1 0.025 0.20 0.6576 X3X4 11.90 1 11.90 0.040 0.8441
Residual 1.80 15 0.12 Residual 5688.07 19 299.37
Lack of Fit 1.80 10 0.18 2703.51 Significant0.0001 Lack of Fit 5688.07 14 406.29
Pure Error 3.333E−004 5 6.667E−005 Pure Error 0.000 5 0.000 Cor Total 9.32 9 Cor Total 14857.05 29
(a) (b)
(c) (d)
[image:5.595.58.542.106.709.2](a) (b)
[image:6.595.59.537.85.374.2](c) (d)
Figure 2. Surface plot for the effect of: (a) pH and acetone; (b) Temp and acetone; (c) Time and acetone; and (d) Temp and pH on % recovery by acetone extraction.
(a) (b)
(c) (d)
[image:6.595.63.539.415.708.2](a) (b)
[image:7.595.62.536.84.367.2]
(c) (d)
Figure 4. Surface plot for the effect of: (a) Temp and pH; (b) Time and pH; (c) Time and temp; (d) Temp and ethanol conc. on % recovery by ethanol extraction.
Table 5. Over all purification of cellulase from Bacillus sp. JS14.
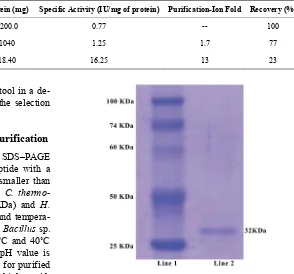
Methods Enzyme Activity (IU) Protein (mg) Specific Activity (IU/mg of protein) Purification-Ion Fold Recovery (%)
Culture Filtrate 1700 2200.0 0.77 -- 100
Acetone Precipitation 1300 1040 1.25 1.7 77
Ethanol Precipitation 299.9 18.40 16.25 13 23
response surface methodology a promising tool in a de- sign of complex process of purification in the selection of operating variables.
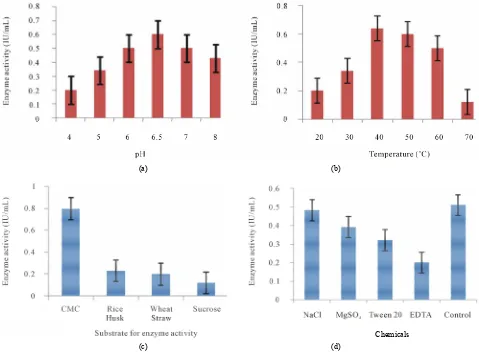
3.3. Cellulase Characterization after Purification Results of Electrophoresis of the enzyme on SDS–PAGE showed that enzyme consist single polypeptide with a molecular weight of 32.5 KDa (Figure 5) smaller than cellulase from C. thermophilum (41 KDa), C. thermo- philum (36 KDa), M. thermophila (100 KDa) and H. grisea (63 kDa) [19-23]. The optimum pH and tempera- ture for activity of the purified enzyme from Bacillus sp. J14 for standard assay conditions were 6.5˚C and 40˚C respectively (Figures 6(a) and (b)). This pH value is comparable to the optimum pH value of 7.0 for purified enzyme from Sinorhizobium fredii [14] and higher with respect to the optimum value of 5 for cellulase from
Trichoderma viride [24]. At 40˚C the cellulase was 98%
Figure 5. SDS-PAGE of purified cellulase from Bacillus JS14: Line 1 protein markers; Line 2: purified cellulase.
[image:7.595.237.531.427.701.2](a) (b)
[image:8.595.58.537.86.438.2]Chemicals (c) (d)
Figure 6. Effect of: (a) pH; (b) Temperature; (c) Substrates; and (d) Chemicals factors on the activity of purified enzyme.
stable and sharp decrease in activity was observed above 40˚C. Kinetic studies of the purified cellulase illustrated that Vmax and Km for purified enzyme was 66 IU/mg and
2.5 mg·mL−1 respectively. Whereas V
max and Km for cel-
lulase was found to be 84 U/mg and 3.6 mg·mL−1 respec-
tively isolated from Bacteroides succinogene [25]. The Km is lower than the enzyme from the fungus M. thermo- phila (3 mg·mL−1) [23] and T. aurantiacus (3.9 mg·mL−1)
[26].
Purified enzyme illustrated highest activity with CMC as compare to rice husk, wheat straw and sucrose (Fig- ure 6(c)), whereas cellulase enzyme produced from Tri- choderma koningii reveal little ability to attack CMC as compare to cellotetraose and cellohexaose [27]. NaCl, MgSO4, Tween 20 and EDTA are inhibitors of the en-
zyme and decrease the activity 5.32%, 3.55%, 5.32% and 21.66% respectively with respect to control (Figure 6(d)).
4. CONCLUSION
Purification fold and recovery percentage of 13 and 23 respectively was achieved with solvent extraction pro-
cess chosen as optimum for cellulase purification by RSM. The molecular weight of the enzyme was esti- mated to be 32.5 KDa. The Km of the purified enzyme
for carboxy methyl cellulose, sodium salt (CMC), was 2.5 mg·mL−1 at pH and temperature 6.5˚C and 40˚C,
respectively. Enzyme exhibited maximum substrate spe- cificity for carboxymethyl cellulose with compare to rice husk, wheat straw and sucrose. The data obtained in this study will be used to shape the process for cellulase ex- traction for different aspects of higher purification yields.
REFERENCES
[1] Whitaker, J. (1990). Cellulase production and applications. Food Biotechnology, 4, 669-697.
doi:10.1080/08905439009549782
[2] Solomon, B., Amigun, B., Betiku, E., Ojumu, T. and La- yokun, S. (1997) Optimization of cellulase production by Aspergillus flavus linn isolate NSPRI101 grown on ba- gasse.Nigerian Society of Chemical Engineers, 16, 61-68. [3] Beguin, P. and Aubert, J. (1994) The biological degration
[4] Kaur, J., Chadha, B., Kumar, A. and Saini, H. (2007) Pu- rification and characterization of two endoglucanases from Melanocarpus sp. MTCC 3922.Bioresource Technology, 98, 74-81. doi:10.1016/j.biortech.2005.11.019
[5] Adsul, M., Bastawde, K., Varma, A. and Gokhale, D. (2007) Strain improvement of Penicillium janthinellum NCIM 1171 for increased cellulase production. Bioresource Tech- nology,98, 1467-1473.
doi:10.1016/j.biortech.2006.02.036
[6] Silva, C. and Roberto, C. (2001) Optimization of xylitol production by Candida guilliermondii FTI 20037 using response surface methodology. Process Biochemistry, 36, 1119-1124. doi:10.1016/S0032-9592(01)00153-4
[7] Bhat, M. (2000) Cellulases and related enzymes in bio- technology. Biotechnology Advances,18, 355-383. doi:10.1016/S0734-9750(00)00041-0
[8] Duff, S. and Murray, D. (1996) Bioconversion of forest products industry waste cellulosics to fuel ethanol: A re- view. Bioresource Technology, 55, 1-33.
doi:10.1016/S0734-9750(00)00041-0
[9] Nieves, R., Ehrman, C., Adney, W., Elander, R. and Him- mel, M. (1998) Technical communication: Survey and analysis of commercial cellulase preparations suitable for biomass conversion to ethanol. World Journal of Micro- biology and Biotechnology, 14, 301-304.
doi:10.1023/A:1008871205580
[10] Chahal, S., Chahal, D. and Andre, G. (1992) Cellulase production profile of Trichoderma reesei on different cel- lulosic substrates at various pH levels. Journal of Fer- mentation and Bioengineering,74, 126-128.
doi:10.1016/0922-338X(92)80015-B
[11] Reczey, K., Szengyel, R. and Zacchi, G. (1996) Cellulase production by T. reesei. Bioresource Technology, 57, 25- 30. doi:10.1016/0960-8524(96)00038-7
[12] Dey, R., Mitra, M. and Banerjee, B. (2001) Enhanced production of amylase by optimization of nutritional con- stituents using response surface methodology.Biochemi- cal Engineering Journal, 7, 227-231.
doi:10.1016/S1369-703X(00)00139-X
[13] Kristo, E., Biliaderis, C. and Tzanetakis, N. (2003) Mod- elling of the acidification process and rheological proper- ties of milk fermented with a yogurt starter culture using response surface methodology. Food Chemistry, 83, 437- 446. doi:10.1016/S0308-8146(03)00126-2
[14] Chen, F., Cai, T., Zhao, G., Liao, X., Guo, L. and Hu, X. (2005) Optimizing conditions for the purification of crude octacosanol extract from rice bran wax by molecular dis- tillation analyzed using response surface methodology. Journal of Food Engineering, 70, 47-53.
doi:10.1016/j.jfoodeng.2004.09.011
[15] Miller, G. (1959) Use of dinitrosalicylic acid regent for determination of reducing sugar. Analytical Chemistry,
31, 426-428. doi:10.1021/ac60147a030
[16] Lowry, O., Rosebrough, N., Farr, V. and Randall, R. (1951) Protein measurement with the Folin phenol reagent. The Journal of Biological Chemistry, 193, 265-275.
[17] Laemmli, U. (1970) Cleavage of structural proteins dur- ing the assembly of the head of becteriophage T4. Nature (London), 227, 680-685. doi:10.1038/227680a0
[18] Lineweaver, H. and Burk, D. (1934). The determination of enzyme dissociation constants. Journal of the Ameri- can Chemical Society,56, 658-666.
doi:10.1021/ja01318a036
[19] Eriksen, J. and Goksoyr, J. (1977) Cellulases from Chae- tomium thermophile var. dissitum. European Journal of Biochemistry, 77, 445-450.
doi:10.1111/j.1432-1033.1977.tb11685.x
[20] Ganju, R., Murthy, S. and Vithayathil, J. (1990) Purifica- tion and functional characteristics of a cellulase from Chae- tomium thermophile var. coprophile. Carbohydrate Re- search, 197, 245-255.
doi:10.1016/0008-6215(90)84147-M
[21] Hayashida, S. and Yoshioka, H. (1980) The role of car- bohydrate moiety on thermostability of cellulases from Humicola insolens YH-8. Agricultural Biology and Chem- istry, 44, 481-487. doi:10.1271/bbb1961.44.481
[22] Rao, U. and Murthy, S (1988) Purification and charac- terization of a glucosidase and cellulase from Humicola insolens. Indian Journal of Biochemistry & Biophysics, 25, 687-694.
[23] Roy, K., Dey, S., Raha S. and Chakrabarty, S. (1990) Pu- rification and properties of an extracellular endoglucanase from Myceliophthora thermophila D-14 (ATCC 48104). Journal of General Microbiology, 136, 1967-1971. doi:10.1099/00221287-136-10-1967
[24] Sharma S, Malik. A. and Satya, S. (2009) Application of response surface methodology (RSM) for optimization of nutrient supplementation for Cr (VI) removal by Asper- gillus lentulus AML05. Journal of Hazardous Materials, 164, 1198-1204. doi:10.1016/j.jhazmat.2008.09.030 [25] Gavin, M. and Forsberg, C.W. (1988) Isolation and char-
acterization of endoglucanases 1 and 2 from Bacteroides succinogenes S85.Journal of Bacteriology, 170, 2914-2922. [26] Tong, C., Cole, A. and Shephert, M. (1980) Purification
and properties of the cellulases from the thermophilic fungus Thermoascus aurantiacus. Biochemical Journal, 191, 83-94.