Automatic Classification of Heartbeats Using ECG
Morphology and Heartbeat Interval Features
Philip de Chazal*
, Member, IEEE
, Maria O’Dwyer, and Richard B. Reilly
, Senior Member, IEEE
Abstract—A method for the automatic processing of the electrocardiogram (ECG) for the classification of heartbeats is presented. The method allocates manually detected heartbeats to one of the five beat classes recommended by ANSI/AAMI EC57:1998 standard, i.e., normal beat, ventricular ectopic beat (VEB), supraventricular ectopic beat (SVEB), fusion of a normal and a VEB, or unknown beat type. Data was obtained from the 44 nonpacemaker recordings of the MIT-BIH arrhythmia database. The data was split into two datasets with each dataset containing approximately 50 000 beats from 22 recordings. The first dataset was used to select a classifier configuration from candidate configurations. Twelve configurations processing fea-ture sets derived from two ECG leads were compared. Feafea-ture sets were based on ECG morphology, heartbeat intervals, and RR-intervals. All configurations adopted a statistical classifier model utilizing supervised learning. The second dataset was used to provide an independent performance assessment of the selected configuration. This assessment resulted in a sensitivity of 75.9%, a positive predictivity of 38.5%, and a false positive rate of 4.7% for the SVEB class. For the VEB class, the sensitivity was 77.7%, the positive predictivity was 81.9%, and the false positive rate was 1.2%. These results are an improvement on previously reported results for automated heartbeat classification systems.
Index Terms—Electrocardiogram (ECG), heartbeat classifier, linear discriminant analysis, statistical classifier model.
I. INTRODUCTION
H
EART arrhythmias result from any disturbance in the rate, regularity, and site of origin or conduction of the cardiac electric impulse [1]. Broadly speaking, arrhythmias can be di-vided into two groups. The first group includes ventricular fib-rillation and tachycardia which are life-threatening and require immediate therapy with a defibrillator. Detection of these ar-rhythmias is well researched and successful detectors have been designed with high sensitivity and specificity [2]–[5].This study investigated the second group which includes ar-rhythmias that are not imminently life-threatening but may re-quire therapy to prevent further problems. The electrocardio-gram (ECG) is a low-cost, noninvasive, and effective test for
ar-Manuscript received April 25, 2003; revised August 26, 2003. This work was supported by the Informatics Research Initiative of Enterprise Ireland.Asterisk indicates corresponding author.
*P. de Chazal is with the Department of Electronic and Electrical En-gineering, University College Dublin, Belfield, Dublin 4, Ireland (e-mail: [email protected]).
M. O’Dwyer is with Silicon and Software Systems, Cork Business and Tech-nology Park, Model Farm Road, Cork, Ireland.
R. B. Reilly is with the Department of Electronic and Electrical Engi-neering, University College Dublin, Belfield, Dublin 4, Ireland (e-mail: [email protected]).
Digital Object Identifier 10.1109/TBME.2004.827359
rhythmia analysis and has become the standard diagnostic tool. Some arrhythmias appear infrequently and up to a week of ECG activity may need to be recorded using a Holter ECG mon-itor to successfully capture them. Many arrhythmias manifest as sequences of heartbeats with unusual timing or ECG mor-phology. An important step toward identifying an arrhythmia is the classification of heartbeats. The rhythm of the ECG signal can then be determined by knowing the classification of consec-utive heartbeats in the signal [6]. Classification of heartbeats can be very time-consuming and hence any automated processing of the ECG that assists this process would be of assistance and is the focus of this study.
Automated classification of heartbeats has been previously reported by other investigators (e.g., [7]–[12]) using a variety of features to represent the ECG and a number of classification methods. Features include ECG morphology [8], [9], heartbeat interval features [8]–[11], frequency-based features [7], higher order cumulant features [10], Karhunen–Loeve expansion of ECG morphology [11], and hermite polynomials [12]. Classi-fiers methods employed include linear discriminants [7], back propagation neural networks [8]–[10], self-organizing maps with learning vector quantization [11], and self-organizing networks [12].
Despite standards recommended for reporting performance results of cardiac rhythm algorithms by the Association for the Advancement of Medical Instrumentation (AAMI) [13], [14], only the work in [11] and [12] have utilized these standards. This makes it very difficult to assess the relative merits of the different algorithms. The AAMI standards are adopted in this study and our results have been compared to those of [11] and [12].
In [11], Huet al.customized a heartbeat classifier to a specific patient (known as a local classifier) and then combined it with a global classifier designed from a large database of ECG sig-nals. The two classifiers were then combined using a mixture of experts (MOE) approach. The local classifier requires a cardiol-ogist to annotate a segment of a patient-specific ECG in order to implement the MOE approach. The global classifier achieved an accuracy of 62.2% and the MOE classifier achieving 94.0% ac-curacy for distinguishing ventricular ectopic beats (VEB) from non-VEBs.
Lagerholmet al.[12] described a method for clustering ECG heartbeats from a recording into 25 clusters and determined that on average 98.5% of the heartbeats in any one cluster were from the same heartbeat class. This translates to a classification per-formance of 98.5% if an expert can correctly identify the dom-inant beat of a cluster.
TABLE I
MAPPING THEMIT-BIH ARRHYTHMIADATABASEHEARTBEATTYPES TO THEAAMI HEARTBEATCLASSES
TABLE II
HEARTBEATTYPESASSOCIATEDWITH THEEXTRACTEDBEATS FOR THEFULLDATABASE, DATASET1 (DS1)ANDDATASET2 (DS2) FROM THEMIT-BIH ARRHYTHMIADATABASE. HEARTBEATTYPE ANDCLASSABBREVIATIONSAREDEFINED INTABLEI
II. AIM
The aims of this study were first to examine the heartbeat clas-sification problem and, second, to design and test an automatic classification system using a comprehensive ECG database fol-lowing AAMI recommended practice [13]. Methodology im-provements on previous approaches included:
• trialing eight representations of the ECG morphology; • use of the five heartbeat classes recommended in [13]; • comparison of 12 classifier configurations processing
fea-tures obtained from single and multiple ECG leads; • weighting the training examples to prevent the large
classes from dominating the training process.
In Section III, the ECG database is discussed. Section IV presents the methodology adopted for this classification problem. Tests and experiments that were performed are also described in detail in this section. The results of the classifi-cation performance of different classifier configurations are presented in Section V. Section VI discusses the significant results and a comparison is made with previously published work. Some conclusions are drawn in Section VII.
III. ECG DATA
Data from the MIT-BIH arrhythmia database [15] were used in this study, which includes recordings of many common and life-threatening arrhythmias along with examples of normal sinus rhythm. The database contains 48 recordings, each con-taining two 30-min ECG lead signals (denoted lead A and B). In 45 recordings, lead A is modified-lead II and for the other three is lead V5. Lead B is lead V1 for 40 recordings and is either lead II, V2, V4, or V5 for the other recordings. Twenty-three of the recordings are intended to serve as a representative sample of routine clinical recordings and 25 recordings contain complex ventricular, junctional, and supraventricular arrhythmias [15].
The data are bandpass filtered at 0.1–100 Hz and sampled at 360 Hz. There are over 109 000 labeled ventricular beats from 15 different heartbeat types (Table I lists the heartbeat types). There is a large difference in the number of examples of the heartbeat types as shown in Table II. The largest class is “Normal beat” (NOR) with over 75 000 examples and the smallest class is “Supraventricular premature beat” (SP) with just two examples.
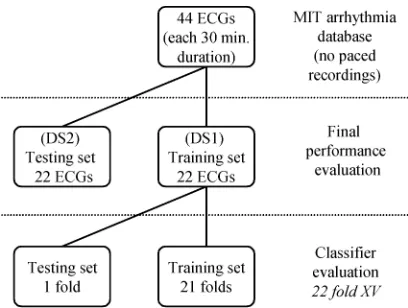
Fig. 1. Division of the MIT-BIH arrhythmia database into training and testing sets for classifier evaluation using the cross-validation scheme. Final performance evaluation is performed on an independent set.
the analysis. The remaining recordings were divided into two datasets with each dataset containing ECG data from 22 recordings with the same approximate proportion of beat types. Both datasets contain approximately 50 000 heartbeats and have a mixture of the routine and complex arrhythmia recordings. Table II shows the breakdown of each dataset by heartbeat type. The first dataset (DS1) was used to evaluate the performance of different candidate classifiers. The second dataset (DS2) was used for a final performance evaluation of the heartbeat classification system, as shown in Fig. 1.
The AAMI recommended practice was used to combine the MIT-BIH heartbeat types into five heartbeat classes which were used in all subsequent processing. Each class includes heartbeats of one or more types as shown in Table I. Class N contains beats originating in the sinus node (normal and bundle branch block beat types), class S contains supraventricular ec-topic beats (SVEBs), class V contain ventricular ecec-topic beats (VEBs), class F contains beats that result from fusing normal and VEBs, and class Q contains unknown beats including paced beats.
IV. METHODS FORAUTOMATEDHEARTBEATCLASSIFICATION
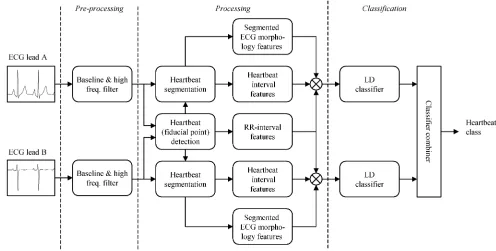
Fig. 2 depicts the stages of an automated system suitable for heartbeat classification which is based on the outcomes of this study. It consists of three stages: a preprocessing stage, a processing stage, and a classification stage. The digitized ECG is applied at the input to the preprocessing stage. The preprocessing stage utilizes a filtering unit to remove artifact signals from the ECG signal. These signals include baseline wander, power line interference, and high-frequency noise. The processing stage consists of heartbeat detection and feature extraction modules. The heartbeat detection module attempts to locate all heartbeats. The feature extraction module is concerned with forming a vector of measurements (feature vector) from each heartbeat that are processed by the classifier stage. The feature extraction modules are required because, although it is possible for the classification stage to process the ECG samples directly, greater classification performance is often achieved if a smaller number of discriminating features (than the number of ECG samples) are first extracted from the
ECG. The classification stage contains one or more classifier units which select one of the required classes in response to the input feature vector. The classifier units normally contain parameters which are set during the system development to optimize the classification performance. A combiner then unites the decisions of the classifier units to form the final decision of the system. The modules forming these stages are discussed in more detail below.
A. ECG Filtering
All ECG signals were filtered with two median filters to re-move the baseline wander. Each signal was processed with a median filter of 200-ms width to remove QRS complexes and P-waves. The resulting signal was then processed with a me-dian filter of 600 ms width to remove T-waves. The signal re-sulting from the second filter operation contained the baseline of the ECG signal, which was then subtracted from the orig-inal signal to produce the baseline corrected ECG signal. Un-wanted power-line and high-frequency noise was removed from the baseline corrected ECG with a 12-tap low-pass filter. The filter was a finite impulse response filter with equal ripple in the pass and stop bands. The 3-dB point of the filter was 35 Hz. The filtered ECG signals were used in all subsequent processing.
B. Heartbeat Detection
This study did not investigate the problem of heartbeat detec-tion from the ECG; instead we have utilized the heartbeat fidu-cial point times provided with the MIT-BIH arrhythmia data-base. The provided fiducial points occur at the instant of the major local extremum of a QRS-complex (i.e., either the time of the R-wave maximum or S-wave minimum). These fiducial points were first obtained automatically and then manually cor-rected on a beat-by-beat basis.
C. Heartbeat Segmentation
The ECG heartbeat segmentation program of Laguna et al.1 was used to provide estimates of heartbeat segmentation
points, i.e., the QRS onset and offset and T-wave offset times, a Boolean value indicating the presence/absence of a P-wave, and, if present, the P-wave onset and offset time for each heart-beat fiducial point. The program was applied separately to both ECG leads to form two sets of estimates of the segmentation points for each heartbeat.. The program has been validated on the Common Standards in Electrocardiography Multilead database [16] and the MIT-BIH QT database [17] and the accuracy of the system in determining heartbeat segmentation points was comparable with the interexpert variation.
D. Feature Extraction
Features relating to fiducial point intervals were calculated for each heartbeat. Features relating to heartbeat intervals and ECG morphology were calculated separately for the two ECG signals for each heartbeat (see the “Processing” stage of Fig. 2). Table III lists the features used in this study.
1“ecgpuwave”: see
Fig. 2. Schematic representation of classifier configuration IX for the automated processing of the ECG for classification of heartbeats. TABLE III
FEATUREGROUPSCONSIDERED INTHISSTUDY. WHEREFEATURESARE
DERIVEDSEPARATELYFROM THETWOECG LEADS,THEGROUPLABELS FOR
LEADB FEATURESARESHOWN INSQUAREBRACKETS
1) RR-Interval Features: Heartbeat fiducial point intervals (henceforth called RR-intervals) were defined as the interval be-tween successive heartbeat fiducial points. Four features (see Table III: RR-intervals) were extracted from the RR sequence.
The pre-RR-interval was the RR-interval between a given heart-beat and the previous heartheart-beat. The post-RR-interval was the RR-interval between a given heartbeat and the following heart-beat. The average RR-interval was the mean of the RR-inter-vals for a recording and had the same value for all heartbeats in a recording. Finally, the local average RR-interval was de-termined by averaging the RR-intervals of the ten RR-intervals surrounding a heartbeat.
2) Heartbeat Interval Features: Three features per ECG lead (see Table III: heartbeat intervals A and B) relating to heartbeat intervals were calculated after heartbeat segmenta-tion. The QRS duration was the time interval between the QRS onset and the QRS offset. The T-wave duration was defined as the time interval between the QRS offset and the T-wave offset. The third feature was a Boolean variable indicating the presence or absence of a P-wave.
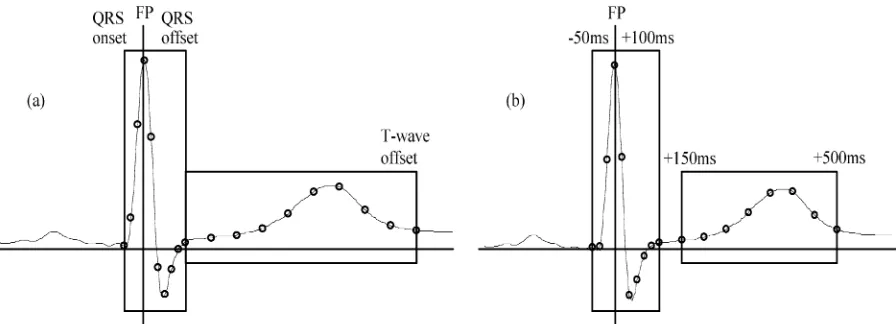
3) ECG Morphology Features: Features used in this study to represent the morphology of the ECG signals were divided into eight groups. All groups contained amplitude values of the ECG signal. The major distinction between the groups was the method used for sampling the signals. Four groups used a sam-pling rate determined by the heartbeat segmentation information and four groups used a fixed-interval sampling rate.
Fig. 3. Two time-sampling methods for extracting ECG morphology features. (a) After determining the fudicial point (FP), the QRS onset and offset and T-wave offset points are found. Ten evenly spaced samples of the ECG between the QRS onset and offset and nine evenly spaced samples of the ECG between the QRS offset and T-wave offset are extracted. (b) After determining the FP, nine samples of the ECG between FP-50 ms andFP + 100ms and nine samples between
FP+150 ms andFP+500 ms are extracted.
interpolation was used to estimate the intermediate values of the ECG amplitude.
The above sampling method was applied to lead A to form the Morphology 1A group (see Table III: Morphology 1A) and ap-plied to lead B to form the Morphology 1B group (see Table III: Morphology 1B).
The Morphology 2A group (see Table III: Morphology 2A) and the Morphology 2B group (see Table III: Morphology 2B) were calculated in an identical way to the Morphology 1A and 1B groups, respectively, except that the entire ECG signal was scaled so that the standard deviation of all sample values was unity before the sampling windows were applied. This scaling operation resulted in a signal that was independent of the orig-inal ECG signal amplitude.
b) Fixed-interval ECG morphology features: The sample rate was fixed and the sampling windows were located by the heartbeat fiducial point (FP) for four groups. Fig. 3(b) depicts the sampling process. Two sampling windows were formed based on FP. The first window approximately covered the QRS-complex and contained the portion of the ECG between FP-50 ms and 100 ms. A 60-Hz sampling rate was applied to the ECG amplitude resulting in ten features. The second window approximately contained the T-wave and started at 150 ms and finished at 500 ms. The ECG signal am-plitude was sampled at 20 Hz in this window, resulting in eight features. Lower sampling rates were used for T-wave sampling windows as the frequency content of this wave is lower than the frequency content of the QRS-complex. This reduced the number of feature values to be processed by the classifier.
The above sampling method was applied to lead A to form the Morphology 3A group (see Table III: Morphology 3A) and ap-plied to lead B to form the Morphology 3B group (see Table III: Morphology 3B).
The Morphology 4A group (see Table III: Morphology 4A) and the Morphology 4B group (see Table III: Morphology 4B) were calculated in an identical way to the Morphology 3A and 3B groups, respectively, after scaling the ECG signal as de-scribed previously.
4) Feature Sets: The above features were combined into eight feature sets which are summarized in Table IV. Feature
TABLE IV
EIGHTFEATURESETSINVESTIGATED INTHISSTUDY
set 1 (FS1) contained 26 features including the RR features and the features from lead A requiring the determination of the heartbeat segmentation points. These features included the unscaled segmented ECG morphology group (Morphology 1A) and the heartbeat interval A group. Feature set 2 contained the same features as FS1 except that the scaled segmented ECG morphology group (Morphology 2A) replaced the Morphology 1A group. Feature set 3 (FS3) contained 22 features including the RR features and the unscaled fixed-interval morphology features from lead A (Morphology 3A). Thus, the determination of the heartbeat segmentation points was not required for this feature set. Feature set 4 contained the same features as FS3 except that the scaled fixed-interval ECG morphology group (Morphology 4A) features replaced the Morphology 3A group. Feature sets 5–8 (FS5 to FS8) were similar to FS1 to FS4 except that features included were calculated from lead B (see Table IV).
The eight feature sets were used to examine the effect on clas-sification performance of lead placement, alternative ECG mor-phology representations, and inclusion of heartbeat segmenta-tion informasegmenta-tion.
E. Classifier Model
For linear discriminants, the unweighted likelihood func-tion is defined as [18]
(1)
where the number of classes is , the number of training exam-ples in class is , and is the value of the Gaussian distribution with mean and common covariance evaluated at training example . The training process de-termines the parameter values of and that maximizes the value of .
The relative proportions of the classes of the available training examples influences the performance of an LD classifier. If a few classes dominate the training data examples, then the classi-fier training process is heavily influenced by these classes [18]. One solution to avoid this problem is to include a subsample of the training examples of the larger classes in the training process but this is wasteful of training data. A better solution implemented in this study is to include all training examples but reduce the relative contribution of the training examples of the large classes to the training process. This is achieved by weighting the contribution of each training example to the like-lihood function by a class dependent factor .
A weighted likelihood function is
(2)
and the contribution of a training example to is directly related to .
This is maximized when the mean vectors are defined as
(3)
and the covariance matrix is defined as
(4)
In this study, values for were determined as follows. All classes were weighted so that, as far as possible, each class con-tributed the equivalent of 400 examples to the training process. This threshold was chosen as it was felt that classes with less examples were not adequately represented and hence their con-tribution to the likelihood function needed to be reduced. If the number of examples in a class was greater than 400, then the was set to . For the classes with less than 400 ex-amples, no weighting was used (i.e., ). The values of for the five heartbeat classes were: N: ; S: ;
V: ; F: ; and Q: 1.
F. Classifying and Combining Classifiers
After determining the ’s and from the training data, a feature vector is classified by assuming values for the prior
probabilities and calculated the estimated posterior proba-bilities for the th class using
(5)
where .
The prior probability of the N, S, V, and F classes was set to 10/41. As the number of unknown beats was a tiny fraction of all the heartbeats, the prior probability of the Q class was reduced relative to the other classes and was set to 1/41.
The final classification of a single feature set system was ob-tained by choosing the class with the highest posterior proba-bility estimate from (5).
To obtain a classification based on processing information from multiple feature sets simultaneously, the posterior prob-abilities obtained from each feature set were combined across the separate classifier outputs. Assuming that the outputs from classifiers are to be combined, the final posterior probability output was calculated from the individual classifier outputs using the unweighted Bayesian product in-tegration scheme [19] as follows:
(6)
As before, the final classification is obtained by choosing the class with the highest posterior probability estimate. By using information from all available signals, more efficient use of the available ECG diagnostic information was made.
G. Candidate Classifier Configurations
Twelve classifiers configurations were evaluated. Config-urations I-VIII were single-lead configConfig-urations processing FS1-FS8, respectively. These configurations utilized one LD classifier. Configurations IX-VII were multiple-lead config-urations that processed FS1 and FS5; FS2 and FS6; FS3 and FS7; and FS4 and FS8 respectively. These four configuration implemented two LD classifiers (each processing one feature set) and were combined using the integration scheme of (6).
H. Classification Performance Measures
The performance of the classifier configurations was calcu-lated using a number of measures. Table V shows how the full classification matrix is used to calculate the performance mea-sures. In accordance with the AAMI recommendations, two sets of performance measurements were calculated. These perfor-mance measures focus on the ability of algorithms to distin-guish VEBs from VEBs [Table V(a)] and SVEBs from non-SVEBS [Table V(b)]. It is worth noting that the AAMI-recom-mended calculations shown in 4(a) do not reward or penalize a classifier for the classification of ventricular fusion (F) or un-known beats (Q) as VEBs. Similarly, in Table V(b), the calcula-tions do not reward or penalize a classifier for the classification of unknown beats as SVEBs.
TABLE V
PERFORMANCEMEASURESUSED INTHISSTUDY FOR(a) DISTINGUISHINGVEBSFROM NON-VEBS, (b) DISTINGUISHINGSVEBS FROMNON-SVEBS,AND(c) DISTINGUISHING THEFIVEAAMI HEARTBEATCLASSES. THEPERFORMANCEMEASURESAREALLDERIVEDFROM THEMUTUALLYEXCLUSIVEGROUPS
OFTRUEPOSITIVES(TP), TRUENEGATIVES(TN), FALSEPOSITIVES(FP),ANDFALSENEGATIVES(FN). THECELLSASSOCIATED
WITHTHESEGROUPS IN(a)AND(b) ARESHADED TOAIDIDENTIFICATION
clinically, they were not convenient for comparing the mance of different classifier configurations. To rank the perfor-mance of the different classifier configurations, the multiway classification accuracy and class sensitivities were calculated for each classifier [see Table V(c)] and compared.
All aggregate performance measures for a dataset were cal-culated by giving each heartbeat equal weighting (the so-called “gross” statistics in [13]).
I. Clustering Performance Measure
The method described in this study was compared to the heartbeat clustering method of [12]. Heartbeat clustering systems do not classify heartbeats but attempt to group all heartbeats from the same heartbeat class into a unique cluster. For these systems, a heartbeat is defined as misclustered if it assigned to a cluster where the dominant beat type is a different class. To determine the clustering performance of our method, each heartbeat was processed and the five possible outputs of the classifiers were considered as cluster labels rather than heartbeat classes. Once the cluster labels were determined for all heartbeats in a recording, the expert annotations were used to determine the dominant heartbeat class of each cluster. To compare our method to [12], a similar error measure to their measure was defined.
was calculated by first determining the number of correctly clustered VEBs and correctly clustered non-VEBs . A VEB was correctly clustered if a beat belonging to the VEB class was assigned to a cluster
where the dominant beat was the VEB class. A non-VEB was correctly clustered if a beat belonging to N, S, F, or Q beat classes was assigned to a cluster where the dominant beat was either N, S, F or Q beat class. was then determined using
(7)
J. Assessing the Performance of the Classifiers
Classifier performance was estimated using two methods in this study. In the first method, the cross-validation scheme [20], [21] was applied to DS1. The available data was divided into folds in two ways. In the first division (DD1), the data was assigned to 22 folds with each fold containing data from one recording. In the second division (DD2), all heartbeats were considered independent and randomly assigned to the 22 folds. The cross-validation method was used to assess the performance of different candidate classifiers and identify the best performing classifier for a second performance estimation. The second method of performance estimation was to train the system using DS1 and test the system by processing DS2. Fig. 1 shows how the data was divided in this study into separate sets for performance assessment.
V. RESULTS
TABLE VI
MULTIWAYPERFORMANCE OF THECANDIDATECONFIGURATIONS ONDS1. (A) CONFIGURATIONI USING THEBEAT-BASEDDATADIVISIONSCHEME AND(B) SINGLE-LEAD AND(C) MULTI-LEADCONFIGURATIONSUSING THERECORD-BASEDDATADIVISIONSCHEME. THESELECTEDCONFIGURATIONIS INBOLD
in this study. All performance figures were determined by aggre-gating the test-set figures from the 22 test-set folds. Table VI(a) presents results for configuration I using cross-validation ap-plied to DD2. Results in Table VI(b) and VI(c) are obtained using cross validation applied to DD1. Table VI(b) presents results for the single-lead configurations processing FS1-FS8. Table VI(c) presents results for the four multilead configura-tions. The objective of this section of the study was to select a classifier configuration with the best performance in separating all classes simultaneously. For this reason Table VI shows the multiway classification performance measures only.
After consideration of the results in Table VI, configuration IX was chosen as the best performing classifier. It was retrained using DS1 and tested on DS2. A schematic diagram of a system implementing configuration IX is shown in Fig. 2. In accor-dance with AAMI recommendations, the classification perfor-mance for each recording and the gross perforperfor-mance figures were calculated for DS2 (test-set) and are shown in Table VII(a). For comparison, the classification performance of a published system [11] is shown in Table VII(b). The clustering perfor-mance is shown in Tables VII(c) and VIII shows a summary table of beat-by-beat performance.
VI. DISCUSSION
The classification performance for configuration I was deter-mined using the two data division schemes, DD1 and DD2. The results show that the classification performance figures resulting from DD2 [Table VI(a)] are notably higher than the same fig-ures resulting from DD1 [Table VI(b)]. The multiway accuracy estimated using DD2 was 86.1% which was 7.1% higher than the same result estimated using DD1. The same trends can be seen for the specificity and sensitivity results in this table.
These results demonstrate that dividing data on a beat basis results in optimistically biased classifications results. This scheme is biased as intrasubject beats can be highly dependent and hence dependent beats may appear in the training and testing sets. This data division scheme has been previously favored by other investigators (e.g., [7], [9], [10]) and should be avoided. The DD1 scheme is a superior scheme to DD2
as the test data do not contain any heartbeats from subjects represented in the training data. For the rest of this study, the DD1 scheme was employed.
A. Performance of the Candidate Configurations
In terms of accuracy, the best-performing single-lead classi-fier was configuration VII with an accuracy figure of 83.0%. Inspection of the sensitivity and specificity results reveal that, while it achieved a high specificity (88.1%), the resulting sen-sitivities were very low (SVEB 30.4%, VEB 39.9%, F 32.1%, and Q 0.0%), and so this configuration would be of limited clinical use. Of more benefit is a system with more balanced specificity and sensitivity performance figures. On this basis, classifier configuration I achieved the best performance (accu-racy 79.0%, specificity 80.6%, and sensitivities: SVEB 59.9%, VEB 65.3%, fusion (F) 74.5%, and unknown (Q) 25.0%) of the single-lead configurations.
The multilead configurations always resulted in higher accu-racy performance than the single-lead configurations processing the same feature sets. For the four multilead configurations as-sessed, the increase in accuracy occurred because of an increase in specificity and the VEB sensitivity with no change or a slight decrease in the other specificities compared to the single-lead configurations. Thus, combining the information from multiple ECG leads was a good performance enhancing strategy.
TABLE VII
(A) CLASSIFICATIONPERFORMANCE OFCONFIGURATIONIXONEACHRECORDING OFDS2 USING THEAAMI RECOMMENDEDPERFORMANCEMEASURES, (B) AGGREGATECLASSIFICATIONPERFORMANCE FOR THESYSTEM IN[11],AND(C)THECLUSTERINGPERFORMANCE OFCLASSIFIERIXANDSYSTEMFROM[12]
were worthwhile steps. This latter observation contradicts the findings of Milletet al.[22].
B. Final Testing
Table VII(a) shows the performance assessment, as recom-mended by the AAMI standards, of configuration IX on DS2. This assessment is unbiased as DS2 was not used at any point in the development of the classifier.
For the SVEB class, the gross sensitivity was 75.9%, the pos-itive predictivity was 38.5%, and the false pospos-itive rate (FPR) was 4.7%. The gross sensitivity was 77.7%, the positive pre-dictivity was 81.9%, and the FPR was 1.2% for the VEB class. Thus, the performance of our system in detecting SVEBs is not as high as the performance of the system in detecting VEBs. A likely reason for this is that there were 942 SVEBs in the training data which was notably less than the 3787 VEBs available.
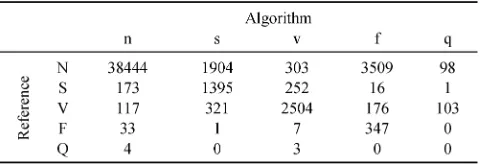
The summary table of beat-by-beat performance (Table VIII) provides insight into how groups are being misclassified. These results show that two main errors are being made by the system based on configuration IX. First, 1904 normal (N) beats were misclassified as SVEB (S) beats, and, second, 3509 N beats were misclassified as fusion (F) beats. Future work needs to look at identifying features that more clearly distinguish normal beats from these two aberrant beat classes.
TABLE VIII
SUMMARYTABLE OFBEAT-BY-BEATPERFORMANCE ONDS2OFCLASSIFIERIX
Distinguishing normal beats from fusion beats is an inherently difficult problem as fusion beats are a union of ventricular and normal beats.
C. Comparison With Other Automated Heartbeat Processing Systems
[image:9.612.309.549.498.580.2]studies and the aggregate performance results on these record-ings were compared directly. The gross performance of config-uration IX on these recordings was: accuracy 96.4%, sensitivity 77.5%, positive predictivity 90.6%, and FPR 1.1%.
Using [11, Table VI], the gross sensitivity, positive predic-tivity, and FPR rate were recalculated for the 11 recordings in common and results are shown in Table VII(b). Our system is notably better than the fully automatic configuration (GE classi-fier) approach (accuracy 75.3%, sensitivity 69.6%, positive pdictivity 34.6%, and FPR 16.8%) and is comparable to the re-sults obtained with their semi-automatic MOE approach (accu-racy 93.6%, sensitivity 78.9%, positive predictivity 76.0%, and FPR 3.2%). The significant difference is that our system does not require an expert to annotate part of the recording under test in order to train the local classifier for the MOE approach.
Lagerholmet al.[12] also used the same 20 recordings as Hu to determine the performance of clustering VEB and non-VEBs. Using the 11 recordings in common with our study, a compar-ison was made of the clustering performance of our system and Lagerholm’s [see Table VII(c)]. Our system achieved a clus-tering accuracy of 97.5% which was below the 99.2% achieved by Lagerholm. It should be noted that our system used five clusters whereas Lagerholm’s system used 25 clusters, and so our system is attempting a more constrained and therefore more difficult clustering problem. A significant advan-tage of our system over Lagerholm’s is that no annotating of the dominant beat of a cluster by an expert is required before the classification of a cluster can be made.
D. Automatic Heartbeat Detection
To fully automate the heartbeat classification method presented here, an automatic heartbeat detection module is required. Automatic heartbeat detection results in some errors in heartbeat detection (missed heartbeats, erroneously detected heartbeats, and errors in heartbeat fiducial point identifica-tion), and this will cause a reduction in the performance of the presented heartbeat classifier method for two reasons. First, a missed heartbeat or an erroneously detected heartbeat cannot be classified correctly. Second, there will be errors introduced into the RR-interval features due to heartbeat detection and fiducial point identification errors. A number of schemes exist that claim less than 0.5% error rate in detecting heartbeats e.g., [12], [23], [24]. This error rate is much less than the error rate of our heartbeat classification method (e.g., %), and it is anticipated that automating the heartbeat detection process with such a scheme would not degrade the heartbeat classification performance of our system appreciably.
VII. CONCLUSION
Using the MIT-BIH arrhythmia database, we have discussed the development of a method for the processing of the ECG for the classification of heartbeats into five groups: normal beats, VEBs, SVEBs, fusion of normal and VEBs, and unknown beat types. In this study, heartbeat fiducial points were determined manually. The classification performance of 12 classifier con-figurations were compared and the best configuration chosen for
an independent performance assessment. The chosen configura-tion processed feature sets derived from two ECG leads each uti-lizing features derived from RR-intervals, unscaled ECG mor-phology, and heartbeat segmentation information. The config-uration implemented two linear discriminant classifiers (each processing one feature set) which combined the classifier out-puts to form the final decision. The independent performance as-sessment of this configuration resulted in a sensitivity of 75.9%, a positive predictivity of 38.5%, and an FPR of 4.7% for the SVEB class. The VEB sensitivity was 77.7%, the positive pre-dictivity was 81.9%, and the FPR was 1.2%. These results are an improvement on previously reported results for automated heartbeat classification systems.
ACKNOWLEDGMENT
The authors wish to thank Prof. B. Celler of the University of New South Wales for introducing them to the MIT-BIH ar-rhythmia database.
REFERENCES
[1] M. S. Thaler, The Only EKG Book You’ll Ever Need, 3rd ed. Philadelphia, PA: Lippincott Williams & Wilkins, 1999. [2] K. Minami, H. Nakajima, and T. Toyoshima, “Real-time discrimination
of ventricular tachyarrhythmia with Fourier-transform neural network,”
IEEE Trans. Biomed. Eng., vol. 46, pp. 179–185, Feb. 1999.
[3] S. Evans, H. Hastings, and M. Bodenheimer, “Differentiation of beats of ventricular and sinus origin using a self-training neural network,”PACE, vol. 17, pp. 611–626, 1994.
[4] R. Clayton, A. Murray, and R. Campbell, “Recognition of ventricular fibrillation using neural networks,”Med. Biol. Eng. Comput., vol. 32, pp. 217–220, 1994.
[5] S. Barro, R. Ruiz, D. Cabello, and J. Mira, “Algorithmic sequential de-cision-making in the frequency domain for life threatening ventricular arrhythmias and imitative artefacts: A diagnostic system,”J. Biomed. Eng., vol. 11, pp. 320–328, 1989.
[6] J. A. Kastor,Arrhythmias, 2nd ed. London, U.K.: W.B. Saunders, 1994.
[7] L. Senhadji, G. Carrault, J. J. Bellanger, and G. Passariello, “Comparing wavelet transforms for recognizing cardiac patterns,”IEEE Eng. Med. Biol. Mag., vol. 14, pp. 167–173, Mar.–Apr. 1995.
[8] T. H. Yeap, F. Johnson, and M. Rachniowski, “ECG beat classifica-tion by a neural network,” inProc. Annu. Int. Conf. IEEE Engineering Medicine and Biology Soc., 1990, pp. 1457–1458.
[9] Y. H. Hu, W. J. Tompkins, J. L. Urrusti, and V. X. Afonso, “Applications of artificial neural networks for ECG signal detection and classification,”
J. Electrocardiol., vol. 26, pp. 66–73, 1993.
[10] S. Osowski and T. L. Linh, “ECG beat recognition using fuzzy hybrid neural network,”IEEE Trans. Biomed. Eng., vol. 48, pp. 1265–1271, Nov. 2001.
[11] Y. H. Hu, S. Palreddy, and W. J. Tompkins, “A patient-adaptable ECG beat classifier using a mixture of experts approach,” IEEE Trans. Biomed. Eng., vol. 44, pp. 891–900, Sept. 1997.
[12] M. Lagerholm, C. Peterson, G. Braccini, L. Edenbrandt, and L. Sornmo, “Clustering ECG complexes using hermite functions and self-organizing maps,”IEEE Trans. Biomed. Eng., vol. 47, pp. 838–848, July 2000. [13] Testing and Reporting Performance Results of Cardiac Rhythm and ST
Segment Measurement Algorithms, 1998. Association for the Advance-ment of Medical lnstruAdvance-mentation.
[14] Recommended Practice for Testing and Reporting Performance Results of Ventricular Arrhythmia Detection Algorithms, 1987. Association for the Advancement of Medical lnstrumentation.
[15] R. Mark and G. Moody. (1997, May) MIT-BIH Arrhythmia Database. [Online]. Available: http://ecg.mit.edu/dbinfo.html
[16] P. Laguna, R. Jané, and P. Caminal, “Automatic detection of wave boundaries in multilead ECG signals: Validation with the CSE data-base,”Comput. Biomed. Res., vol. 27, no. 1, pp. 45–60, 1994. [17] R. Jané, A. Blasi, J. García, and P. Laguna, “Evaluation of an automatic
[18] B. D. Ripley,Pattern Recognition and Neural Networks, Cambridge, U.K.: Cambridge Univ. Press, 1996.
[19] M. Heckmann, F. Berthommier, and K. Kroschel, “Noise adaptive stream weighting in audio-visual speech recognition,”Eurosip J. Appl. Signal Processing, no. 11, pp. 1260–1273, 2002.
[20] R. Kohavi, “A study of cross validation and bootstrap for accuracy es-timation and model selection,” inProc. 14th Int. Joint Conf. Artificial Intelligence, 1995, pp. 1137–1143.
[21] C. M. Bishop,Neural Networks for Pattern Recognition. New York: Oxford Univ. Press, 1995.
[22] J. Millet, M. A. Perez, G. Joseph, A. Mocholi, and J. Chorro, “Pre-vious identification of QRS onset and offset is not essential for clas-sifying QRS complexes in a single lead,”Comput. Cardiol., vol. 24, pp. 299–302, 1997.
[23] V. X. Afonso, W. J. Tompkins, T. Q. Nguyen, and S. Luo, “ECG beat detection using filter banks,”IEEE Trans. Biomed. Eng., vol. 46, pp. 556–564, Feb. 1999.
[24] S. Kadambe, R. Murray, and G. F. Boudreaux-Bartels, “Wavelet trans-formed-based QRS complex detector,”IEEE Trans. Biomed. Eng., vol. 46, pp. 838–848, July 1999.
Philip de Chazal(M’94) received the B.E. degree in electronic engineering and the M.Biomed.E. and Ph.D. degrees in biomedical engineering from the University of New South Wales, Sydney, Australia, in 1989, 1995, and 1999, respectively.
He was a Research Scientist with CSIRO, Sydney, from 1990 to 1992, a Biomedical Engineer with Med-Care Systems, Sydney, from 1993 to 1999, and a Re-search Fellow with the University College Dublin, Dublin, Ireland, from 1999 to 2003. He is cofounder and currently the Chief Technical Officer of Bian-caMed, Ireland, a company providing intelligent computer-based analysis of medical signals. His research interests include signal processing and pattern recognition for biomedical applications and image processing for multimodal applications.
r de Chazal is a member of the IEEE Engineering in Medicine and Biology So-ciety. He is a reviewer for the IEEE TRANSACTIONS ONMULTIMEDIAand IEEE TRANSACTIONS ONBIOMEDICALENGINEERING.
Maria O’Dwyerreceived the B.E. and M.Eng.Sc. degrees in electronic engineering from the National University of Ireland, Dublin, in 1999 and 2001, re-spectively.
She is currently an IC Design Engineer with Silicon & Software Systems, Cork, Ireland. Her research interests include biomedical engineering, signal processing, and the design of integrated circuits and systems.
Richard B. Reilly (M’92–SM’04) received the B.E., M.Eng.Sc., and Ph.D. degrees in 1987, 1989, and 1992, all in Electronic Engineering, from the National University of Ireland.
In 1988, he joined Space Technology Ireland and the Dept. de Recherche Spatiale (CNRS group) in Paris, developing DSP-based on-board experimentation for the NASA satellites. In 1990, he joined the National Rehabilitation Hospital and in 1992 became a Postdoctoral Research Fellow at University College, Dublin, focusing on signal processing for speech and gesture recognition. Since 1996, he has been on the academic staff in the Department of Electronic and Electrical Engineering at University College, Dublin. He is currently Senior Lecturer and researches into neurological signal processing and multimodal signal processing.
Dr Reilly was the 1999/2001 Silvanus P. Thompson International Lecturer for the Institution of Electrical Engineers (IEE). In 2004, he was awarded a U.S. Fulbright Award for research collaboration with the Nathan Kline Institute for Psychiatric Research, Orangeburg, NY. He is a member of the IEEE Engineering in Medicine and Biology Society and Signal Processing Society. He is a com-mittee member of the IEEE United Kingdom and Republic of Ireland Section. He is an Associate Editor for IEEE TRANSACTIONS ONMULTIMEDIAand also a reviewer for IEEE TRANSACTIONS ONNEURALSYSTEMS ANDREHABILITATION