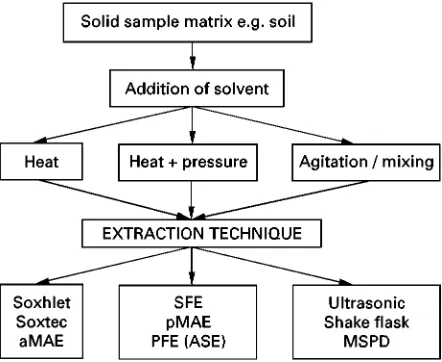
Figure 1 Sample preparation protocol. Figure 2 Extraction of analytes from solid matrices. Krivankova L and Bocek P (1997) Synergism of capillary
isotachophoresis and capillary zone electrophoresis. Journal of Chromatography B689: 13}34.
McLaughlin GM, Weston A and Hauffe KD (1996) Capillary electrophoresis methods development and sen-sitivity enhancement strategies for the separation of in-dustrial and environmental chemicals. Journal of Chromatography A744: 123}134.
Muijselaar PG, Otusuka K and Terabe S (1997) Micelles as pseudo-stationary phases in micellar electrokinetic chro-matography.Journal of Chromatography A780: 41}61. Poole CF and Poole SK (1997) Interphase model for retention and selectivity in micellar electrokinetic
chromatography.Journal of Chromatography A 792: 89}104.
Reijenga JC, Verheggen TPEM, Martens JHPA and Everaerts FM (1996) Buffer capacity, ionic strength and heat dissipation in capillary electrophoresis.Journal of Chromatography A744: 147}153.
Rodriguez-Diaz R, Zhu M and Wehr T (1997) Strategies to improve performance of capillary isoelectric focusing. Journal of Chromatography A772: 145}160.
Watzig H, Matthias D and Kunkel A (1998) Strategies for capillary electrophoresis: method development and vali-dation for pharmaceutical and biological applications. Electrophoresis19: 2695}2752.
ESSENTIAL GUIDES TO METHOD
DEVELOPMENT IN EXTRACTION
J. R. Dean, University of Northumbria at Newcastle, Newcastle upon Tyne, UK
Copyright
^
2000 Academic PressIntroduction
Samples for extraction can be broadly categorized as
solid, liquid or gaseous matrices. It is obvious that the
different methods of extraction of analytes from
these matrices will also vary. This guide provides an
overview of the different approaches for
extrac-tion of analytes from these different matrices.
It is important to consider that extraction is only
one part of the sample preparation protocol. Other
steps are highlighted in
Figure 1
. A typical solid
sample is most likely to be heterogeneous. This is
a problem in the analysis, if appropriate steps have
not been taken to remove a representative sample
using a statistical approach. Failure to do so can make
any subsequent extraction and analysis results
mean-ingless.
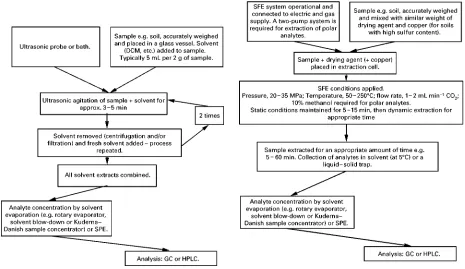
[image:1.568.295.516.514.695.2]Figure 3 Soxhlet extraction.
Figure 4 Ultrasonic extraction.
Figure 5 Shake-flask extraction.
Figure 6 Supercritical fluid extraction.
case of a soil sample, whether it should be dried
(volatile analytes may be lost) or extracted in the
unadulterated state. If possible, drying is favoured, as
the subsequent matrix can be ground and sieved to
increase its surface area (smaller particle size).
Solid Matrices
[image:2.568.53.518.427.696.2]Figure 7 Microwave-assisted extraction.
[image:3.568.52.284.419.685.2]Figure 8 Pressurized fluid extraction (or accelerated solvent extraction).
Figure 9 Matrix solid-phase dispersion.
Figure 10 Thermal desorption.
(SFE), pressurized microwave-assisted extraction
(pMAE), atmospheric microwave-assisted
extrac-tion (aMAE), pressurized
S
uid extraction (PFE) or
accelerated solvent extraction (ASE), ultrasonic
ex-traction, shake-
S
ask extraction and matrix solid
phase dispersion (MSPD). Method development
approaches for each extraction technique are shown
in
Figures 3
}
10
.
Liquid Matrices
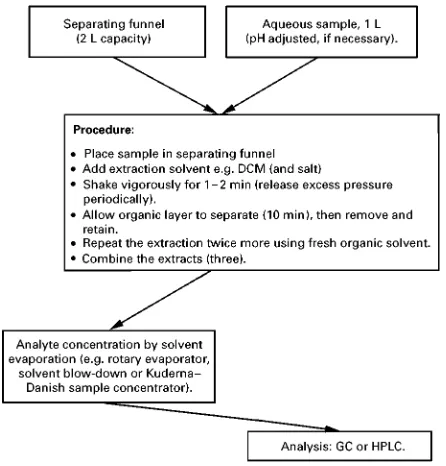
[image:3.568.295.512.516.697.2]Figure 11 Separating funnel liquid}liquid extraction.
[image:4.568.52.275.56.289.2]Figure 12 Solid-phase extraction.
Figure 13 Solid-phase microextraction.
extraction (LLE), solid-phase extraction (SPE) and
solid-phase microextraction (SPME). A guide to
method development for each extraction technique is
shown in
Figures 11
}
14
.
Gaseous
/
Atmospheric Samples
Gaseous samples are normally analysed by gas
chromatography (GC). The volatile nature of the
analytes means that some form of trapping is
re-quired. Typical approaches for analyte trapping are
shown in
Table 1
.
Solvent Selection
[image:4.568.56.269.419.696.2]Table 1 Common approaches for gaseous samples
Technique Comments
Solid phase trapping Gaseous sample passed through a sorbent, e.g. Tenax, activated charcoal, etc. Trapped analytes are eluted with a suitable solvent.
Liquid trapping Gaseous sample is bubbled through a suitable trapping solvent. To improve trapping efficiency it is important to minimize the flow rate and/or lower the temperature. The use of multiple traps or impingers may be necessary.
Headspace sampling Solid or liquid sample placed in a sealed glass vial until equilibrium is reached. Volatile analytes sampled from the headspace using a gas-tight syringe or solid-phase microextraction. Purge and trap See Figure 14.
[image:5.568.50.517.246.391.2]Solid-phase microextraction See Figure 14 and Headspace sampling, above.
Table 2 Calculation of individual group contributions for a solvent (methanol) and the analyte, DDT
Molecule Group Group contribution to dispersion(Fd) J1/2cm3/2mol\1
Group contribution to polarity(Fp)
J1/2cm2mol\1
Group contribution to hydrogen bonding(Uh) J mol\1
Molar volume(V)
cm3mol\1
Methanol CH3 420 0 0 33.5
OH 210 500 20 000 10.0
Total 630 500 20 000 43.5
DDT 2;-Ph- 2540 220 0 104.8
2;Cl-CH" 900 1100 800 48
3;Cl 1350 1650 1200 72
1;CH 80 0 0 !1.0
'C( !70 0 0 !19.2
Total 4800 2970 2000 204.6
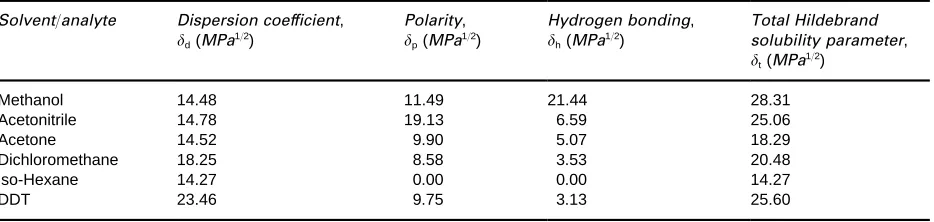
Table 3 Total Hildebrand solubility parameter and its individual components
Solvent/analyte Dispersion coef[cient, d(MPa1/2)
Polarity, p(MPa1/2)
Hydrogen bonding, h(MPa1/2)
Total Hildebrand solubility parameter, t(MPa1/2)
Methanol 14.48 11.49 21.44 28.31
Acetonitrile 14.78 19.13 6.59 25.06
Acetone 14.52 9.90 5.07 18.29
Dichloromethane 18.25 8.58 3.53 20.48
iso-Hexane 14.27 0.00 0.00 14.27
DDT 23.46 9.75 3.13 25.60
Van der Waal’s, hydrogen bonding, etc. While the
choice of extraction technique is important, often for
economic and environmental concerns, its
phys-ical
/
chemical properties are largely in
S
uenced by the
choice of solvent (in most cases). This is not to say
that the effects of heat, pressure, agitation and
sorbent are negligible, but that these on their own are
largely unimportant without the presence of an
or-ganic solvent and that the choice of solvent is critical.
Apart from general rule of thumb guidelines for
sol-vent selection, i.e. like extracts such as a nonpolar
analyte can be extracted by a nonpolar solvent, little
at-tempt has been made to offer a scienti
R
c approach.
The solvent prediction scheme used is based on the
Hildebrand solubility parameter (
t). The solubility
[image:5.568.52.519.442.553.2]Figure 14 Purge and trap.
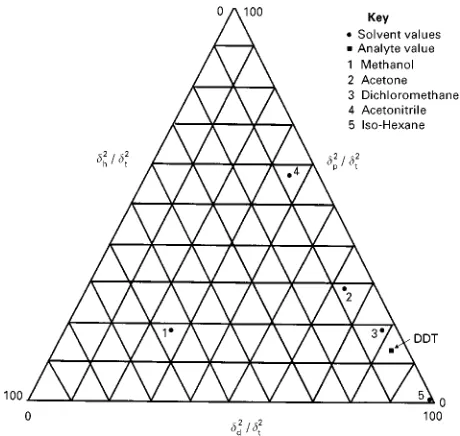
[image:6.568.289.517.82.162.2]Figure 15 Comparison of calculated solvent and analyte frac-tional parameters.
Table 4 Pressurized fluid extraction of DDT from contaminated soil followed by GC-MSD quantitation,n"6a
Solvent Meang g\1 SD
Methanol 89 10.1
Acetone 163 7.4
Dichloromethane 220 13.9
Acetonitrile 65 2.9
Iso-Hexane 120 4.4
aExtraction conditions: sample size 2 g; temperature, 1003C;
pressure 2000 psi; static extraction time 10 min; one static/flush cycle.
tis de
R
ned as the square root of the cohesive
energy density or:
t"
(
E
v/
V
)
1/2[1]
where
t"
total Hildebrand solubility parameter,
E
v"
energy of vaporization at a given temperature
and
V
"
molar volume of the molecule.
Hansen (1967) took this work further and assumed
that the total cohesive energy is a linear addition of
three components:
h, hydrogen bonding ability
con-tribution;
d, dispersion co-ef
R
cient contribution;
and,
p, polarity contribution. They are linked by the
following equation:
2t
"
2h#
2p#
2d[2]
The individual components of
tcan be determined
using a group contribution additive method. The data
available allows each group’s contribution to
polar-ity, dispersion and hydrogen bonding (
F
p,
F
d, and
U
h,
respectively) to be calculated using the following
equations
p,
h, and
d:
d"
(
zzF
d)
/
V
[3]
p"
(
zzF
p)
/
V
[4]
p"
(
zzF
2p)
1/2/
V
[5]
h"
((
zzU
h)
/
V
)
1/2[6]
For molecules with more than one polar group
pres-ent, then eqn [5] must be used instead of eqn [4] to
take into account the interactions between the polar
groups.
An example calculation of the individual
compo-nents of the solubility parameter for a solvent
(meth-anol) and an analyte
(1,1,1-trichloro-2-2-bis(p-chlorophenyl)ethane (DDT)) are shown in
Table 2
.
The individual Hansen parameters for a range of
solvents and an analyte (DDT) are shown in
Table 3
.
As an example, the calculated total Hildebrand
solu-bility parameter,
t, for methanol (28.3 MPa
1/2)
compared favourably with the literature value of
29.6 MPa
1/2.
[image:6.568.49.279.462.680.2]Box 1 Soxhlet extraction of polycyclic aromatic hydrocarbons from contaminated soil.
Extraction conditions
Sample size: 10 g plus 10 g anhydrous sodium sulfate Solvent: 150 mL dichloromethane
Extraction time: 24 h
Comments: sample heated using an isomantle. Typically, refluxing of solvent occurs at the rate of 4 h\1.
Extracts were concentrated to 10 mL using rotary evaporator and then diluted twofold before addition of the internal standards.
Analysis of extracts by GC
Separation and identification of individual PAHs was done on a HP 5890 series II#GC fitted with a HP 5972A mass spectrometer. A 30 m;0.25 mm i.d.;0.25m film thickness DB-5 capillary column was used with temperature programming from an initial temperature held at 853C for 2 min before commencing a 63C min\1to 3003C, with a final time of 7 min. The split/splitless injector
was held at 3003C and operated in splitless mode with the split value closed for 1 min following sample injection. The split flow was set at 40 mL min\1, and the mass spectrometer transfer line was maintained at 2703C. Electron impact ionization at 70 eV with an
electron multiplier voltage set at 1500 V was used while operating in single-ion monitoring (SIM) mode.
Typical results: Saim N, Dean JR, Abdullah MP and Zakaria Z (1997)Journal of Chromatography 791A: 361.
dispersion and hydrogen bonding). A plot of selected
solvents and DDT is shown in
Figure 15
. Using this
plot, it can be seen that dichloromethane (DCM) is
predicted to be the optimum solvent for extraction of
DDT.
Table 4
shows results for the extraction of
DDT contaminated soil for selected solvents using
accelerated solvent extraction (ASE). It is clearly
shown that DCM gives the highest recovery of DDT.
Similarly, it is also predicted and con
R
rmed that both
isohexane and acetone would remove signi
R
cantly
more of the DDT than methanol and acetonitrile.
Work is on-going to identify whether the model can
be applied to other systems.
Selected Examples of Extraction of
Analytes from Environmental Matrices
Box 2 Shake flask extraction of phenols from soil Extraction conditions
Sample size: 1 g
Solvent: 50 mL methanol}water (60}40%v/v) Extraction time: 30 min
Comments: Sample and solvent placed in a 100 mL screw-capped bottle and extracted on a rotating disc Warburg mixer. Resultant sample/solvent was filtered under vacuum. Sample extracted filtered through a 0.45m membrane Acrodisk prior to analysis.
Analysis by HPLC
Separation and quantification was achieved using a 25 cm;4.6 mm i.d. ODS2 column with UV detection at 275 nm. The mobile phase was operated under isocratic conditions acetronitrile}H2O}acetic acid (40#59#1) at a flow rate of 1 mL min\1. A 20L Rheodyne injection loop was used to introduce samples and standards on to the column (303C).
Typical results: Hancock P and Dean JR (1997)Analytical Communications 34: 377.
soil;
Box 6
, pressurized
S
uid extraction of DDT,
1,1-dichloro-2,2-bis(p-chlorophenyl)ethane
(DDD)
and
1,1-dichloro-2,2-bis(p-chlorophenyl)ethylene
(DDE) from soil;
Box 7
, liquid
}
liquid extraction of
PAHs from water;
Box 8
, SPE of phenols from water;
Box 9
, solid-phase microextraction of benzene,
toluene, ethyl benzene and xylene (BTEX) from
water; and,
Box 10
, purge and trap of BTEX from
water.
Box 3 Supercritical fluid extraction of organochlorine pesticides from soil and Celite Extraction conditions Sample size: 1 g
SFE conditions: pressure, 250 kg cm\2; temperature, 503C; static
extraction time, 15 min followed by 40 min dynamic extraction time; and a flow rate of liquid CO2, 2 mL min\1.
Comments: Extracts collected in a vial containing 3}4 mL DCM. Es-caping CO2and analytes vented through a C18 SPE cartridge which was back-flushed with 1}2 mL methanol after each extraction.
Analysis by GC
Separation and identification of individual OCPs was done on a HP 5890 series II#GC fitted with a HP 5972A mass spectrometer. A 30 m;0.25 mm i.d.;0.25m film thickness DB-5 capillary column was used with temperature programming from an initial temperature held at 853C for 0.75 min before commencing a 163C min\1to 2853C, with a final time of 2 min. The
split/splitless injector was held at 2803C and operated in splitless mode with the split valve closed for 1 min following sample injection. The split flow was set at 40 mL min\1, and the mass spectrometer transfer line was maintained at 2903C. Electron
impact ionization at 70 eV with an electron multiplier voltage set at 1500 V was used while operating in single-ion monitoring (SIM) mode.
Box 4 Pressurized microwave-assisted extraction of polycyclic aromatic hydrocarbons (PAHs) from soil. Extraction conditions
Sample size: 2 g Solvent: 40 mL acetone
pMAE conditions: power, 30%(for a 950 W system); temperature, 1203C; extraction time, 20 min.
Comments: After extraction, extraction vessels allowed to cool.
Contents of vessels were then filtered through a GF/A glass microbore filter. Extracts were concentrated to 5 mL using a rotary evaporator before addition of internal standards.
Analysis by GC
Separation and identification of individual PAHs was done on a Carlo Erba HRGC 5300 Mega Series with on-column injection and flame ionization detection. A 30 m;0.32 mm i.d.;0.1m film thickness DB-5 HT capillary column was used with temperature programming from an initial temperature held at 503C for 2 min before commencing a 153C min\1to 903C;
hold for 2 min; increase at 63C min\1to 3003C with a final hold time of 8 min. The detector temperature was set at 2903C.
Box 5 Atmospheric microwave-assisted extraction of polycyclic aromatic hydrocarbons (PAHs) from soil. Extraction conditions
Sample size: 2 g Solvent: 70 mL DCM
pMAE conditions: power, 99%(for a 300 W system); extraction time, 20 min.
Comments: Contents of extraction vessel was then filtered through a GF/A glass microbore filter. Extracts were concentrated to 5 mL using a rotary evaporator before addition of internal standards.
Analysis by GC
Separation and identification of individual PAHs was done on a Carlo Erba HRGC 5300 Mega Series with on-column injection and flame ionization detection. A 30 m;0.32 mm i.d.;0.1m film thickness DB-5 HT capillary column was used with temperature programming from an initial temperature held at 503C for 2 min before commencing a 153C min\1
to 903C; hold for 2 min; increase at 63C min\1to 3003C with a final hold time of 8 min. The detector temperature was set
at 2903C.
Box 6 Pressurized fluid extraction of DDT, DDD and DDE from soil.
Extraction conditions Sample size: 2 g
PFE conditions: pressure, 2000 psi; temperature, 1003C; static extraction time, 10 min; and three static/flush cycles.
Comments: Sample placed in stainless steel extraction cell on top of a filter to prevent cell frit blockage. Hydromatix was used to fill the headspace to reduce solvent consumption.
Analysis by GC
Separation and identification of DDT, DDD and DDE was done on a HP 5890 series II#GC fitted with a HP 5972A mass spectrometer. A 30 m;0.25 mm i.d.;0.25m film thickness DB-5ms capillary column was used with temperature programming from an initial temperature held at 1203C for 2 min before commencing at 53C min\1to 2903C, with a final time
of 2 min. The split/splitless injector was held at 2803C and operated in splitless mode. The mass spectrometer transfer line was maintained at 2803C. Electron impact ionization at 70 eV with an electron multiplier voltage set at 1500 V was used while operating in single-ion monitoring (SIM) mode.
Box 7 Liquid}liquid extraction of polyaromatic hydrocarbons (PAHs) from water Extraction conditions
Sample volume: 25 mL
LLE conditions: sample extracted with 2;3 mL of DCM plus 1 g salt (NaCl). Each extract was shaken for 5 min each.
Comments: Combined extracts placed in a volumetric flask, internal standard added, prior to analysis.
Analysis by GC
Separation and identification of individual PAHs was done on a HP 5890 series II GC fitted with a HP 5971A mass spectro-meter. A 30 m;0.25 mm i.d.;0.25m film thickness HP-5ms capillary column was used with temperature programming from an initial temperature held at 903C for 2 min before commencing a 73C min\1to 2853C, with a final time of 20 min. The split/
splitless injector was held at 2803C and operated in splitless mode with the split valve closed for 1 min following sample injection. The split flow was set at 40 mL min\1, and the mass spectrometer transfer line was maintained at 2803C. Electron
impact ionization at 70 eV with an electron multiplier voltage set at 1500 V was used while operating in single-ion monitoring (SIM) mode.
Box 8 Solid phase extraction of phenols from water.
Extraction conditions Sample volume: 25 mL SPE sorbent: PS-DVB, 230 mg
SPE conditions: conditioning, 5 mL of acetonitrile followed by 5 mL of water; sample loading; interference elution, 2 mL of water; and analyte elution, 4 mL of acetonitrile.
Comments: sample extract made up to 10 mL with water.
Analysis by HPLC
Separation and quantitation was achieved using a 25 cm;4.6 mm id ODS2 column with UV detection at 275 nm. The mobile phase was operated under isocratic conditions acetonitrile}H2O}acetic acid (40#59#1) at a flow rate of 1 mL min\1.
A 100L Rheodyne injection loop was used to introduce samples and standards on to the column (353C).
Typical results: Madier C (1997) BSc project, UNN, Newcastle upon Tyne, UK. Analysis of phenol, 4-nitrophenol and 2-methylphenol.
Calibration range: 0}400 ng mL\1
Box 9 Solid phase microextraction of BTEX from water. Extraction conditions Sample volume: 10 mL
Fibre: 100m polydimethylsiloxane
Conditions: SPME: fibre inserted into either the sample or headspace above the sample (with/without stirring; with/without salt) for varying amounts of time.
Analysis by GC
Separation and identification of BTEX was done on a Carlo Erba HRGC 5300 Mega Series with split/splitless injection and flame ionization detection. A 30 m;0.25 mm i.d.;0.1m film thickness DB-5 capillary column was used with temperature
programming from an initial temperature held at 503C for 3 min before commencing a 163C min\1to 1203C with a final hold time of
7 min. The detector temperature was set at 2503C.
Box 10 Purge and trap (P&T) of BTEX from water.
Extraction conditions Sample volume: 2}10 mL
P&T conditions: Sample sparged for 2}5 min using N2. BTEXs trapped on Tenax trap maintained at 203C for 1}5 min. Analytes desorbed by rapid heating to 2603C for 1 min.
Comments: GC column initially maintained at 503C to concentrate analytes.
Analysis by GC
Separation and identification of BTEX was done on a Carlo Erba HRGC 5300 Mega Series with split/splitless injection and flame ionization detection. A 30 m;0.25 mm i.d.;0.1m film thickness DB-5 capillary column was used with temperature programming from an initial temperature held at 503C for 3 min before commencing a 163C min\1to 1203C with a final hold
time of 7 min. The detector temperature was set at 2503C.
Typical results: Ahmed HK (1996), MSc dissertation, University of Northumbria at Newcastle, UK.
See also: I/Extraction; Chromatography: Thin-Layer (Planar): Theory of Thin-Layer (Planar) Chromatography. Extraction: Analytical Extractions; Analytical Inorganic Extractions; Microwave-Assisted Extraction; Solid-Phase Extraction; Solid-Phase Microextraction; Solvent Based Separation; Steam Distillation; Supercritical Fluid Extrac-tion; Ultrasound Extractions. III/Airborne Samples: Solid-Phase Extraction. Bioanalytical Applications: Solid-Phase Extraction. Drugs of Abuse: Solid-Phase Extraction. Environmental Applications: Solid-Phase Microextraction; Soxhlet Extraction; Supercritical Fluid Extraction. Herbicides: Solid-Phase Extraction. Im-mobilised Boronic Acids: Extraction. Immunoaffinity Extraction. Molecular Imprints for Solid-Phase Extrac-tion. Multiresidue Methods: Extraction. On-line
Sample Preparation: Supercritical Fluid Extraction. Pesticides: Extraction from Water. Phenols: Solid-Phase Extraction. Pressurized Fluid Extraction: Non-Environ-mental Applications. Solid-Phase Extraction with Discs. Sorbent Selection for Solid-Phase Extraction. Appendix: 2/Essential Guides to Method Develop-ment in Solid-Phase Extraction.
Further Reading
Dean JR (1998) Extraction Methods for Environmental Analysis. Chichester. John Wiley and Sons.
Handley AJ (ed.) (1999) Extraction Methods in Organic Analysis. ShefReld: ShefReld Academic Press.
Hansen CM (1967)Journal of Paint Technology39: 104. Pawliszyn J (1997) Solid Phase Microextraction: Theory
and Practice. New York: Wiley-VCH.
Pawliszyn J (1999)Applications of Solid Phase Microextrac-tion. Cambridge: Royal Society of Chemistry, Cambridge.
Ramsey ED (1998) Analytical Supercritical Fluid Ex-traction Techniques. London: Kluwer Academic Pub-lishers.
Thurman EM and Mills MS (1998) Solid Phase Ex-traction: Principles and Practice. New York: Wiley-Interscience.
van Krevelen DW and Hoftzyer PJ (1976)Properties of Polymers; Their Estimation and Correlation with Chemical Structure. Amsterdam: Elsevier.
ESSENTIAL GUIDES TO METHOD
DEVELOPMENT IN FLOTATION
E. Woodburn, UMIST, Manchester, UK
Copyright
^
2000 Academic PressGeneral
This article is designed to develop methods for an
interested non-specialist, by showing how they can be
used as a basis for a Chemical Engineering Unit
Op-erations course.
Flotation is practised extensively in industry. The
technique requires a detailed knowledge in physical
metallurgy, the physical chemistry of surfaces, a
com-petence both in mathematics and practical
hydro-dynamics.
The operation is based simply on the attachment of
an air bubble to either a small or low-density particle,
or to a liquid droplet.
Method 1: Selective Separation
Mineral
S
otation has by far the greatest usage,
pro-cessing 20 billion tons per year; however the process
of delinking newsprint is currently at about 25
mil-lion tons per year and is expected to grow signi
R
-cantly in the next decade. In these operations the
selective attachment of a bubble to the valuable or an
unwanted component of a particle is required. In
de-inking, this refers to the removal of ink particles
from cellulosic
R
bres. For mineral processing, a
high-er degree of selectivity is required, to recovhigh-er a
valu-able particle from a suspension of waste particles.
This operation is very seldom used on its own but is
part of a
S
owsheet in which, after pretreatment which
includes size reduction, a solid suspension in water is
fed to the
S
otation circuit.
In the circuit, cells may be arranged in sequence
with each successive cell treating the concentrate
from the previous one to improve its purity; this is,
called ‘roughing’. The
R
nal concentrate from the
rougher bank is fed to a bank of ‘cleaning’ cells.
The reject stream from the last of the cleaning cells
is itself recycled to improve the
R
nal recovery and
is called ‘scavenging’. The concentrate from the
R
nal scavenger stream is recirculated to the feed of the
R
rst of the rougher cells. The waste from the
R
nal
scavenging cell is discharged as the overall plant
waste. This may be recycled, or treated to minimize
its environmental impact. The
R
nal cleaner
concen-trate is essentially the plant product, although it may
also have to be processed possibly by recleaning and
drying.
In waste paper, de-inking the ink-rich stream
tail-ings appears in what in mineral processing is the
concentrate and the de-inked paper in what is usually
the mineral processing tailings.
Method 2: Non-Selective Separations