Munich Personal RePEc Archive
Measuring Competition in Romania
-Basic Principles and Extensions
Cocioc, Paul
Babes-Bolyai University
2014
Online at
https://mpra.ub.uni-muenchen.de/83552/
mEasuriNg COmpETiTiON iN rOmaNia – BasiC
priNCiplEs aNd ExTENsiONs
Paul CoCIoC
Abstract: The paper present a brief analyze of tools used in estimating competition in Romania from the perspectives of economic theories. From classical index such Concentration ratio or Herfindahl-Hirschman index to extensions as Average relative size of firm to some new proposals from Romanian economic literature. For all commented indicators are presented some data analysis and in particular on the correlation between number of firms and concentration. The main conclusions are in the direction of an aggregate index as sole realistic possibility to characterize the multi-dimensional aspects of competition (market structure, economic process, and strategic behavior) correlated with the critical observations presented.
Key words: competition; competition index; concentration ratio; market structure; firm size
JEL Classification: B41; D43; K21; L11; L41.
Introduction
For a long period competition have no particular meaning in economics. The common sense of (free) rivalry between two (or more) people was the only understanding of economic competition too. The classical views of competition find their basis into the Chapter 7 of Book 2 of the famous Adam Smith’s “Wealth of Nations”. Even if it was one of the most used notions in economic literature, the concept
Babeş-Bolyai University, Faculty of Economics and Business Administration, Cluj-Napoca, Romania
Please cite this article as:
Cocioc, P., 2014. Measuring Competition in Romania-Basic Principles and Extensions.
of competition did not begin to receive an explicit and systematic attention in the main stream of economics until the last third of 19th century. Till than his treats was an intuitive one and only a sufficient large number of firms was considered enough to competition works. The perfect competition model was the result of the Neoclassical Schools approaches (Stigler, 1957).
The main ideas developed ever since regarding several aspects: (1) Rivalry as general sense of competition is a rivalry into economic fields and by consequence competition has always economic objectives. (2) Competition is a way of thinking, understanding and conduct entire economic life and activity as well as a state of being. (3) It exists and works only in relation with economic freedom: we can talk about competition in the full sense of the term only from the moment in which market economy appears and only related to (a free) market. All other references to some types of competition before that, or with non-market economic restrictions’ are an indication utmost to a limited competition. (4) Competition could be and it was also seen as a contest, a race between equal or unequal economic subjects as well as a game, a game with a set of players (and a set of non-players), with rules, with (random) processes and of course with winners and losers. (5) Competition could also mean economic confrontation, struggle, conflict and even war. In real economic life, competition has been often equated with the act or process of defeating (and sometimes - destroying) rivals.
Competition was generally analyzed by three approaches (related in many respects):
y Market structure (in which the number and size of firms acting on the market represent the central defining element);
y Economic process or mechanism (where a sufficient market supply at low and relatively constant real prices are enough for competition to exist) and
y Business strategies of the firms (fairness and positive competitive tools used at all time are the key elements).
accept it existence (nearly) independent from the number of rivals. Even if there are some evidences of a workable competition in markets with few competitors several restrictions are indispensable before any generalization. Connecting number of active firms to intensity of competition remains an important tool in any contemporary market study. That would be the starting point of our analysis too. Some extensions would be made in direction of estimating concentration related to the number of competitors as well as some comments on optimum number of firms on a market.
2. Methodological issues
Several contributions in Romanian economic literature to compe-tition we found at Iancu (1992), Cocioc (2000a) or Mosteanu (2000), and more recent to Dima (2009) or Paun and Prisecaru (2013). Practical studies on specific market were also made by the national competitive authorities, but results were not entirely accessible for public use. We note that in Laws the aspects of competition was subject of more literature contributions, but such an approach is not our target.
In 1996 the Competition Act (21/1996) was adopted by the Romanian Parliament, represented a major stone mark in the history of competition policies in our country. An agency charged with market competition active survey was established: Romanian Competition Council [C.C.]. The new competition rules were according to the EU and international standards. Article 5 of Romanian Law was similar to the former article 85 of the Rome Treaty (present article 81 of the Maastricht Treaty) and article 6 to the former article 86 (present article 82). The final goals were to enforce such practices to protect both producers and consumers from any kind of anti competitive behaviors and assure real and effective competitive markets. Basically that means permanent and fully supplied markets with highest possible quality goods and services at the lowest possible prices.
Our paper did not intent to present case decision analyses. The main objective is to present and analyzing the existing framework of estimating competition in Romania, to compare it with similar practices as well as economic theory, and to comment some recent developments from academic and CC including a brief presentation of a new instrument proposed.
The sources of data presented within this paper are Romanian Statistical Yearbook and TEMPO on-line database of the Romanian National Institute of Statistics, if otherwise is not specified.
CANE Rev.2 (implemented through the Order no. 337/2007, published in the Official Journal no. 293/2007 and revised in the Official Journal no. 403/2008) comprises 21 sections with 88 divisions divided in groups and classes. In our investigation we have considered the activity from 77 divisions comprises enterprises with main activity in industry, construction, trade and other non-financial services. CANE Rev.2 observes the European standards, being fully compliant with the Nomenclature of Activities from the European Community NACE Rev. 2. For the previous period we examine the same industries grouping in 50 sections in conformity with the older classification of activities in the national economy (CANE Rev. 1 - approved through Order no. 601/2002 published in the Official Journal no. 908/2002 on CANE updating, approved by Government Decision no.656/1997). CANE Rev. 1 was fully complies with the Nomenclature of Activities of the European Community NACE Rev. 1.1. We will use the acronym CANE1 for CANE Rev.1 and respectively CANE2 for CANE Rev.2 terms.
For some aspects we focused on the period before 2008 to avoid the impact of economic crisis, especially on the number of firms. We tried to separate in this case only the “normal” evolution under competitive conditions. For other aspects (basically stationary analysis) we focused on recent years.
There are obvious differences between market and industry. The representative market in the sense of C.C. analyses and investigations are – as a general rule - a sub-division of an industry, with a significant larger homogeneity (especially concerning products) and more geographically localized. As a general rule, from a CANE point of view, several markets are grouped into a class, integrating at national level different local market of the same product and/or markets of similar but not identically products. With the exception of banking and some particular C.C.’s studies and investigations, generally the available data does not exist at the level of market. For this reason we try to present a view of competition at the level of industry even the conclusions are noticeably not so substantial and limited.
to determine precisely the relevant market and (2) the multi-product multi-market firm and the way of splitting its production on several markets. For practical reason the basic assumption is that one firm act in only one national integrated market/industry. In this respect, the main activity of an enterprise is established depending on the goods or services whose production involves the largest part of human resources or which supply the highest revenues of the enterprise.
The size of an enterprise is assessed according to the average number of employees during the reference period. In accordance with Eurostat criteria the following intervals are used: micro-enterprises (0-9 employees); small enterprises (10-49 employees); medium enterprises (50-249 employees) and large enterprises (250 employees and over). For particular reasons in analyzing dimensional aspect of market and market share will separate in some circumstances a group of very large (monopoly or oligopoly, CR5 over 90%) units defining by over 1000 employees and another one between 500 and 1000 employees (with similar conditions on concentration). CR5 represent the aggregate concentration ratio of the top 5 largest firms on the market and CR20 for the first 20 competitors. The data are calculated in relation with both employment and outcomes (turnovers).
3. On the competition various measures
In our opinion too, an estimation of competition level is not possible by a unique simple indicator (since competition is a complex phenomenon which implies several dimensions, quantitative as well as qualitative). It is necessary to characterize different aspects of what we may call the competition environment (market, market related and non-market environment) and it specific conditions, regarding at least:
y The degree of existence of the relative conditions of the perfect (pure) competition (or at least of the minimum requirements of the modern theories or modern interpretations of the classics) y Market structure and its dynamics (e.g. concentration,
econo-mic and monopoly power)
y The economic and social efficiency of those mechanisms. Basically it is a global description and measure of the market structure (and its dynamics) as well as behavioral approaches.
Classical Roots
Traditionally competition was evaluated in relation with the classical conditions of perfect (or pure) competition model. As a general knowledge such elements regarding to: atomicity (many sellers and buyers), market transparency (perfect information), free entry (and exit), mobility and product homogeneity. As a result, the perfectly competitive market has the following outcomes: the actions of any single buyer or seller in the market have a negligible impact on the market price and practically each and every of them takes the market price as given (competitors are price taker).
The main indicators used in such approach are: 1. Number of economic competitors
Chronological it was the first and the most used indicator in estimating the competition level.
Almost nothing except a sufficient large number of firms is necessary to competition. Even if the “sufficient large number” wasn’t precisely definite (theoretically in the sense of Cournot’ analyses this number must be infinite, obvious a presumption with no practical connection), the idea of less competition between few and more and increasing competition among many remain as a fundamental demand for an effective market. Another common presumption is that any anticompetitive behavior is more likely possible the smaller is the number of firms in an industry. Cleary, the possibility of global arrangements is decline in the conditions of a significant large number of relative equal firms in the market. In addition a common action of only a part of firms (a more reasonable possibility) wouldn’t have a major impact on the market.
Data on numbers of active firms are available since 1997 correlated with dimensional aspect such CR5 and CR20.
yearly relative variations. Larger average rates were in: Real estates (plus 29.27% in average, corresponding to a 15,88 times increase!), Coal mining and preparation (in this particular case with no impact on industry’ concentration), Other services mainly rendered to enterprises, Post and telecommunications and Renting machinery, equipment and individual household appliances (above 20% each). Lowest average levels were relative large industries such: Food & beverages and Textiles (less than 1% each), Chemicals and Wholesales (less than 2% each).
Only in one industry - Retail (except motor vehicles and motor-cycles) - the total number of firms was lower in 2008 (135993) by comparison with 1997 (162503). But a level closed to the average of the period (135806 active units). The downfall was in 1998 and 1999. In 2000 the registered number was 139636. In all other situations (with the exception of regulated monopoly of mining of uranium and thorium ores) the number of firms has increase during analyzed period. Moreover, in 37 from the total of 50 CANE1 structured industries the highest level was registered in 2008 (74% of total cases), and if we take into consideration and the year before the level rise to 84% (42 industries).
Table 1. Years from period 1997-2008 with maximum number of firms in a industry*
Year 1997 2003 2004 2005 2007 2008 Total
Number of
industries 1 1 5 3 3 37 50
Percentage 2 2 10 6 6 74 100
Source: TEMPO Online Database
* Most recent year with highest number of firms (if the number of firms in an industry was the same for several years).
not (so) visible. Further information and a more detailed study are necessary for a correct and complete view on freedom of access.
Such an evolution is not different from the basic thesis of economic literature on market entries. Pepall and al (1999) presented some stylized facts on the topic: (1) entry is common (computed by entry rate); (2) small scale entry (individual as well as aggregate market share of entrants); (3) survival rate is relatively low (on decade evaluation); and (4) rate of entry is highly correlated with the rate of exit.
2. Size of the active firms
If a commodity is produced by several firms, each and every one of them are in competition one with other. Competition forms, instruments and strategies applied are often a consequences of the size (sizes) of the market leader (or top firms). This dimension (of the main firm or cumulative of the largest ones) practically defines the dimension of the remaining area of competition for all other competitors. It has also a crucial role in what we may define as the liberty of action, of choices, especially on competitive strategies and practices, in the sense of distinction made between unstructured or structured competition (see Burke and al., 1988). Larger remaining area is characteristic for market closer to unstructured competition, more like neo-classical (perfect) competitive markets. This implies no significant individual power of choices; less (or no) abusive practices and mainly price strategies under the general obey to the laws of the market. Larger area for dominant firm or group allows to select different strategies and to exercise a considerable market power. Those imperfect competitive conditions are more likely to characterize the majority of the contemporary industries and explain the fact that today business analyses and strategies are formulated under structured competition.
In the case of 77 industries in CANE Rev.2 classification system, the data for 2011 can be summarizing as follows:
y 1 industry with very large average firms (500-1000 employees and more than 80% for CR5): Mining of coal and lignite (550.5 employees and 98.7% CR5 )
y 1 industry with large average firms: and Manufacture of motor vehicles, trailers and semi-trailers (292.6).
y 13 industries with medium average level (range between 50.2 to 162 employees in average per units)
y 26 industries with low average level (range between 11.1 to 43.2 employees in average per units)
y 35 industries with very low average level (range between 1.8 to 9.8 employees in average per units)
Except for the upper category, this classification is conforming to Eurostat in terms specified above. The lower levels are registered in: Creative, arts and entertainment activities, Legal and accounting activities, veterinary activities, Other professional, scientific and technical activities, Social work activities without accommodation, Activities of head offices; management consultancy activities, Repair of computers and personal and household goods, Real estate activities, Sports activities and amusement and recreation activities, Rental and leasing activities, Travel agency, tour operator and other reservation service and related activities, Information service activities. The average size related to labor force is mainly a result of technological conditions with no direct correlation with industry’ concentration. It offers an image on the dimension of the representative firm and can be used as an acceptable proxy of it.
Normally, the size of representative firm is defined in terms of minimum possible size related to costs. Minimum condition implies maximum number of competitors on the market and practically defined that “large number” of classical theories. Two approaches are stated:
(1) minimum feasible size, reflect the level of production under which it is impossible for the firm to survive on the market (it is generally identified with de production at the minimum average variable cost);
obtain profits (basically the production corresponding to the point of minimum average total cost).
The minimum size can be objectively large. Corresponding on one hand to that minimum size and on the other hand to the market demand, we can determine (as it was suggest by Cocioc, 2000b) the maximum number of firms who can survive on the market, respectively the maximum number of efficient firms. First reflect the short run conditions and the second one the long terms. As many as scale economies allow. This is the optimum number of firm on a market and in the same time the number correspondent to a normal competition (defined as perfect competition). By a simply comparison of the effective number of competitors with this optimum we can appreciate de nature of competition (imperfect/restricted, perfect/ normal or excess competition).
In addition, the size of firms and especially dimensional inequalities among competitors offer the image o an even or an uneven competition.
Modifications in the number and size of firms within industry over time are an important tool in analyzing the way in which an industry structure is changing.
Measure of the market size of a firm it is classically defined by the share of its capital or its production output in the total of industry as well as by the number of firms’ employees in the industry’s labor force.
3. Industry Concentration: Concentration Ratio (CR)
The most simple measure of concentration is relates to average relative market share of the firm (ARSF). That is:
100
ARSF NF
= or ARSF 1 NF
=
where: NF is the total number of firms in the market.
The first expression counts in a percentage form and second is calculated as coefficient. A lower level indicates less concentration. A decrease in the firms’ number will increase concentration.
Table 2. Average relative size of firm for selected industries in 2008 and 2011
Large average relative scale of firms
ArSF Low average relative scale of firms
ArSF
2008 2011 2008 2011
Extraction of oil and
natural gas 10.00 3.85 Manufacture of food products 0.011 0.013 Tobacco products 6.25 11.11 Legal and accounting activities 0.011 0.013 Mining of metal ores 4.00 4.00 Real estate activities 0.007 0.008 Manufacture of coke and
refined petroleum products 3.03 2.50
Architectural and engineering; technical
testing and analysis 0.007 0.008 Services of
decontamination 2.86 1.79
Wholesale. retail and repair of motor vehicles
and motorcycles 0.006 0.007 Residential care activities 2.70 1.41 Food and beverage service 0.005 0.006 Mining of coal and lignite 2.63 3.23 Activities of head offices; management consultancy 0.005 0.007 Air transport 1.79 1.61 Specialised constructions 0.004 0.005 Social work activities 1.69 1.39 Construction of buildings 0.003 0.005 Mining support services 0.97 0.85 Land and pipelines transport 0.003 0.004 Pharmaceutical products and
pharmaceutical preparations 0.75 0.85 Wholesale except of motor vehicles and motorcycles 0.002 0.002 Used water management 0.60 0.57 Retail, except motor vehicles 0.001 0.001
Concentration ratio measure the cumulate share of the largest firms in a market. The well-known formula is:
1
k
k i
i
CR s
=
=
∑
where k = 1, 2, 4, 5, 8, 10 or 20 (several usual value for different countries specifics). As mentioned before for Romania, the Statistical Yearbook gives observation on CR5 and CR20 (both on turnover and employment).
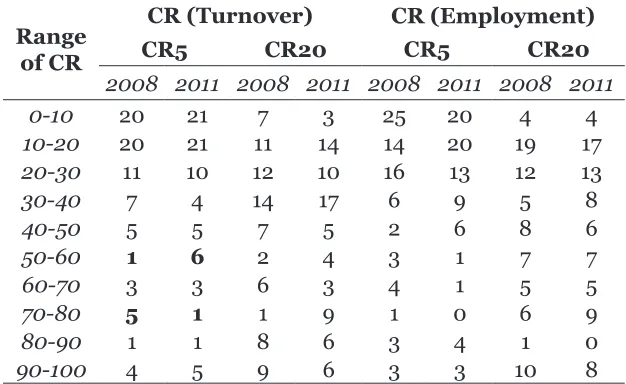
half of the total analyzed industries). The situation doesn’t change significantly in 2011, when 55 industries have a CR5 less than 30% (plus 4 industries) from which 39 below 20%. Level over 70% are registered for 10 cases in 2008 (4 over 90% and 5 above 80%) and only in 7 situations in 2011 (now there are 5 above 90%).
Table 3.Distribution of CR5 and CR20 (output, employment) in 2008 and 2011
Range
of Cr
CR (Turnover) CR (employment)
CR5 CR20 CR5 CR20
2008 2011 2008 2011 2008 2011 2008 2011
0-10 20 21 7 3 25 20 4 4
10-20 20 21 11 14 14 20 19 17
20-30 11 10 12 10 16 13 12 13
30-40 7 4 14 17 6 9 5 8
40-50 5 5 7 5 2 6 8 6
50-60 1 6 2 4 3 1 7 7
60-70 3 3 6 3 4 1 5 5
70-80 5 1 1 9 1 0 6 9
80-90 1 1 8 6 3 4 1 0
90-100 4 5 9 6 3 3 10 8
Source: Statistical Yearbook 2009 and 2012
Differential concentration was explained by various theories. Economies to scale were one of the most important ideas. The efficiency associated with market concentration as well as with the relative firm size can be approximate by the inequality:
Y L
k k
CR >CR Concentration ratio of the output ( Y
k
CR ) has a higher level in comparison with concentration ratio of labor force ( L
k
CR ) in those industries where productivity is upon average (ωk ϖ ). It implies that a smaller group of employees produced a larger share of output.
A comparative situation is presented below:
eficiency k=5 k=20
2008 2011 2008 2011
40 45 43 45
7 2 10 4
30 30 24 28
The numbers of industries in which labor productivity is above or around average exceed in all time the number of less efficient at both levels of analysis.
In this approach the extremely efficient industries (intensive labor activities) was in 2008 for CR5 analysis: Telecommunications, Used water collection and purification, Legal and accounting activities, Social work activities without accommodation, Water catchment, treatment and distribution and Sports activities and amusement and recreation activities (with differences that exceed 15%). Maybe surprisingly, only a few of significantly efficient industries it can be find in the list of large size firm industries. The less efficient activities (extensive labor industries) are Warehousing and support activities for transportation, Electricity, gas, steam and air conditioning production and supply, Other professional, scientific and technical activities and Waste collection, purification and disposal; activities of recycling materials recovery (with negative differences of more than 15%). At CR20 activities like: Manufacture of computer, electronic and
Y L
k k
CR ≈CR
Y L
k k
CR >CR
Y L
k k
optical products, Manufacture of beverages and Retail, except motor vehicles and motorcycles added to the list of highly efficient industries. In 2011 in the top we find Computer, electronic and optical products and Rubber and plastic products (more than 24% differences) at CR5 level and Wood and of products of wood and cork, except furniture, Computer, electronic and optical products, Legal and accounting activities (above 20%) at CR20. Negative situation at CR5 level for Postal and courier activities and Warehousing and support activities for transportation and at CR20 level for Electricity, gas, steam and air conditioning production and supply, Warehousing and support activities for transportation and Waste collection, purification and disposal; activities of recycling materials recovery (in all cases more than -20%).
As we already concluded, the relation between number of competitors and concentration is a direct one. The case of Romania is no exception. For 2011 under CANE2 conditions, the situation is described below. We have eliminated the data for one industry: retail (see above mentioned comments). The situation of the other sensitive industry (also discussed) was solved by including it into another section by CANE revision.
Figure 1.Relation between number of competitors and concentration (CR5) in 2011 (on turnover in left and on
employment in right)
Correlation: NF; CR5
Pearson correlation of NF and CR5 = -0.373 p-value = 0.001
Spearman Rho: NF; CR5
Review of Economic Studies and Research Virgil Madgearu, 2014, no. 1 Starting with turnovers case, a simple visual analyze of the graphic representation (scatter plot) denote a non-linear relation. value of Pearson’ coefficient (0.373<0.4) confirm a weak linear correlation. Spearman coefficient suggests a strong (non-linear) relation (-0.808). Coefficient being negative, concentration (measures in this case by CR5) tends to decrease when increases number of competitors (NF – average number of active firms). Facts conform to the classical theories.
A power or a logarithmic function seems to fit best. In these conditions a fair estimation of the trend line (model of curvature) could be:
0.418 380.79
y= ⋅x− (1)
with R2= 0.6485. where:
y y represents industry concentration (express by CR5 on turnovers in this case) and
y x is the average number of active firms in respectively industry.
A similar approach for the CR5 base on employment leads us to an estimated form of trend line function:
0.398 318.82
y= ⋅x− (2)
with R2 = 0.6598.
We note that y represent here the CR5 of employment.
Even if we introduce in relation and data for the initially excluded market the results doesn’t change significantly. The relation (1) became:
0.397 331.97
y= ⋅x− , R2 = 0.6246 And (2):
0.386
296.32
y= ⋅x− , R2 = 0.6573
elements, especially the production’ conditions (e.g. minimum size and economies of scale). Common consequences: in two industries with similar number of firms the result can be appreciably different under those real terms. Estimations are made in correlation with the conditions from all industries and not related with the specificity from a particular one.
Such approximations can be done for all periods. Even if those functions are not measures of competition, the changes of their shape could represent a tool in appreciating the evolution of competitors’ number over concentration. Starting from a particular form established at one time moment, any major modifications denote significant variance of correlation explained mainly by technological changes, business cycle or subjective behavior. Elements which can influence the profile of expected response (and the expectations are a relative constant expression of the correlation function). And it makes visible competition’s transformations in the industries.
Measures like ARSF and CR ignores the dispersion among the firms’ market shares. Concentration increase when the number of firms is increasing and remain constant to any variation in the degree of symmetry between them. Such assertion is valid only if the firms’ market share is believed to be unrelated rather than determined by the firms’ dimensional differences or other inherent characteristics.
4. Industry Concentration: Herfindahl-Hirschman Index (HHI) HHI provides integrated information about market shares and asymmetry of the market shares as an expression of dimensional differences between firms. It is calculated as a sum of squared of the market share of each and every competitor:
2
1
n
i i
HHI s
=
=
∑
Unlike the previous indicators, the HHI will vary if there is a change in market share among competitors (especially for the largest firms).
For Romania, C.C. has determined HHI level for several markets during sectors analyses, market investigations and mergers & fusions approval procedure. A global and systematic calculation for all markets (or at least at a national integrated market for a specific product or group of similar products) wasn’t made. The necessary data was not possible to collect in fully in conditions in which the legal framework limits access to data except for investigative procedures.
Table 4. hhI for selected markets and/or industries
Industry Year Level
Power-generation market (a) 2010 1947
Electricity retail market (a) 2010 1333
Gas retail market (a) 2010 1679
Banking (total assets) (b) 2010 1053
Banking (Consumer credits) (b) 2010 1438
Banking (Credits for undertakings) (b) (c) 2009/2010/2011 1653/1803/1964
Drug Production (b) 2010 < 500
Drug wholesale (b) 2009 < 950
Electricity supply (c) 2009/2010/2011 559/518/395
Railway transportation of
commodities (c) 2009/2010/2011 2694/2421/ 2691
Banking (long term deposits) (c) 2009/2010/2011 1017/1179/1486 Source:(a)http://ec.europa.eu/energy/gas_electricity/doc/ro_energy_market_ 2011_en.pdf; (b)Competition Council (2011); (c)Competition Council (2012).
The HHI is a most commonly accepted and used measure of market concentration by competition authorities during investigative procedure and market analyzes. The range of interpretation can vary from country to country. In Romania the range are similar with those from other E.U.’s countries within a common policy of competition (see Table 5).
Table 5. Interpretation of hhI’s values
Concentration level HHI level
EC* DoJ / FTC** Other Low < 1000 < 1500 < 750 Medium/moderate 1000-2000 1500-2500 750-1800 High > 2000 > 2500 1800-5000
very high - - > 5000
* EC - European Commission;
** DoJ / FTC – Department of Justice and Federal Trade Commission
An alternative instrument to HHI is the Hall-Tideman Index (HTI). It also includes the market shares of all the firms on the market and is sensitive to asymmetric dimension of competitors in an ordinal approach.
1 1
2 n i 1
i HTI
s
=
=
−
∑
where: i represent the position of the firm based on its market share. If HHI is considered to be more sensitive to firms with large market share, HTI is strongly influenced by competitors holding small market shares.
New instruments in a critical perspective
C.C. proposed in it last Annual Report (2013) a synthetic index for measuring competition – or more specific the competitive nature of industries: the Aggregate Index of Competitive Pressure (AICP). The index is constructed in relation with the foundations made by Paun and Prisecaru in their paper (2013). Such an instrument exists – as it is specified in the quoted materials – and it is already used by other competition authorities (e.g. Netherlands, UK, Denmark or Sweden). We have in mind not an identical tool but a similar one, with a same aggregative principle. Several studies (Petit, 2012; Nielsen et al., 2007) offer a theoretical foundation and/or a critical perspective of this approach, as indicated. In the following section we present a brief description of the method proposed as well as its result for Romanian industries. Some critical observations especially concerning some constitutive indicators and basic assumptions would be made too.
Such an index measures the propensity to competition of markets (or industries) and not necessaries the actual degree (or level) of competition. It simply offers information about the analyzed industry position related to an ideal situation which facilitates the full manifestation of competition. In practice it must be corroborated with other available data on the market (industry), but it could represent a reference for CC regarding the existence of some competitive problems in a sector of economy.
shares and capacity constrains; market growth and volatility/stability of market shares; frequent interactions and multimarket contacts; structural links (integration especially vertical integration); profitability; symmetrical costs; marketing spending; ability to retaliate and removal of “maverick”; stable market demand; price level and margins relative to other countries; impact of business (professional) associations and import rate (normal importance). A significant part of these indicators are largely used in competition analyses. Many of them are commonly considered in economic literature to describe the perfect competition. In an opposite understanding it describes the conditions which facilitate cartels and tacit coordination (see for more details Decker 2009), as main anti-competitive practices in today markets.
Each of the indicators mentioned above was measured on a 7 point Linkert scale, using information available to the CC (mainly because there are some indicators with no numerical form estimations). The AICP aggregates indicators using Borda’s method. It was normalized (computed as a percentage of the total maximum possible) so that comparisons became possible between markets/ industries (see for more details and arguments the original paper of Paun and Prisacaru, 2013).
of natural gas; Distribution of LPG tanks; Bank cards – issuing side. Areas in which some investigations was made by CC. We note that the level of analyze was in some case the industry level according CANE system and in some cases sub-divisions larger than representative markets in the definition of competition law enforcement.
Even if aggregation method is slightly change, for instance in idea of a no differentiation in the importance of the basic indicators as well as grouping them in more classes the differences was proved not to be significant. Repeating periodically the calculus for AICP in those industries we could have an image of the changes of competition degree, if there is more or less competition. A correlation of the AICP’s
changes with structural or other market modifications could improve the content and aggregation procedure, to construct a more sensitive and representative index. Also it could offer orientation for public authorities where to action and what is the impact of actions taken.
Some considerations over this approach are required. First, an aggregate index or indicator is the only way to assure a comprehensive characterization of competition. The concrete form of integrating several basic aspects (primary indicators) could be subject of discussion. Other methods are available, but an additional process appears to be the best way to do it.
Second, the content of such a composite index is a more import issue from our perspective. The list of basic indicators, the way of evaluating their impact and as result the values of associated coefficients of importance, there integration into some partial aggregated indexes and their significance are issues to be more clearly expressed and developed. Concerning the present list and basic assumptions made we have some specific comments:
restricted by supplementary conditions. Those terms must specified more precious when and where this is possible (e.g. on what kind of markets, what particular situations, which moment). Otherwise it can negatively affect the significance of the composite index. Even if other papers have a similar approach we consider that more transparency also denote an easily and accurately way to observe and identify anti-competitive practices.
Informational asymmetry is one of the problems which undoubtedly stimulate anti-competitive behaviors and determine imperfections to competition. Even it is difficult to estimate it, it was not taken into consideration at all.
Market share symmetry and status-quo (stability of market shares) are very important aspects of market competition characte-ristics in our opinion. Symmetry basically denotes the nature of an even or uneven competition. Tacit collusion or explicit coordination would be just two different possible results depending on particular situations. A more direct relation between dimensional differences (size gap) and specific competition behavior are imperative. We appreciate that the measure of size asymmetries is possible to be made by using a HHI’s mechanism and/or a form of Gini Index. The calculated levels must be ulterior correlated with several competitors’ strategic responses. In the present paper we did not intent to offer such a development.
∑
−= 1
2 1
0 1
i i s s s
δ
where: 1
i
s is the actual market share of the i firm; s0i is the initial market share of the same firm.
A more analytical approach on this particular item would be the subject of further developments in another paper. For now we must note only the idea that any change in market share (at least at individual level) should be correlated with market growth and concentration. If individual growth is superior to the market growth rate, it is obvious a higher concentration level and an improvement in market share of the firm.
On the symmetry of costs, the element of comparing to must be the representative firm in the market. We can define a normal and positive competition only in rapport with this firm. Similar (even identical) costs are an implicit condition of perfect competition and only in particular terms symmetry could stimulate coordinative behaviors (e.g. extremely limited number of firms in the market or at least a sufficient large group of firms). The key to solving imply a conditional assumption: symmetry of cost related to number
of firms. Large number performs more likely a positive impact on competition and small number the opposite. A special note: to identify the representative production condition is challenging task especially in non-perfect information markets. Average condition could be a sufficient proxy in this case.
4. Some concluding remarks
The analyses of competition are made at the level of industries not at the level of markets. The lack of data is the main explanation. Even if such approach is closer to a top to bottom one and offer to little comparing to a market to market and/or a bottom to top analyze, it assure a general and sufficient image of the intensity and type of competition.
Competition should be appreciated starting with basic quantitative variables (competitors, market size). Concentration and dimensional asymmetry represents the main elements in defining what we may name an opportunity model of competing. Strategies are just a result of an adaptive behavior to such structural boundaries. Even or uneven competition, structured or unstructured, price or non-price, homogeneous or differentiated, open or close are in many way connected one to each other. It defines what is economically and (legally) possible to do from the firm point of view. A clear and complete description of market allows estimating the form of the competitors’ reactions. And characterize the potentiality of competing in a market.
In our vision for every market in the economy it can be indentified 3 groups of competitors: (1) Leaders; (2) Followers and (3) Others. As a general rule only the first two groups practically define competition. There for a comprehensive delimitation and analyze is of great importance (number, market size, symmetry, power, remaining areas of competition). Classical tools and some derivate instruments in appreciating concentration seem to be enough for this task. Number of firms, ARSF, CR5 and CR20 (or other level), HHI and HTI are such indicator/indexes. We tried to presents some results and limits perspective of their application to describe competition in Romanian’ industries form a critical perspective.
curvature shape. Estimating transformations we can have a measure of competitive process (in terms of intensity, alteration or ARSF).
A synthetic observation regarding AICP index is that it try to count basically (and in many respect only) the potential impact of several aspects of market over rivals’ behavior in direction of agreements and coordination. Or this is only a part of competition. Some figures describe several characteristics of market structure too. But other important aspects are absent. Elements such as abuse of dominance, predatory practices or monopoly power not seems to be present in analyze. Excess capacity and market growth are factors presents into other studies which are not visible in the model. Or an explicit analyze of entries in terms of effectiveness and not only in barriers (e.g. frequency, scale and survival rate). From our point of view a representative index of competition or competitive pressure must be redesigned by integrated two sets of observations: (1) by adding other primary indicators (in the sense of our concluding comments) and (2) by defining more strictly the assumptions on some indicators (in directions of our critical analyses from the previous section).
Other structure’s indicators suggested by economic theories could and must be use in Romania too. It should complete the competition environment analyses and/or to replace (even partially) some indicators for which there are no available data at all time. We have in mind basic competition’s indicator as Comprehensive Concentration Index (for concentration and dimensional asymmetry) or Lerner Index (for monopoly power and price variation) as well as adjusted versions of tools from other area of economic research (e.g. Gini coefficient).
Competition theory remains today - as it always was - an open-ended theory: new problems can developed or became visible or need new solutions. Measuring (or at least estimating) competition is an important step in identifying and evaluating such problems.
References
1. Alemani, E., Klein, C., Koske, I., vitale, C. and Wanner, I. (2013) “New Indicators of Competition Law and Policy in 2013 for OECD and non-OECD Countries”, OECD Economics Department Working Papers, No. 1104, OECD Publishing, [online], http://search.oecd. org/officialdocuments/publicdisplaydocumentpdf/?cote=ECO/ WKP(2013)96&docLanguage=En [12 Dec 2013].
2. Burke, T., Genn-Bash, A. and Haines, B. (1987) Competition in theory and practice, London: Croom Helm.
3. Chamberlin, E.H. (1951) “Monopolistic Competition Revisited”, Economica, vol.xvIII, no.72, Nov, pp. 343-362.
4. Cocioc, P. (2000) “Foundations of a revisited concept of perfect competition”, Studia Universitatis Babes-Bolyai seria Oeconomica, vol.xLv, no. 1.
5. Cocioc, P. (1999) Teoria concurentei in retrospectiva, Cluj-Napoca: Presa Universitara Clujana.
6. Decker, C. (2009) Economics and the Enforcement of European Competition Law, Cheltenham: Edward Elgar.
7. Dima, A.M. (2008) The limits of workable competition in real markets. The perception of Romanian companies, Proceedings of the 8th International Business Research Conference, Dubai, [online],
available: http://www.wbiconpro.com/Management/445-Dima,A. pdf [19 Apr 2013].
8. Iancu, A. (1992) Tratat de economie, vol.3, Piata, concurenta, monopol, Bucuresti: Editura Expert.
9. Ivaldi, M., Julien, B., Rey, P., Seabright, P. and Tirol, J. (2003) The Economics of Tacit Collusion, Final Report for DG Competition, European Commision, Toulouse: IDEI [online], available: http:// ec.europa.eu/competition/mergers/studies_reports/the_ economics_of_tacit_collusion_en.pdf [March 2003].
10. Karier, T. (1993) Beyond Competition. The Economics of Mergers and Monopoly Power, New York: Sharpe.
12. Nielsen, C.K., Karlsen, S. and Pederson, T.T (2007) External Report on Competition Indicators and Other relevant Methods, Summary Report, Copenhagen: Copenhagen economics, [online], available: http://www.regjeringen.no/upload/FAD/vedlegg/Konkurranse-politikk/RD_competition_indicators.pdf [18 June 2007].
13. Paun, R.A. and Prisecaru, P. (2013) “An Economic Instrument to Evaluate the (Pro)Competitive Nature of Industries: The Aggregate Index of Competitive Pressure”, Romanian Competition Journal, vol.1, no.2, pp.20-49.14. Pepall, L., Richards, D. and Norman, G. (1999) Industrial Organization: Contemporary Theory and Practice, Cincinnati: South-Western College Pub.
15. Petit, Lilian (2012) The Economic Detection Instrument of the Netherlands Competition Authority: The Competition Index, NMa Working Paper no.6, [online], available: https://www.acm.nl/nl/ download/bijlage/?id=8993 [Jan 2012].
16. Popescu, G. (2004) Evolutia gandirii economice, 3rd ed,
Cluj-Napoca, Editura Academiei Romane, Editura Cartimpex.
17. Robinson, J.v. (1980a) “What is Perfect Competition?” in Collected Economic Papers, Cambridge Mass.: M.I.T. Press, vol.1, pp.20-35. 18. Robinson, J.v. (1980b) “Imperfect Competition” in Collected
Economic Papers, Cambridge Mass.: M.I.T. Press, 1980, vol.2, pp. 222-238.
19. Robinson, J.v. (1980c) “Imperfect Competition To-day” in Collected Economic Papers, Cambridge Mass.: M.I.T. Press, 1980, vol.2, pp. 239-245.
22. Stigler, G. (1957) “Perfect Competition, Historically Contemplated”, The Journal of Political Economy, vol. Lxv, no.1, pp. 1-17.
23. Competition Council (2012) Developments in essential sectors, Bucharest, [online], available:http://www.consiliulconcurentei.ro/ uploads/docs/items/id8081/consiliul_concurentei_raport.pdf [23 Oct 2012].