Three Dimensional Surface Pattern and Chemical Composition of Mucosal Titanium Implant Compartments
7
0
0
Full text
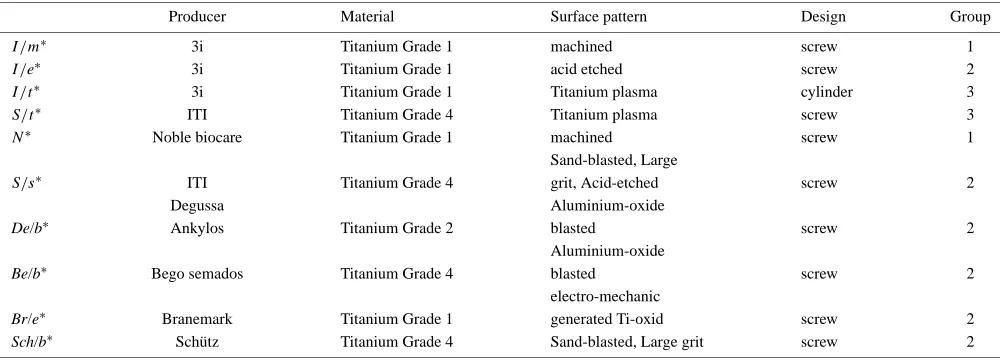
(2) Three-Dimensional Surface Pattern and Chemical Composition of Mucosal Titanium Implant Compartments. matory and growth factor mediators and bacterial pathogens associated with failing implants, as compared to healthy implants. This study found greater detection frequencies of P. nigrescens, P. micros, F. nucleatum ss vincentii, and F. nucleatum ss nucleatum, as well as significant elevations in GCF levels of PGE2 , IL-1ß, and PDGF in mouths with failing implant sites as compared to mouths with healthy control implants. Furthermore, the counts of P. nigrescens and P. micros were found to correlate with concentrations of PGE2 at a site level. It appeared that the chemical surface composition of titanium was a fundamental factor in the determination of both, the plaque quantity (thickness as well as coronal extension) and the plaque quality as well as its composition and clinical evidence. Surface-free energy, roughness and the presence of specific molecules adsorbed from the sulcus crevicular fluid onto the titanium surface are suggested to promote colonization. In this context it should be realized that an essential role of epithelium in wound healing is divide and migrate across until epithelial continuity is restored injured during surgery. After concluding the wound healing the epithelial cells have the ability to stick to the implant surface, synthesize basal lamina as well as hemidesmosomes and establish an epithelial barrier. Equally important is the capacity of a normal, uninflamed connective tissue to form an attachment to the titanium surface below the epithelium and in a more superficial location to support the junctional epithelium. The maintenance of normal connective tissues is of critical importance for normal turnover of the epithelial and connective tissue attachments to the titanium implant. The findings from these studies referred to indicate that, during wound healing, an interaction occurs between titanium dioxide on the implant surface and the “apical” part of the supra-alveolar connective tissue. Consequently, once the interaction is established there is no further epithelial migration. In summary, it appears that an optimization of soft tissue interfaces with the Ti implant surfaces is still necessary. The aim of our study was to investigate the topography, chemical composition, and roughness of titanium mucosalimplant interfaces using different surface analytical techniques.. 3037. 2. Material and Methods The entire epithelium/implant surface-compartments of 10 different implant systems were utilized as a test area. The implants were grouped into three different groups (Table 1) according to the surface treatment carried out to furnish the enossal surface, machined screws, acid etched screws, plasma sprayed cylinders, plasma sprayed screws, and sand blasted large grit acid-etched screws. The groups9) are: • Group 1. machined, smooth-surfaced (“smooth”), • Group 2. grit-blasted and/or acid-etched (“ablative”), • Group 3. Ti plasma sprayed (“TPS”), The ultramorphological analysis was carried out using Scanning Electron Microscopy (SEM), the Confocal Laser Scanning Microscopy (CLSM), X-ray photoelectron spectroscopy (XPS), Metastable Induced Electron Spectroscopy (MIES) and Optical Profilometry (Fig. 1). 2.1 SEM-analyzes Ultramorphological analysis of the surfaces was carried out using a Philips scanning electron microscope (Philips XL 30 FEG) at 20 kV. As detector the secondary electron detector was used. Prior to SEM investigation the specimens were sputtered with gold-paladium using a Bal-Tec Scd 050 sputter to achieve a better resolution. All SEM images were taken at a gas pressure of 20 Pa (0.2 mbar) using a magnification of 2000x with an image size 739 µm × 554 µm allowing correlation with the CLSM. 2.2 CLSM-analyzes The used CLSM analyzes was described in a previous publication10) in detail. Briefly, the CLSM (CLSM Aristoplan, LEICA TCS SP2 X1, Germany) focuses an laser beam (633 nm) to a small in-focus plane and records the intensity of reflection by the surface. Moving the sample stage in a vertical z direction generates a series of microscopic “tomography-like” images between the first and the last detectable light reflex.This resulted in tomographic images of 300 µm × 300 µm with each 1024 × 1024 pixels of 256 grey scales. With an objective of 50x/0.80 T, an area of. Table 1 Analyzed implants grouped into three different groups according to the surface treatment carried out to furnish the enossal surface. The Groups are: Group 1. machined, smooth-surfaced (“smooth”), Group 2. grit-blasted and/or acid-etched (“ablative”), Group 3. Ti plasma sprayed (“TPS”). Producer. Material. Surface pattern. Design. Group. 3i 3i 3i ITI Noble biocare. Titanium Grade 1 Titanium Grade 1 Titanium Grade 1 Titanium Grade 4 Titanium Grade 1. screw screw cylinder screw screw. 1 2 3 3 1. Titanium Grade 4. screw. 2. De/b∗. ITI Degussa Ankylos. Titanium Grade 2. screw. 2. Be/b∗. Bego semados. Titanium Grade 4. screw. 2. Br/e∗ Sch/b∗. Branemark Schütz. Titanium Grade 1 Titanium Grade 4. machined acid etched Titanium plasma Titanium plasma machined Sand-blasted, Large grit, Acid-etched Aluminium-oxide blasted Aluminium-oxide blasted electro-mechanic generated Ti-oxid Sand-blasted, Large grit. screw screw. 2 2. I /m ∗. S/s ∗. I /e∗ I /t ∗ S/t ∗ N∗. ∗ abbrevations. of the analyzed titanium implant samples.
(3) 3038. W.-D. Grimm, W. H. Arnold, M. Dietrich and H. Morgner. Fig. 1 The entire epithelium/implant surface-compartments of 10 different implant systems were utilized as a test area. The ultramorphological analyzes was carried out using Scanning Electron Microscopy (SEM), the Confocal Laser Scanning Microscopy (CLSM), X-ray photoelectron spectroscopy (XPS), Metastable Induced Electron Spectroscopy (MIES) and Optical Profilometry.. 125 × 125 µm2 was scanned the position of the maximum intensity inside the image stacks leads to a function z(x, y), which may be converted into a gray scale by the TOPO mode of the CLSM (z: 0.15 µm, 100–150 images per stack). 2.3 Optical profilometry For measuring the microroughness of the mucosal interfaces all implants were cleaned in 70% Ethanol. The measurement was carried out by the UBM Analysis-System, Version 2.0. The optical sensor used a laserdiode with a power of 3–5 mW and a wavelength of 780 nm. The working distance was ca. 2 mm, the scanning speed ca. 1, 2 kHz. The measurement was done on a 0, 7 mm long distance at a solution of 1000 measured points/mm. 6 different kinds of microroughness were analyzed: • Ra values, • Rt values, • Rmax values, • Rp values, • Rpm values, • Sk values The measurement was carried out four times in the longitudinal direction of the implant. For each implant the standard failure and the median roughness was calculated. 2.4 X-ray photoelectron spectroscopy (XPS) and metastable induced electron spectroscopy (MIES) The surfaces of mucosal-implant interfaces have been characterized by X-ray photoelectron spectroscopy (XPS) and Metastable Induced Electron Spectroscopy (MIES) using standardized commercially pure Titanium and alloyed Titanium templates of the mucosal Ti implant compartments.. The experiments were carried out with the Leybold instrument MAX 100. It is equipped with components to perform XPS, AES, UPS, MIES, ISS and LEED. In the present study the two techniques XPS and MIES were used. MIES yields information on the chemical composition at the top surface layer. Knowledge on the elemental composition at the surface is provided by XPS, the observation depth being several nanometers. XPS has the additional property that yields information on the chemical state of the identified elements. Important for the present study is the fact that we have equipped the machine with a source of He∗ -atoms that has been built by Leybold according to our specifications. A short characterization will follow here. The He gas discharge excites He atoms to their metastable states He∗ (23 S, 21 S) and produces photons of the HeI resonance line. A chopper wheel allows to separate He∗ -atoms and HeI by a time-offlight technique. The separation between source and probe amounts to 29 cm. In between the beam is purified: He+ ions and atoms in long lived excited states are removed by an electric field and the second metastable state He (21 S) can be quenched by irradiation with He (21 P → 21 S) photons from a He-discharge lamp. Both, metastable helium atoms as well as HeI-photons cause electron emission at the investigated probe. The analytical methods described above are housed in the main chamber which is evacuated to the background pressure of 10−8 Pa. Probes are admitted via a differentially pumped lock. Only when the pressure in the lock is below 10−7 the valve to the main chamber is opened and the probe transferred. Bringing the probe into the lock can be done very fast. Between the preparation of a probe (in our case breaking the seal of the titanium implant package) and placing the probe into the lock including pumping down to.
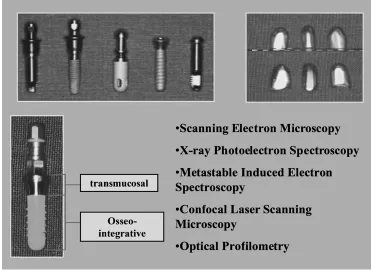
(4) Three-Dimensional Surface Pattern and Chemical Composition of Mucosal Titanium Implant Compartments. 3039. Mucosal Implant-Interface, magnification 2000x. I/m. I/t. I/e. S/t. Producer. Material. Surface Pattern. Design. Group. I/m. 3i. Titan Grade 1. machined. screw. 1. I/e. 3i. Titan Grade 1. acid etched. screw. 2. I/t. 3i. Titan Grade 1. Titanium plasma. cylinder 3. S/t. ITI. Titan Grade 4. Titanium plasma. screw. 3. N. Noble Biocare. Titan Grade 1. machined. screw. 1. screw. 2. Sand blasted, Large grit, S/s. ITI. Titan Grade 4. Acid-etched. Fig. 2 Micrographs of representative analyzed mucosal implant interfaces: I /m = machined screw, titanium grade 1, group 1, I /e = acid etched screw, titanium grade 1, group 2, I /t = plasma sprayed cylinder, titanium grade 1, group 3, S/t = plasma sprayed screw, titanium grade 4, group 3, N = machined screw, titanium grade 1, group 1, S/s = sand blasted, large grit, acid-etched screw, titanium grade 4, group 2.. a pressure that virtually excludes further contamination from the atmosphere less than two minutes elapse. Further details on the MIES technique can be found in Morgner.11) For analysis the titanium probe was removed from its sealed package and placed immediately into the vacuum. The results were obtained without applying the standard cleaning techniques because the status of the surfaces as used by a dentist were to be explored. 2.5 Statistical analysis All tests were repeated four times at different areas of the specimens. Mean, maximum, and minimum standard deviations are calculated separately for the CLSM and optical profilometric data. The effects of the different methods on the amplitude of surface roughness Ra were assessed by analyzes of variance. The expected value of the fraction of CLSM and optical profilometric data were calculated by the delta method.12). N. S/s 3. Results 3.1 SEM-analyzes The Fig. 2 shows micrographs of transmucosal surfaces of the investigated implant systems. Surprisingly, the surface morphology of samples is quietly different. The characteristic turning pattern appears in the pictures. The surfaces of samples showed different fracturing of metal chips and pitting attack. From the SEM analyses it appears that the diameter of the pits varied in the range of 0, 1 to 10 µm. It is suggested that the light particles that were formed during turning and are loosely bonded to the surface. The surface of sample S/t shows pronounced fracturing of metal chips. The surface of sample I /e shows a noticeable pitting attack. Implant S/t shown in the graph is characteristic for a surface layer form the melt of a metal with high solidification temperature. The surface becomes rough with deep craters and trenches. 3.2 Optical profilometry The Fig. 3 shows the median microroughness of the investigated mucosal-implant interfaces after repeating the measurements four times at different areas of the specimens. The highest degree of median roughness (Fig. 4) showed the S/t implant manufactured from Ti-grade 4 and supplied with an TPS-surface. The De/b implant with Ti-grade 1 and the acidetched surface also showed a clearly rougher surface than the other implant systems. The lowest degree of median surface roughness showed the implant N and I /m. Both implants were machined from Ti-grade 1. These surfaces were not provided by a special treatment to gain a special kind of surface pattern after manufacturing the implant body by the CAD/CAM machines..
(5) 3040. W.-D. Grimm, W. H. Arnold, M. Dietrich and H. Morgner XPS. Scanning Force Microscopy. 155000. O 135000 m. 42,00. C. 115000. 38,00 34,00 30,00 26,00. I/m. 22,00. I/t S/t. N. 18,00. Ti [TiO 2]. 95000. co un ts. 75000. I/e S/s. 14,00. 55000. 10,00 6,00. 35000. 2,00 -2,00. Ra. Rmax. Rp. Rpm. Rt. Sk. 15000. Measurements. 550. Fig. 3 Median microroughness of the investigated mucosal-implant interfaces after four times repeated measurements at different areas of the specimens.. 500. 450. 400. 350. 300. 250. Binding Energy, EV. Fig. 5 Titanium in the oxidic, not in the metallic state is found within the observation depth of XPS which amounts to several 1 nm. concentration depth profile cast titanium 1. 0.8 Molar Fraction 0.6. x[Ti] x[O] x[C]. 0.4. 0.2. 0 0. 10. 20. 30. 40. 50. 60. Depth, D/nm. Fig. 4 Degree of median roughness measured by optical profilometry.. 3.3 X-ray photoelectron spectroscopy (XPS) and metastable induced electron spectroscopy (MIES) The XPS analyzes clearly showed the presence of Ti, O and C. Several peaks pertaining to titanium and oxygen can be found. This is to be expected since earlier studies showed already that the surface of machined titanium is covered by a 3–5 nm thick TiO2 layer. Indeed, our XPS spectrum in the Fig. 5 gives clear evidence that only titanium in the oxidic, not in the metallic state is found within the observation depth of XPS which amounts to several 1 nm. The chemical shift of the oxygen peak is indicative for O2− from a metallic oxide. This fits the observation that titanium is found to be in the TiO2 state. In agreement with studies of Olefjord et al.13) we found carbon in XPS. The detailed analysis of the spectrum assigns the dominant part of the carbon signal to –CH2 -groups (polyethylene) whereas a small fraction of the signal is due to carbon atoms near either oxygen or other oxidizing species like halogens. As no trace of halogen is found we conclude that this feature is caused by oxygen forming. The angular resolved version of the X-ray photoelectron spectroscopy (ARXPS) allows to evaluate a concentration depth profile of the identified elements C, O, Ti as shown in Fig. 6. MIES (not shown) gives clear evidence that saturated hydrocarbon chains form the outermost molecular layer. Virtually no signal from TiO2 is found at the very surface. The existence of hydrocarbon double bonds or of lone pair p-orbitals. Fig. 6 The Ti-surface is covered by a 3–5 nm thick TiO2 layer. Saturated hydrocarbon chains form the outermost molecular layer. Virtually no signal from TiO2 is found at the very surface.. can be excluded at the top surface. We have to conclude that the aforementioned –C=O must exist in deeper layers of the hydrocarbon film covering the probes. 3.4 CLSM-analyzes The visualization of the sample surfaces is given in the Figs. 7 and 8. With higher roughness of the analyzed mucosal-implant interfaces, TOPO-modes of the CLSM show an increasing number of “spikes” on the surfaces (Fig. 9). The visual impression of the surfaces with increasing surface roughness seem to be smoother, which stands in contrast to the roughness values obtained by the optical profilometry. 4. Discussion From the chemical point of view the analyzed mucosalimplant interfaces showed similar tendencies. Titanium, oxygen and carbon signals were always detected. The dominance of titanium and oxygen signals supported that the surfaces consist mainly of a titanium oxide layer. When titanium is exposed, a passive film is formed naturally on the titanium surface. The results obtained by our XPS analyzes suggest a two-layer structure for this passive film. The inner layer has a structure close to TiO2 , while the outlayer is dominated by.
(6) Three-Dimensional Surface Pattern and Chemical Composition of Mucosal Titanium Implant Compartments. 3041. Fig. 8 CLSM analyzes of mucosal implant-interfaces of 4 implants from the group “smooth”, “Topological 3D-View, Unleveled”.. CH2 -groups with a few –C=O groups inside the hydrocarbon overlayer, but not at its very surface. The influence of contaminants on the dissolution rate of titanium in the sulcular fluids has not been studied. It is suggested that organic compounds lower the dissolution rate of titanium.13) The granular structure observed by SEM analysis on mucosal-implant interfaces titanium seems to indicate that the dissolution occurs at localized defects in the passive film influencing the barrier function of implanto-gingival tissues. The relatively strong carbon signal showed by the XPS analyzes can be assigned mainly to surface contamination by absorbed organic carbon-containing molecules, which is a normal observation for air-exposed surfaces and it can be considered to be undesirable for soft tissue interactions with the titanium surfaces. The titanium ions that originate from the inner layer of the passive film may then react with radicals and form some titanium (IV)-H2 O2 complex. X-ray photoelectron spectroscopy analyses14) of titanium samples indicated the presence of calcium, phosphorus, sodium, and chlorine after immersion in a protein-free physiologic solution. The oxide on titanium became heterogeneous and polarized as a function of exposure to model physiologic. 3i MK III. 3i. Fig. 7 CLSM analyzes of mucosal-implant interfaces of 4 implants from the group “smooth”, “Average projection”.. Semados. Semados. „Average Projection“, objektive: 50x , image size: 300 x 300 m. Ankylos. Ankylos. MK III. Mucosal-Implant Interfaces. : „Topological Unleveled“ Objektive: 50x , image size: 300 x 300. m. Fig. 9 CLSM analyzes of mucosal implant interfaces of 4 implants from the group “smooth”, “Topological Unleveled”.. environments.15) Changes included an increase in surface hy(2−) . Emdroxyl groups, and adsorption of H2 PO− 4 and HPO4 ploying two immersion schemes Healy and Ducheyne16) determined the titanium released into a solution of accumulated dissolution products; and the differential continuously replenished the test solution. Prior to immersion two types of hydroxyl (OH) groups were distinguished on the TiO2 surface. Upon immersion, the chemistry of the surface changed as a function of immersion: the presence of OH groups increased and P (nonelemental) was detected at the surface. These mechanisms explain the observed dependence of dissolution kinetics on the properties of the surface oxide and solution ligands. Investigating the influence of the chemical composition on the early biofilm formation on alloyed and cp titanium surfaces Grimm et al.17) have shown that the greater thickness of CH2 -layers and the relatively high content of O2 in between of CH2 -layer and TiO2 -layer of alloyed Ti may explain the differences in early bacterial adhesion between the investigated Ti surface conditions. The surface oxide limits dissolution of elements and promotes the bacterial adhesion. Xiaolong Zhu and coworkers18) could show the interconnected pores (ca. 1– 2 m in diameter) and intermediate roughness (0.60–1.50 µm) of anodic oxides. In addition, the anodic oxides contained a mixture of amorphous, anatase, and rutile oxides. With an increase in the anodizing voltage and/or concentration of calcium incorporated into the oxide, the degree of oxide crystallinity increased. The various Ti surface modifications of the analyzed mucosal-implant interfaces had little effect of the surface roughness. Quirynen and his coworkers19–22) performed a series of clinical-controlled studies showing that surface parameters like surface free energy and especially surface roughness have a signifant influence on biofilm formation only from a certain roughness value. The threshold Ra-value was suggested as 0.2 µm.23) Reduction in surface roughness below this threshold had no further effect on the biofilm formation.24) This will be confirmed by the concentration depth profiles measured on the investigated mucosal Ti implant compartments..
(7) 3042. W.-D. Grimm, W. H. Arnold, M. Dietrich and H. Morgner. 5. Conclusions (1) Exposure of Ti-mucosal-implant interfaces to oxygen at room temperature provided an overall 1 nm-thick passive oxide layer film formed as a two-layer structure on the titanium surface, but not at its top-layer. The inner layer has a structure close to TiO2 , while the outlayer is dominated by CH2 -groups with a few –C=O groups inside the hydrocarbon overlayer. (2) Titanium dissolution occurs at localized defects in the passive film influencing the barrier function of implantogingival tissues. (3) The relatively strong carbon signal can be assigned mainly to surface contamination by absorbed organic carboncontaining molecules and varying very less between the implants from the different suppliers. (4) With higher roughness TOPO-modes of the CLSM show an increasing number of “spikes” on the surfaces. (5) The surface morphology of Ti-mucosal-implant interfaces analyzed by SEM is quietly different showing characteristic turning pattern and different fracturing of metal chips and pitting attack with depth varying in the range of 0,1 to 10 µm. Acknowledgments The authors wish to thank Prof. Dr. H. Duschner and Dipl. Phys. H. Götz, Applied Structure-and Microanalyzes, University of Mainz, for providing the CLSM analyzes. REFERENCES 1) J. S. Hermann, D. Buser, R. K. Schenk, F. L. Higginbottom and D. L. Cochran: Clin Oral Impl Res. 11 (2000) 1–11. 2) T. Berglundh, B. Liljenberg and J. Lindhe: J. Clin. Periodontol. 26 (1999) 91–98. 3) M. A. Listgarten and C. H. Lai: J. Periodontol. 70 (1999) 431–437. 4) D. Buser, H. P. Weber, K. Donath, J. P. Fiorellini, D. W. Paquette and. R. C. Williams: J. Periodontol. 63 (1992) 225–235. 5) M. Quirynen and C. M. Bollen: J. Clin. Periodontol. 22 (1995) 1–14. 6) W.-D. Grimm, W. H. Arnold, P. Cichon, V. Braasch and I. Schmitz: J. Dent. Res. 79 (2000) 468. 7) D. Steinberg, M. N. Sela, A. Klinger and D. Kohavi: Clin. Oral Implants Res. 9 (1998) 67–72. 8) J. M. Salcetti, J. D. Moriarty, L. F. Cooper, F. W. Smith, J. G. Collins, S. S. Socransky and S. Offenbacher: Int. J. Oral Maxillofac Implants 12 (1997) 32–42. 9) S. Wagner, B. Al-Nawas, H. Götz, H. Duschner, K. A. Grötz and W. Wagner: Surface characterisation of dental implants by confocal laser scanning microscopy, 37 th annual Meeting of the Continental European Division of the International Association for Dental Research, Rome 2001, Abstract 262, p. 191. 10) B. Al-Nawas, K. A. Grötz, H. Götz, H. Duschner and W. Wagner: Scanning 23 (2001) 227–31. 11) H. Morgner: Adv. At. Mol. Opt. Physics 43 (2000) 387–439. 12) A. M. Mood, F. A. Graybill and D. C. Boes: Introduction to the Theory of Statistics., Vol. 3., (McGraw-Hill, Singapore, 1974) p. 181. 13) I. Olefjord and S. Hansson: Int. J. Oral Maxillofac. Implants 8 (1993) 32–40. 14) J. L. Ong, Prince, G. N. Raikar and L. C. Lucas: Implant. Dent. 65 (1996) 83–88. 15) K. E. Healy and P. Ducheyne: ASAIO Trans. 37 (1991) 150–151. 16) K. E. Healy and P. Ducheyne: J. Biomed. Mater. Res. 26 (1992) 319– 338. 17) W.-D. Grimm, V. Braasch, I. Schmitz and K.-M. Müller: Dtsch. Zahnärztl. Z. 56 (2002) 96–101. 18) J. Xiaolong Zhu, L. Ong, S. Kim and K. Kim: J. Biomed. Mater. Res. 60 (2002) 333–338. 19) M. Quirynen, M. Marechal, H. J. Busscher, A. H. Weerkamp, J. Arends, P. L. Darius an and D. van Steenberghe: J. Dent. Res. 68 (1989) 796– 799. 20) M. Quirynen, H. C. van der Mei, C. M. Bollen, A. Schotte, M. Marechal, G. I. Doornbusch, I. Naert, H. J. Busscher and D. van Steenberghe: J. Dent Res. 72 (1993) 1304–1309. 21) M. Quirynen, C. M. Bollen, W. Papaioannou, J. van Eldere and D. van Steenberghe: Int. J. Oral Maxillofac. Implants 11 (1996) 169–178. 22) C. M. Bollen, W. Papaioanno, J. van Eldere, E. Schepers, M. Quirynen and D. van Steenberghe: Clin. Oral Implants Res. 7 (1996) 201–211. 23) T. Sawase, A. Wennerberg, C. Hallgren, T. Albrektsson and K. Baba: Clin. Oral Implants Res. 11 (2000) 44–50. 24) B. Größner-Schreiber, M. Griepentrog, I. Haustein, W. D. Müller, K. P. Lange, H. Briedigkeit and U. B. Göbel: Clin. Oral Impl. Res. 12 (2001) 543–551..
(8)
Figure

+2

Related documents
CABG = coronary artery bypass grafting, DM = diabetes mellitus, MetS = metabolic syndrome, Non-insulin DM = diabetic patients without insulin treatment.. Insulin DM = diabetic
In this paper we show how time-invariant fixed and random effects panel data models can be estimated when there are nonparametric elements in the regression function using a
For the development sites that come forward to the planning process, Durham County Council should encourage developers to not only address surface water runoff from their
The research contributes to knowledge of working in South Africa by exploring the emotional experiences of those who help sexually abused children daily, and by
The novel features of our model allow us to introduce a new simple declarative language that specifies firewall policies by abstracting both the order in which rules are applied,
thomas schaarschmidt computer science, software programming Berlin uli schaarschmidt industrial design, communication service, fine art Munich International Design
To develop the model of the evaluation of corporate social capital impact on the operation of enterprise there was the need to specialize these assessment
![A Li-rich Li[Li0.2Ni0.2Mn0.6]O2 Cathode Material in situ Coated with Polyaniline](data:image/gif;base64,R0lGODlhAQABAIAAAP///wAAACH5BAEAAAAALAAAAAABAAEAAAICRAEAOw==)