EFFECT OF SINTERING ON SUSTAINED RELEASE PROFILE OF
Β-BLOCKER TABLET PREPARED BY DIRECT COMPRESSION
METHOD
Pentewar R. S.*, Sayyed Sarfaraz Ali Riyasat Ali, Thonte S. S., Nasheer Shaikh
Department of Pharmaceutics, Channabasweshwar Pharmacy College, Latur, Maharashtra,
India.
ABSTRACT
Exploration of sintering concept in the pharmaceutical science is
relatively recent. The objective of this study was to investigate the
release characteristic of matrix tablet consisting of a different
concentration of various retarding polymers and Sotalol Hcl for
sustain release formulation using different sintering techniques. The
Sotalol tablet was prepared by using different polymers by direct
compression method and formulation was sintered at various
temperatures and time point. The sintering of tablet is done by using
different techniques like thermal sintering and microwave sintering.
The sintered tablets were tested for weight variation, hardness,
friability, content uniformity and in-vitro dissolution study. The
sintered tablet showed more strength and drug was also retarded than unsintered tablet.
Formulation Fs3 and Fs6 showed 96.31% and 95.41 % release profile in 18 hr when
subjected to thermal sintering at 80C for 5 hr. whereas, Formulation Fm3 and Fm6 provided
97.21 % and 97.68 % release profile in 18 hr when subjected to microwave sintering at 100
watt for 6 min. Sintering i.e. Application of heat, causes the bonding of adjacent particle
surfaces in a mass of powder or in a compact leading to the retardation of drug release.
FT-IR, Differential Scanning Calorimetry studies ruled out the occurrence of drug interaction
after sintering condition. The drug release followed Peppas kinetics. The mean diffusional
exponent values (n) ranged from 0.2987 to 0.4972 indicating that all these formulations
presented a dissolution behavior controlled by Fickian Diffusion. The stability study
conducted as per the ICH Guidelines for optimized formulation was found to be stable.
Volume 5, Issue 8, 573-591. Research Article ISSN 2277– 7105
*Corresponding Author
Pentewar R. S.
Department of
Pharmaceutics,
Channabasweshwar
Pharmacy College, Latur,
Maharashtra, India. Article Received on 22 May 2016,
Revised on 13 June 2016, Accepted on 05 July 2016
KEYWORDS: Sotalol Hcl, sintering technique, direct compression, Eudragit RS100
sustained release, FTIR.
INTRODUCTION
The oral route of drug administration is the most important method of administering drugs for
systemic effects. Oral route is one of the most popular routes of drug delivery due to its ease
of administration, patient compliance, least sterility constraints and flexible design of dosage
form. At least 90% of all drugs used to produce systemic effects are administered by oral
route. Of drugs that are administered orally, solid oral dosage forms represent the preferred
class of product.[1-3]
1. Rationale of Sustained and Controlled Drug Delivery
The basic rationale for controlled drug delivery is to alter the pharmacokinetics and
pharmacodynamics of pharmacologically active moieties by using novel drug delivery
systems or by modifying the molecular structure and pharmacological parameters inherent in
the selected route of administration. Thus, design of controlled release systems necessitates a
thorough understanding of the pharmacokinetics and pharmacodynamics of the drugs.[2-5]
A. Potential Advantages of Sustained Release Dosage Form [5-16]
Better patient compliance due to reduced frequency of dosing.
Uniform level of drug in blood is maintained.
Quantity of drug required is less.
o Minimize or eliminate local or systemic side effects.
o Minimize drug accumulation with chronic dosing.
Improved efficiency in treatment.
o Cure or control condition more promptly.
o Improved control of condition i.e. reduced fluctuation in drug level.
o Improves bioavailability of some drugs.
Make use of special effects, e.g. sustained release aspect for relief of arthritis by dosing
before bedtime.
Economic
B. Disadvantages of Sustained Release products[2, 6, 7]
Dose Dumping
Reduced potential for accurate dose adjustment
Need for additional patient education
Increased potential for first pass metabolism
Possible reduction in systemic availability
Increased variability among dosage units
The complexity of sustained release forms may lead to stability problems resulting in
either faster or slower drug release than anticipated.
2. Modified Release System[8-9]
To overcome the potential problem associated with conventional drug therapy, modified
release systems were developed and may be divided into four categories,
1. Sustained release.
2. Controlled release.
3. Site specific and
4. Receptor release
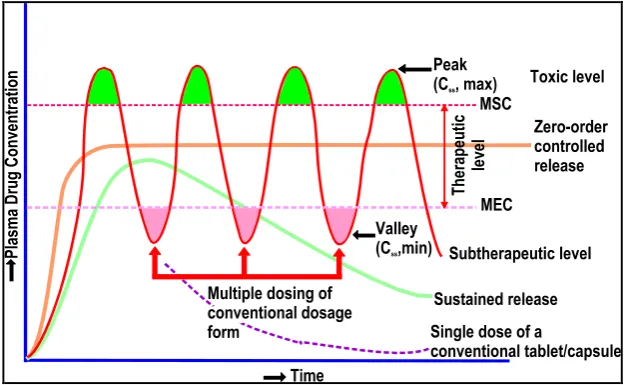
1.Sustained Release System[6,10]
Sustained release systems are that which achieve slow release of drug over an extended
period of time and in this drug is initially made available to the body in amount to cause the
desired pharmacological response.
[image:3.595.141.455.533.725.2]2. Controlled Release System
An ideal controlled drug delivery is that which delivers the drug at predetermined rate,
locally or systemically for the predetermined period of time.
3. Site Specific Release System
Site specific release system refers to targeting of the drug directly to a certain body location.
4. Receptor Release System
Receptor release system refers to targeting of the drug depending on specific receptor of
certain biological location.
3. Recent trends in sustained drug delivery system[9-12]
Sustained release dosage forms are categorized as
1. Single unit dosage form.
2. Multiple unit dosage form.
1. Single Unit Dosage Form: These refer to diffusion systems where the drug is uniformly
distributed (dispersed/dissolved) throughout the solid matrix and the release of the drug is
controlled or sustained either by incorporating hydrophilic or hydrophobic filler within the
matrix or by coating the drug matrix with a swellable or non swellable polymer film.
2. Multiple Unit Dosage Forms
It represents a combination of subunits of the dosage forms, the source of which may either
be homogeneous or heterogeneous. It offers the advantages of releasing one of the drug or
part of the same drug immediately, while remaining drug or parts of the same can be
sustained release. These are useful where drug - excipients and drug-drug interactions are
inevitable in a single unit dosage form. The various forms are as
Micro granules/Spheroids
Beads
Pellets
Microcapsules
4. Sintering Technique[17-21,22-26]
In the pharmaceutical science, sintering has been described as the mechanism for the
elevated temperatures, for solid-bond formation, and for thermal curing of polymer-latex film
coatings. The concept of sintering was applied in the investigation of the effect of heating on
the mechanical properties of pharmaceutical powders. The formation of solid bonds within a
powder bed during tablet compression was also studied in terms of sintering. The changes in
the hardness and disintegration time of tablets stored at elevated temperatures were described
as a result of sintering. Furthermore, the sintering process has been used for the fabrication of
sustained – release matrix tablets and for the stabilization of the drug permeability of film
coatings derived from various pharmaceutical lattices. Exploration of the sintering concept in
the pharmaceutical sciences is relatively recent, but research interests relating to this process
have been growing.
Sintering is defined as the bonding of adjacent particle surfaces in a mass of powder, or in
compact, by the application of heat. Conventional sintering technique involves the heating of
compact (matrix tablets) at a temperature close to the melting point of retarding material.
Variation in this method include heating in the presence of transient or stable liquid phases
and/or under pressure (hot-pressing). Plasma activated sintering, microwave sintering and
laser sintering are the more recent advances in sintering technologies. Historically, sintering
is a process employed to fabricate parts for metals, ceramics and glass.
2. MATERIALS AND METHODS
Sotalol Hcl obtained as gift sample from Bmr Pharma And Chemicals, Hyderabad,
Telangana. Eudragit RS 100 obtained from Hi Media Chem. Pvt. Ltd. Mumbai., HPMC K4M
Research-lab fine chem. industries, Mumbai, Gum Acacia Ozone International, Mumbai
(LR)., Xanthan gum Ozone International, Mumbai(LR). Sodium starch glycolate, Avicel Ph
102, Aerosil 200 are of analytical grades.
Preparation of Sustained Release tablet by Direct Compression Method
Various formulations were prepared using Eudragit RS100, HPMC K4M, Gum Acacia,
Xanthan Gum separately and incombination. Sotalol and other ingredients were weighed and
the mixture was then blend with lubricant in a polybag and compressed into tablets. All
tablets were prepared using single rotatory tablet machine equipped with standard flat
punches of 7-mm diameter. Compressed tablets were subjected to sintering for different time
points as shown in Tables 2 and 3 at various temperatures using hot air oven and micro wave
3. RESULT AND DISCUSSION
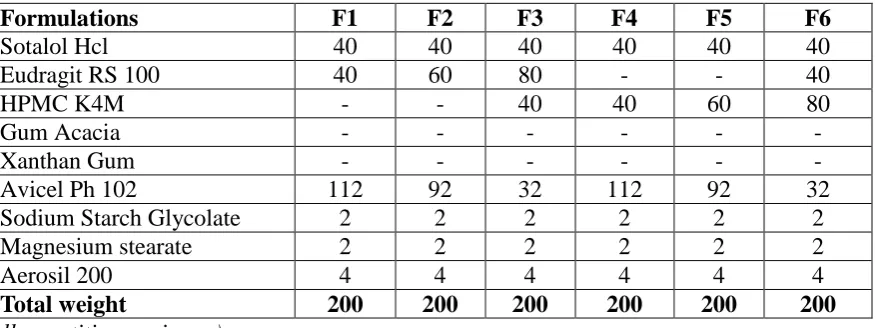
Table 1. Formulation table
Formulations F1 F2 F3 F4 F5 F6
Sotalol Hcl 40 40 40 40 40 40
Eudragit RS 100 40 60 80 - - 40
HPMC K4M - - 40 40 60 80
Gum Acacia - - - -
Xanthan Gum - - - -
Avicel Ph 102 112 92 32 112 92 32
Sodium Starch Glycolate 2 2 2 2 2 2
Magnesium stearate 2 2 2 2 2 2
Aerosil 200 4 4 4 4 4 4
Total weight 200 200 200 200 200 200
(All quantities are in mg)
Table 2: Sintering condition for Fs1 to Fs6 formulations by hot air oven.
Formulation (unsintered)
Formulation (sintered)
Sintering Temperature (C)
Sintering time (hr)
F1 Fs1 80 5
F2 Fs2 80 5
F3 Fs3 80 5
F4 Fs4 80 5
F5 Fs5 80 5
F6 Fs6 80 5
Table 3. Sintering condition for formulations Fm1 to Fm6 (Microwave).
Formulation (unsintered) Formulation (sintered) Sintering Temperature (Watt) Sintering time (min)
F1 Fm1 100 6
F2 Fm2 100 6
F3 Fm3 100 6
F4 Fm4 100 6
F5 Fm5 100 6
F6 Fm6 100 6
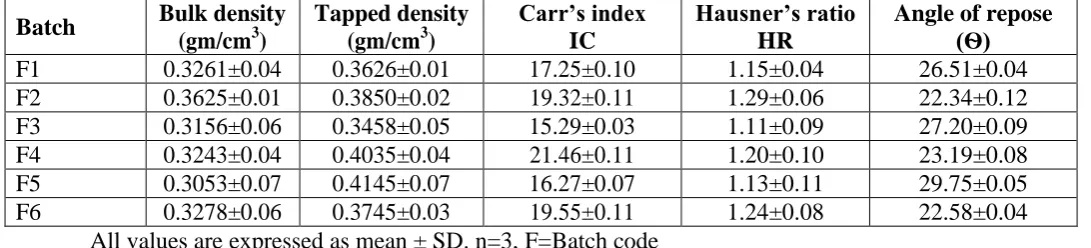
Evaluation of Mixture for Precompressional Parameters: Bulk density obtained for all
formulations was in the range of 0.3053±0.07 to 0.3625±0.01 that shows good powder /
granules flowability. Carr’s index between 5-15% shows excellent flow properties but
readings above 40% shows extremely poor flowability. In above formulations Carr’s index
ranged from 15.29±0.03 to 21.46±0.11 showing good to fair flowability. Hausner’s ratio
ranged from 1.11±0.09 to 1.29±0.06.
Values of angle of repose upto 20 shows excellent flow properties whereas angle of repose
≥40o
22.5±0.06 to 29.75±0.05 i.e. granules were of good flow property.
All the pre-compressional parameters comply with the standard values and are shown in table
[image:7.595.27.573.189.313.2]no 4.
Table 4: Precompressional parameters of all the batches prepared
All values are expressed as mean ± SD. n=3, F=Batch code
Evaluation parameters for tablets of final batches: Formulation F1 to F6 were subjected to
the quality control test as per IP such as hardness, thickness, weight variation, friability and
drug content before and after sintering were evaluated.
Hardness: Hardness of tablets of each formulation was measured and was found in the range
of 5-8 kg/cm2. Hardness of sintered tablets was improved as compared to unsintered tablets.
Each sample was analyzed in triplicate.
Friability: Compressed tablets should not lose more than 1% of their weight. Percentage
weight loss of the tablets of each formulation was measured and was found to be less than 1%
for all the formulations.
Weight variation test: Tablets from each batch showed uniformity of weight as per I. P.
limits. Average weight of the tablet was found to be 200 ± 3 mg for all formulations.
Tablet thickness and size: Diameter of formulations was found to be 6 ± 0.05 mm.
Thickness was found to be 3 ± 0.2 mm for all the formulations. Every measurement was
made in triplicate.
Content uniformity: The content uniformity for all tablet formulations was found to be
99.0% to 101% for Sotalol Hcl. All the above mentioned parameters have been summarized
in Table 5.
Batch Bulk density
(gm/cm3)
Tapped density (gm/cm3)
Carr’s index IC
Hausner’s ratio HR
Angle of repose (Ѳ)
F1 0.3261±0.04 0.3626±0.01 17.25±0.10 1.15±0.04 26.51±0.04
F2 0.3625±0.01 0.3850±0.02 19.32±0.11 1.29±0.06 22.34±0.12
F3 0.3156±0.06 0.3458±0.05 15.29±0.03 1.11±0.09 27.20±0.09
F4 0.3243±0.04 0.4035±0.04 21.46±0.11 1.20±0.10 23.19±0.08
F5 0.3053±0.07 0.4145±0.07 16.27±0.07 1.13±0.11 29.75±0.05
Table 5. Evaluation parameters of sintered and unsintered tablets
Formulation Tablet Hardness
(kg/cm2)*
Tablet thickness (mm)*
Weight variation (mg)*
Friability (%)*
Drug content (%)*
F1 6-7 3.0±0.10 200 ±2 0.50 ±0.02 99.20±0.20
Fs1 7-8 3.2±0.10 200 ±2 0.30 ±0.02 99.66±0.20
Fm1 7-8 3.0±0.10 200 ±2 0.20 ±0.02 99.45±0.20
F2 7-8 3.0±0.10 200 ±2 0.40 ±0.02 99.20±0.20
Fs2 7-8 3.0±0.10 200 ±2 0.20 ±0.02 99.22±0.20
Fm2 6-7 3.2±0.10 200 ±2 0.20 ±0.02 100.2±0.20
F3 5-6 3.2±0.10 200 ±2 0.60 ±0.02 99.88±0.20
Fs3 6-7 3.1±0.10 200 ±2 0.40 ±0.02 99.45±0.20
Fm3 7-8 3.2±0.10 200 ±2 0.40 ±0.02 100.90±0.20
F4 5-6 3.3±0.10 200 ±2 0.40 ±0.02 100.40±0.20
Fs4 7-8 3.4±0.10 200 ±2 0.20 ±0.02 99.20±0.20
Fm4 6-7 3.5±0.10 200 ±2 0.20 ±0.02 99.88±0.20
F5 5-6 3.2±0.10 200 ±2 0.50 ±0.02 99.78±0.20
Fs5 7-8 3.4±0.10 200 ±2 0.20 ±0.02 99.56±0.20
Fm5 7-8 3.4±0.10 200 ±2 0.30 ±0.02 99.78±0.20
F6 5-6 3.6±0.10 200 ±2 0.40 ±0.02 99.78±0.20
Fs6 7-8 3.6±0.10 200 ±2 0.20 ±0.02 100.20±0.20
Fm6 7-8 3.6±0.10 200 ±2 0.30 ±0.02 99.40±0.20
*Average of three determinants
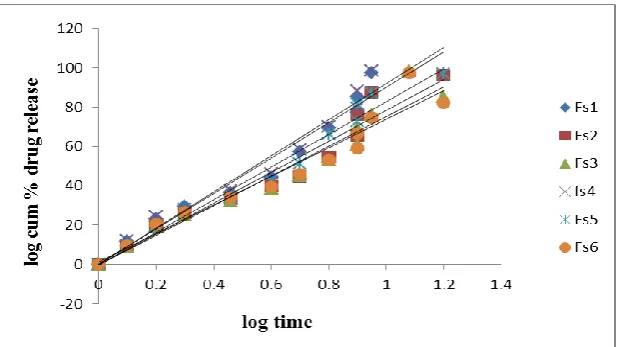
Curve Fitting Analysis of Different Formulations
The kinetic data of Sotalol Hcl tablets were given in table no.6.
The correlation coefficient values of zero order of all the formulations were in the range of
0.8459 to 0.9763 and first order r values were from 0.8253 to 0.9756.
The results suggest that, the drug release followed Peppas kinetics. To ascertain, the drug
release mechanism in vitro release data were also subjected to Higuchi’s diffusion plot and Peppa’s plot and the correlation coefficient values were in the range of 0.9457 to 0.9934 and
0.9758 to 0.9965 respectively. So it confirms that, the calculated r values for Peppa’s plot was
nearer to one (1) in all the cases suggesting that drug released by diffusion mechanism.
The mean diffusional exponent values (n) ranged from 0.2987 to 0.4972 indicating that all
these formulations presented a dissolution behavior controlled by Fickian Diffusion (when n
Table 6: Curve Fitting Analysis of Different Formulations
Formulation code
Zero order (R)
First order (R)
Higuchi’s (R)
Peppa’s
R N
Fs1 0.8694 0.8253 0.9842 0.9895 0.3852
Fs2 0.9512 0.8944 0.9457 0.9756 0.2987
Fs3 0.8763 0.8818 0.9671 0.9745 0.4685
Fs4 0.8459 0.9637 0.9813 0.9884 0.3496
Fs5 0.9365 0.8483 0.9758 0.9852 0.4262
Fs6 0.8944 0.9756 0.9795 0.9845 0.3941
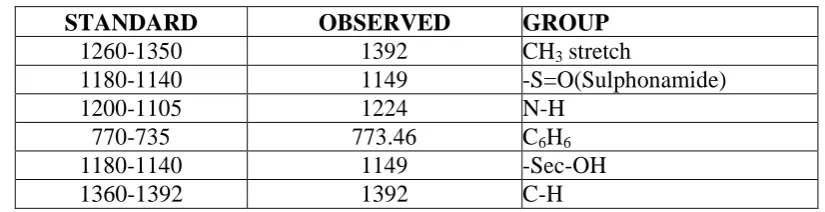
Excipients compatibility study
FTIR Study
FTIR studies were conducted and the spectrum was recorded in the range of 4000-400 cm-1.
No significant interaction between the drug and excipients was observed. All the spectrum
i.e. drug and excipients were concordant with that of the standard IR spectra of pure drug
sotalol.
Table 7: Interpretation of IR
STANDARD OBSERVED GROUP
1260-1350 1392 CH3 stretch
1180-1140 1149 -S=O(Sulphonamide)
1200-1105 1224 N-H
770-735 773.46 C6H6
1180-1140 1149 -Sec-OH
1360-1392 1392 C-H
In vitro dissolution studies
The in vitro dissolution studies were performed using USP type-II dissolution apparatus at 50
rpm. The dissolution medium consisted of .1N Hcl and phosphate buffer pH 7.4 for 18 hours
(900 ml), maintained at 37°C ± 0.5°C. An aliquot (10 ml) was withdrawn at specific time
intervals and drug content was determined by UV-visible spectrophotometer at 229 nm. At
each time of withdrawal, 10 ml of fresh corresponding dissolution medium was replaced into
the dissolution flask. The release studies were conducted in triplicate. In vitro dissolution
studies were carried out for the F1-F6 Formulations for 18 hr. Dissolution profile was
checked for unsintered tablets and sintered tablets and results have been summarized in
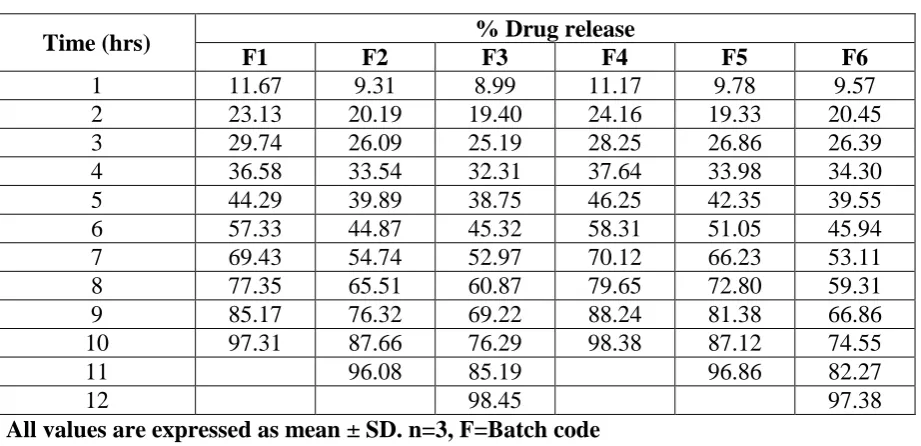
[image:9.595.89.502.377.483.2]Table 8: In-vitro dissolution study of unsintered formulation F1-F6.
Time (hrs) % Drug release
F1 F2 F3 F4 F5 F6
1 11.67 9.31 8.99 11.17 9.78 9.57
2 23.13 20.19 19.40 24.16 19.33 20.45
3 29.74 26.09 25.19 28.25 26.86 26.39
4 36.58 33.54 32.31 37.64 33.98 34.30
5 44.29 39.89 38.75 46.25 42.35 39.55
6 57.33 44.87 45.32 58.31 51.05 45.94
7 69.43 54.74 52.97 70.12 66.23 53.11
8 77.35 65.51 60.87 79.65 72.80 59.31
9 85.17 76.32 69.22 88.24 81.38 66.86
10 97.31 87.66 76.29 98.38 87.12 74.55
11 96.08 85.19 96.86 82.27
12 98.45 97.38
All values are expressed as mean ± SD. n=3, F=Batch code
Table 9: In-vitro dissolution study of sintered formulation Fs1-Fs6 using hot air oven
All values are expressed as mean ± SD. n=3, F=Batch code
Excipients compatibility study
FTIR Study: FTIR studies were conducted and the spectrum was recorded in the range of
4000-400 cm-1. No significant interaction between the drug and excipients was observed. All
the spectrum i.e. drug and excipients were concordant with that of the standard IR spectra of
pure drug sotalol. The spectral data is given in Table. In FTIR spectrum of sotalol, polymer
Time (hrs) % Drug release
Fs1 Fs2 Fs3 Fs4 Fs5 Fs6
1 10.31 8.52 6.13 9.41 8.25 6.15
2 19.26 17.26 14.08 20.65 18.35 15.53
3 25.87 24.69 19.31 28.43 25.92 20.09
4 30.71 29.42 24.87 33.45 32.76 25.66
5 35.63 34.18 29.54 38.63 37.52 30.52
6 40.79 39.15 34.32 44.75 43.18 35.53
7 46.18 45.56 39.27 52.25 50.64 41.67
8 51.36 50.89 44.35 57.61 54.29 46.71
9 57.17 56.38 51.27 63.56 59.2 50.08
10 64.87 63.74 57.28 69.35 65.16 56.13
11 71.23 70.5 64.55 74.32 70.84 62.8
12 77.4 75.5 69.22 80.1 76.4 70.3
13 83.68 81.57 75.88 83.38 79.35 76.58
14 90.12 88.82 79.18 89.9 84.31 80.12
15 94.73 92.18 85.61 92.15 89.48 83.02
16 98.39 97.13 89.34 99.38 94.16 88.53
17 93.59 98.65 92.32
and physical mixture of drug and polymer all the peaks corresponding to the functional
groups were present.
Table 10: In-vitro dissolution study of sintered formulation Fm1-Fm6 using microwave
oven
Time (hrs) % Drug release
Fm1 Fm2 Fm3 Fm4 Fm5 Fm6
1 7.31 7.1 6.24 8.36 7.2 6.25
2 19.45 16.85 13.09 15.98 14.56 12.83
3 23.48 21.56 19.49 20.57 19.46 18.43
4 28.13 26.35 24.96 26.89 25.4 24.4
5 35.78 33.41 28.7 31.08 30.2 29.56
6 40.52 38.45 35.54 36.11 35.01 34.23
7 48.23 44.51 39.51 44.19 39.93 42.27
8 52.81 50.33 46.21 50.38 45.9 49.65
9 61.25 58.83 49.32 56.73 50.35 54.21
10 65.73 62.55 55.74 61.17 56.37 60.25
11 70.21 69.38 61.74 66.28 60.15 64.13
12 75.08 76.81 69.74 70.63 69.35 68.22
13 82.18 80.23 75.91 77.05 76.49 75.54
14 89.24 85.19 82.11 83.4 82.69 80.51
15 93.39 90.48 86.32 89.6 87.13 85.4
16 99.43 96.5 91.08 94.74 93.41 90.72
17 94.26 98.72 97.08 93.13
18 97.21 97.80
[image:11.595.151.442.492.687.2]All values are expressed as mean ± SD. n=3, F=Batch code
Figure 3. IR spectrum of physical mixture of Eudragit Rs 100 And Drug.
Figure 4. IR spectrum of physical mixture of Hpmc K4 M And Drug.
[image:12.595.147.447.564.743.2]Figure 6. IR spectrum of physical mixture of Gum Acacia And Drug.
Differential scanning calorimetry studies: DSC was used to examine thermal behavior of
unsintered and sintered formulations.DSC studies of formulations mentioned below realized
that, during the process of formulation chemical reaction is not taken place and the drug has
[image:13.595.144.450.382.540.2]remained in the Free State to show its desired effects in controlled manner.
Figure 7. DSC thermogram of Fs3 formulation
[image:13.595.146.454.580.740.2]Therefore there is no evidence of drug interaction or complexation during manufacturing
process and on sintering.
In-vitro dissolution study: In vitro dissolution studies were carried out for 18 hr.
[image:14.595.145.451.180.339.2]Dissolution profile was checked for unsintered tablets and sintered tablets.
[image:14.595.147.450.381.551.2]Fig. 9: Percentage drug released vs time plots of unsintered formulations F1-F6
Fig. 10: Percentage drug released vs time plots of sintered formulations Fs1-Fs6
[image:14.595.146.452.588.749.2]Fig. 12: Log cumulative percent drug remaining vs time plots (first order) of
formulations Fs1-Fs6
Fig. 13: Cumulative percent drug relased vs square root of time (higuchi’s plots) of
formulations Fs1-Fs6.
[image:15.595.144.456.69.244.2] [image:15.595.145.455.306.487.2] [image:15.595.144.455.548.721.2]Stability studies
Short term stability studies were performed over a period of 3 weeks (21 days) on the
optimized tablet formulation Fs6. Sufficient number of tablets (25) were packed in HDPE
container and kept in Stability Chamber maintained at 45o±1 o C. and 75% RH for 3 weeks
(21 days) samples were taken on 21st day for evaluation of hardness, friability, drug content
estimation which were found to be within range and in-vitro studies were performed to
determine the drug release profile.
Appearance: Tablets kept for stability studies were examined. The colour of all the
formulation was similar before and after stability studies.
The estimation of hardness, friability, wt variation and drug content and data of dissolution
and in-vitro studies are shown in tables no 24 and 25 respectively.
Table 24: Evaluation data of stability formulation Fs6
Formulation Tablet Hardness (kg/cm2)*
Tablet thickness (mm)* Weight variation (mg)* Friability (%)* Drug content (%)*
Fs6 7-8 3.6±0.10 200 ±2 0.20 ±0.02 99.87±0.20
All values are expressed as mean ± SD, n=3, F=formulation code.
Table 25: In-Vitro release data of stability formulation Fs6
Sr. no. Time (hrs) Cum% drug released
1st day 21st day
1 1 7.15±0.35 6.85±0.11
2 2 15.53±0.21 15.20±0.48
3 3 20.09±0.73 19.54±0.56
4 4 25.66±0.28 25.47±0.84
5 5 30.52±0.17 30.12±0.75
6 6 35.53±0.44 34.83±0.11
7 7 40.67±0.48 41.07±0.48
8 8 45.71±0.56 44.81±0.56
9 9 51.08±0.32 51.48±0.75
10 10 56.13±0.77 55.38±0.55
11 11 62.80±0.11 62.47±0.36
12 12 69.30±0.48 68.90±0.69
123 123 75.58±0.56 75.38±0.56
14 14 79.18±0.75 78.18±1.75
15 15 83.02±0.77 82.62±0.31
16 16 88.53±0.56 88.74±0.65
17 17 92.32±0.75 92.45±0.85
18 18 95.87±0.78 94.58±0.15
CONCLUSION
At the end, from the experiments carried out and results obtained, it can be concluded that the
developed formulations achieved the objective of the investigation. The data obtained from
the study of “Effect of Sintering on Sustained Release profile of β-Blocker tablet prepared by
Direct Compression Method.” FTIR, DSC, Hardness, Friability, % drug content, % drug
release, weight variation test of all the formulations were within its range. During sintering,
the formulations did not undergo any degradation or complexation by which its release could
be retarded. The various time points and temperature alongwith the concentration and type of
polymer influences the release and compression characteristics of the sustained release
tablets. The dissolution study shows that the formulation Fs3 containing Eudragit RS 100 and
HPMC K4 M (2:1) In combination shows 96.31% release profile in 18 hr when subjected to
thermal sintering at 80C for 5 hr. whereas, the formulation Fs6 containing Eudragit RS 100
and HPMC K4 M (1:2) in combination shows 95.41 % release profile in 18 hr when
subjected to thermal sintering at 80C for 5 hr.
Formulation Fm3 containing Eudragit RS 100 and HPMC K4 M (2:1) and Fm6 containing
Eudragit RS 100 and HPMC K4 M (1:2) provided 97.21 % and 97.68 % release profile in
18 hr when subjected to microwave sintering at 100 watt for 6 min.
Sintering i.e. Application of heat, causes the bonding of adjacent particle surfaces in a mass
of powder or in a compact leading to the retardation of drug release. The sintered tablets
showed more strength than unsintered tablet and sintered tablet show less drug release than
the unsintered tablet. FT-IR, Differential Scanning Calorimetry studies ruled out the
occurrence of drug interaction after sintering condition. The stability study conducted as per
the ICH Guidelines for optimized formulation was found to be stable.
ACKNOWLEDGEMENT
The author wish to express his gratitude to Bmr Pharma And Chemicals, Hyderabad,
Telangana.
REFERENCES
1. Chien Y. Novel drug delivery system. Marcel Dekker Inc., New York, 1992: 139-140.
2. Chien Y. Novel drug delivery system. Marcel Dekker Inc., New York, 1992: 1-2.
4. Bankers G, Rhodes C. Modern Pharmaceutics. Marcel Dekker Inc., New York, 1995:
30- 35.
5. Bankers G, Rhodes C. Modern Pharmaceutics. Marcel Dekker Inc., New York, 1995:
577-578.
6. Bankers G, Rhodes C. Modern Pharmaceutics. Marcel Dekker Inc., New York, 1995:
579-580.
7. Lachman L, Liberman H, Kanig J. The theory and practice of industrial pharmacy.
Varghese publishing house, India, 1987: 427-430.
8. Brahmankar D, Jaiswal S, Biopharmaceutics and Pharmacokinetics-A Treatise. Vallabh
Prakashan, 1995: 347-371.
9. Lachman L, Liberman H, Kanig J. The Theory and Practice of Industrial Pharmacy.
Varghese Publishing House, India, 1987: 448-453.
10.Lachman L, Liberman H, Kanig J. The Theory and Practice of Industrial Pharmacy.
Varghese Publishing House, India, 1987: 443-453.
11.Jantzen G, Robinson J. Sustained and controlled release drug delivery system, modern
pharmaceutics, Modern Pharmaceutics, Marcel Dekker, New York, 1992: 71-121.
12.Dressman B, Amidon G, Reppas C. Dissolution testing as a prognostic tool for oral drug
absorption: immediate release dosage forms, Pharm Res. 2001; 15: 11-22.
13.Costo P, Lobo J. Modeling and comparison of dissolution profiles, European Journal of
Pharmaceutical Sciences 2000; 13: 123-133.
14.Luk C L, Jane H L. Sintering of Pharmaceutics : Encyclopedia of Pharmaceutical
Technology, Marcel Dekker, New York, 1996: 87-101
15.Mathew F, Anoop K, Jose S, Jose A. Formulation of metformin hydrochloride matrix
tablets by sintering technique and its evaluation, International Journal of pharmacy and
technology 2010; 293-306.
16.Barakat N S, Elbagory I M, Almurshedi A S. Formulation release characteristics and
bioavailability study of oral monolithic matrix tablets containing carmazepine , AAPS
PharmSciTech 2008; 9: 931-938.
17.Maggi L, Bruni R, Conte U. High molecular weight polyethylene oxide as an alternative
to HPMC in controlled release dosage forms, International Journal of Pharmaceutics
2000; 2: 229-238.
18.Islam M S, Reza S, Rahman H. In vitro kinetics study of diltiazem hydrochloride from
wax and kollidon SR based matrix tablets, Iranian journal of pharmaceutical research
19.Satyabrata B, Ellaiah P,Chandan M, Murthy K . Design and in vitro evaluation of
mucoadhesive buccal tablets of perindopril prepared by sintering technique. Asian
Journal of Pharmaceutical and Clinical Research 2010; 3: 329-335.
20.Singh R, Poddar S, Chivate A. Sintering of Wax for Controlling Release From Pellets,
AAPS PharmSciTech 2007; 2: 631-639
21.Uhumwangho M, Murthy K. Release Characteristics of Diltiazem Hydrochloride
Wax-Matrix Granules–Thermal Sintering Effect, European Journal of Pharmaceutics and
Biopharmaceutics 2004; 2: 365–370.
22.Akhil A, Sharma S, Jha K. The study of salbutamol matrix tablets using different
polymers as release retarding agent. The Pharma Research 2003; 14: 15-22.
23.R. K. Chang, Y. Peng, A. J. Shukla, Polymethacrylate. Handbook of Pharmaceutical
Excipients 5th Ed. American Pharmaceutical Association and Pharmaceutical Press,
Washington DC. 2006; 553-560.
24.Weijia Zheng, Dorothea Sauer, W. McGinity, Influence of hydroxyethylcellulose on the
drug release properties of theophylline pellets coated with Eudragit RS 30 D., Eur. J.
Pharma. Biopharm, 2005; 59: 147–154
25.Jovanovic M., Jovicic G. and Duvic Z., Drug. Dev. Ind. Pharm., 1997; 23(6): 595–602