Abstract—Mammogram analysis usually refers to processing of mammograms with the goal of finding abnormality presented in the mammogram. Mammogram segmentation is one of the most critical tasks in automatic mammogram image analysis. Main purpose of mammogram segmentation is to segment suspicious regions by means of an adaptive threshold. In image processing, one of the most efficient techniques for image segmentation is entropy-based thresholding. This approach uses the Shannon entropy originated from the information theory considering the gray level image histogram as a probability distribution. In this paper, non-Shannon measures (Havrda & Charvat, Renyi and Kapur) of entropy are applied to segment mammograms and their comparison has been done with Shannon entropy. Main advantage of non-Shannon measures of entropy over non-Shannon entropy is that non-Shannon measures of entropy have parameters (
in case of Havrda & Charvat and Renyi and
,
in case of Kapur) that can be used as adjustable values. These parameters can pay an important role as tuning parameters in the image processing chain for the same class of images. Experiments have been conducted on images of mini-MIAS database (Mammogram Image Analysis Society database (UK)). In order to validate the results, several different kinds of standard test images (fatty, fatty-glandular and dense-glandular) of mini-MIAS database are considered. Some typical results are presented to illustrate the influence of the parameters in the thresholding. It has been observed that non-Shannon measures of entropy work effectively for different kind of mammograms. The Results of this study are quite promising. This study can be a part of developing a computer aided decision (CAD) system for early detection of breast cancer.Index Terms—Histogram, Mammogram, Non-Shannon
measures of Entropy, Segmentation, Shannon Entropy, Threshold
I. INTRODUCTION
ANCER is one of the most leading causes of deaths among men and women in the world. Among the cancer diseases, breast cancer is especially a concern in women. According to the statistics, breast cancer is a major
Manuscript received Jan 22, 2011. Asterisk indicates corresponding author.
* Baljit Singh Khehra is with the Department of Computer Science & Engineering, Baba Banda Singh Bahadur Engineering College, Fatehgarh Sahib-140407, Punjab, India ( phone: +919463446505; e-mail: baljitkhehra@ rediffmail.com, [email protected]).
Amar Partap Singh Pharwaha is with the Department of Electronics and communications Engineering, Sant Longowal Institute of Engineering and Technology, Longowal-148106, Sangrur, Punjab, India (e-mail: [email protected] ).
occurrence of cancer in women over the age group of 15-54 years old nowadays all over the world [1]. However, the causes of breast cancer are unknown and no single dominant cause has emerged. Still, there is no known way of preventing breast cancer but early detection is the key to improving breast cancer prognosis.
Mammography is one of the most effective tools in early detection of breast cancer [2]. It is reliable, low cost and highly sensitive method. Mammography offers high- quality images at low radiation doses. Mammography uses low-energy x-rays that pass through a compressed breast and are absorbed by film during an examination. Mammography is the only widely accepted imaging method for routine breast cancer screening. It is recommended that women at the ages of 40 or above should have a mammogram every one to two years [3]. Although mammography is widely used around the world for breast cancer detection, it is difficult for expert radiologists to provide both accurate and uniform evaluation for the enormous number of mammogram generated in widespread screening. There are some limitations of human observers such as some anomalies may be missed due to human error as a result of fatigue. These limitations are the main cause of false positive and false negative readings of mammogram. A false- positive detection causes unnecessary biopsy. It has been estimated that only 15-30% of breast biopsy cases are proved to be cancerous [4]. On the other hand, in a false- negative detection an actual tumor remains undetected. Retrospective studies [5] have shown that 10-30% of the visible cancers are undetected. So, false-positive and false-negative have caused a high proportion of women without cancers to undergo breast biopsies or miss the best treatment time. Thus, there is a significant necessity to improve the correct diagnosis rate of cancer. Several solutions were proposed in the past to increase accuracy and sensitivity of mammography and reduce unnecessary biopsies. Independent double reading of mammograms by two radiologists is one of the solutions and has proved to significantly increase the sensitivity of mammographic screening [6]. The basic idea for independent double reading is to read the mammograms by two radiologists independently. However, this solution is both highly costly and time consuming. Instead of double reading, radiologists have an opportunity to improve their diagnosis with the aid of computer aided detection (CAD) system. It might provide a useful second opinion to radiologists during mammographic interpretation.
The problem of mammogram interpretation using CAD system can be decomposed into two sub-problems. The first deals with the detection and localization of regions of interest (ROIs), which include suspicious areas. Such
Digital Mammogram Segmentation using
Non-Shannon Measures of Entropy
Baljit Singh Khehra, Member, IAENG and Amar Partap Singh Pharwaha, Member, IAENG
problem is called segmentation of mammogram. The second is the characterization of suspicious regions as cancer or non-cancer. This paper deals with the problem of mammogram segmentation. The need of mammogram segmentation arises from several main reasons. One is that approximately or more than one-third of a mammogram is dark breast background, which provides very little information for diagnosis. Additionally, for the purpose of storage and fast retrieval this background should not be included for diagnosis. Another is computational efficiency. Since the size of a mammogram is generally 16 times as large as CT and MR images [7], it will be highly desirable if the dark breast background can be removed while retaining only the suspicious region of breast for future data processing.
The mammogram segmentation process is designed to find suspicious areas, and to separate the suspicious areas from the background that will be used for extracting features of suspicious regions [8]. The extracted features will be used by a suitable classifier to characterize suspicious regions as cancer or non-cancer. The segmentation of mammogram is a very essential and important step that determines the sensitivity of the CAD system. Segmentation methods do not need to be excruciating in finding micro-calcifications and masses locations but the results for segmentation is supposed to include the regions containing all micro-calcifications and masses. Micro-calcifications and masses are the two most important indicators of breast cancer.
Suspicious regions are extracted from the background using a threshold value in the mammogram. Regions having gray levels below the threshold are assigned as background and regions having gray levels above the threshold are assigned as suspicious regions. Thus, suspicious regions correspond to the white regions in the output image. Threshold selection methods can be classified into two groups, namely, global method and local methods [9]. A global thresholding technique is based on the global information, such as the gray level histogram of the image Local threshold techniques partition the given image into a number of sub images and threshold value is determined locally. Main advantages of global thresholding are easy to implement and are computationally less involved. Many techniques for global thresholding have been developed over the years to segment images [10-12]. Among all existing techniques, most techniques use the Shannon entropy [13] originated from the information theory considering the gray level image histogram as a probability distribution. M. Portes de Albuquerque et al. [14] have used Tsallis entropy to determine threshold value. It was later corrected and improved by Prasanna K. Sahoo et al. [15]. All these techniques have been used to determine threshold value in ordinary images not in medical images. Medical images are more sensitive as compared to ordinary images. Suspicious regions of medical images contain clinical information. Thus, correct segmentation of suspicious regions is very important to prevent false positive and false negative readings of mammogram.
In this paper, we propose global thresholding techniques based on non-Shannon measures of entropy to determine
suitable threshold values for segmentation of suspicious regions of mammograms. After this, we apply such techniques in images of mini-MIAS database (Mammogram Image Analysis Society database (UK)) to demonstrate their effectiveness and usefulness.In order to validate the results, several different kinds of standard test images (fatty, fatty-glandular and dense-fatty-glandular) of mini-MIAS database are considered. The Results of this study are quite promising. This study can be a part of developing a computer aided decision (CAD) system for early detection of breast cancer.
This paper is organized as follows: Section 2 describes in brief the basic concepts of Shannon and non-Shannon entropies; Section 3 discusses the basic idea for segmentation of suspicious regions of mammograms based on Shannon and non-Shannon entropies; Experimental results are given and discussed in Section 4; the paper is concluded in Section 5.
II. SHANNON AND NON-SHANNON MEASURES OF ENTROPY Entropy is a concept of information theory. Entropy is used to measure the amount of information [13]. Entropy is defined in terms of the probabilistic behavior of a source of information. In accordance with this definition, a random eventA that occurs with probabilityP
A is said to contain
A
P
A
P
A
I log 1 log
units of information. The amountI
A is called the self-information of eventA . The amount of self information of the event is inversely proportional to its probability. The basic concept of entropy in information theory has to do with how much randomness is in a signal or in a random event. An alternative way to look at this is to talk about how much information is carried by the signal [16]. Entropy is a measure of randomness.Let p1, p2,..., pi,..., pk be the probability distribution of a discrete source. Therefore, 0 pi 1 and
k
i i
p
1
1 , where k is the total number of states. The entropy of a discrete source is often obtained from the probability distribution. Various measures of entropy [17, 18] may be described as
Shannon-Entropy: Shannon entropy can be defined as
ki
i e
i
p
p
S
0
log
Non-Shannon measures of Entropy
a) Renyi’s entropy is defined as
0
,
1
log
1
1
0
k
i i
e
p
b) Havrda and Charvat gave the measure of entropy
0
,
1
1
1
1
0
k i ip
HC
c) Kapur’s entropy
0
,
0
,
log
1
0 0 ,
k i i k i i ep
p
K
III. SEGMENTATION OF SUSPICIOUS REGIONS OF MAMMOGRAMS BASED ON SHANNON AND NON-SHANNON
MEASURES OF ENTROPY
Mammogram is a combination of 3 individual objects namely breast background, tissue background and suspicious region. Breast background does not provide any information in diagnosis. So, breast background can be ignored in mammogram analysis study. Approximately, more than one-third of a mammogram is breast background. It could affect the average gray level value of the breast tissues. Hence, the average gray level value of the breast tissues is defined as follows by excluding breast background pixels [19, 20]
M NR j i
j
i
f
n
k
,,
1
where M and N are dimensions of the mammogram, R is the region having gray level values greater than 100, n is the number of pixels in this region and f(i, j) is the gray level value at the coordinates i and j.
Let p1, p2,..., pk1, pk, pk1,..., pL be the probability distribution of gray level values of mammogram, where
p
k is the normalized histogram of mammogram i.e.
M
N
h
p
k
k
andh
k is the gray level histogramof mammogram. From this distribution, we can derive three probability distributions, one for the breast background, second for the tissue background and third for the suspicious region. The probability distributions of the breast background, the tissue background and the suspicious region are shown as follows:
Probability distribution of breast background:
1 1 1 2 1 1 .., ,... , k k k k P p P p P p
Probability distribution of tissue background:
1 1 1 1 , ,... ,
t k
t k t k k t k P P p P P p P P p
Probability distribution of suspicious region:
t L t t t t P p P p P p 1 , ,... 1 , 1 2 1
where
1 1 1 k i i kp
P
,
t j j tp
P
1, t is the threshold value and L is the maximum gray level value of the mammogram.
Let us first introduce Shannon entropy based thresholding approach. In terms of the definition of Shannon entropy, the entropy of tissue background pixels and the entropy of suspicious region pixels can be defined as follows:
Shannon Entropy for tissue background pixels:
t ki t k
i e k t i TB
P
P
p
P
P
p
t
S
1 1log
Shannon Entropy for suspicious region pixels:
L t i t i e t i SRP
p
P
p
t
S
11
log
1
Shannon entropy based thresholding approach obtains the optimal threshold
t
S
optby maximizing
S
TB
t
S
SR
t
i.e.
S
t
S
t
Arg
TB SRL
k t S
opt
t
max
This optimal threshold separates suspicious region from the tissue background.
Next, let us state Renyi entropy based thresholding approach [21] here. In terms of the definition of Renyi entropy, the entropy of tissue background pixels and the entropy of suspicious region pixels can be defined as follows:
Renyi entropy for tissue background pixels:
t ki t k
i e TB
P
P
p
t
R
1log
1
1
Renyi entropy for suspicious region pixels:
L t i t i e SRP
p
t
R
11
log
1
1
where
1
,
0
Renyi entropy based thresholding approach obtains the optimal threshold
t
R
optby maximizing
R
t
R
t
Arg
TB SRL
k t R
opt
t
max
After Renyi entropy based thresholding approach, Havrda and Charvat entropy based thresholding technique is presented. According to definition of Havrda and Charvat entropy, the entropy of tissue background pixels and the entropy of suspicious region pixels can be defined as follows:
Havrda and Charvat entropy for tissue background pixels:
t ki t k
i TB
P
P
p
t
HC
1
1
1
1
Havrda and Charvat entropy for suspicious region pixels:
L t i t i SRP
p
t
HC
11
1
1
1
Havrda and Charvat entropy has a non-extensive property. Thus, Havrda and Charvat entropy based thresholding approach obtains the optimal threshold
t
HCopt by maximizing
t
HC
t
HC
t
HC
t
HC
TB
SR
1
TB SRi.e.
HC
t
HC
t
t
HC
t
HC
Arg
SR TB SR TB L k t HC optt
max
1
In the last, Kapur entropy based thresholding approach is discussed. From the definition of Kapur entropy, the entropy of probability distribution of tissue background pixels and the entropy of probability distribution of suspicious region pixels can be defined as follows:
Kapur entropy of probability distribution of tissue background pixels:
t ki t k
i t
k
i t k
i e TB
P
P
p
P
P
p
t
K
1 1log
1
Kapur entropy of probability distribution of suspicious region pixels:
L t i t i L t i t i e TBP
p
P
p
t
K
1 11
1
log
1
where
,
0
,
0
Kapur entropy based thresholding approach obtains the optimal threshold
t
K
optby maximizing
t
K
t
K
TB
SR i.e.
K
t
K
t
Arg
TB SRL
k t K
opt
t
max
The optimal threshold
t
opt,*
S
,
R
,
HC
,
K
*
separates suspicious region from the tissue background.
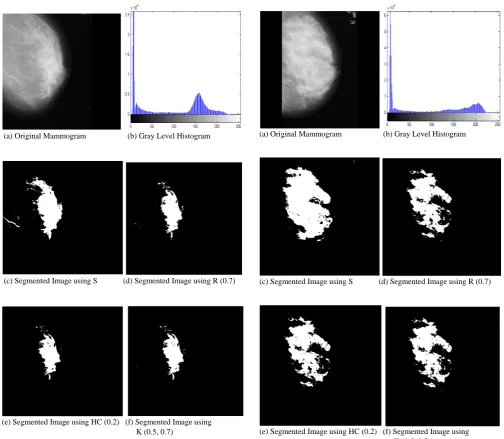
(a) Original Mammogram (b) Gray Level Histogram
(c) Segmented Image using S (d) Segmented Image using R (0.7)
(e) Segmented Image using HC (0.2) (f) Segmented Image using K (0.5, 0.7)
Fig. 1. (a) Fatty-glandular mammogram (mdb218) of mini-MIAS database, (b) its gray level histogram, and (c), (d), (e) and (f) segmented images using Renyi entropy (
0.7), Havrda &Charvat entropy (
0.2) and Kapur entropy (
0.5,
0.7) based techniques respectively(a) Original Mammogram (b) Gray Level Histogram
(c) Segmented Image using S (d) Segmented Image using R (0.7)
(e) Segmented Image using HC (0.2) (f) Segmented Image using K (0.5, 0.7)
[image:5.595.45.550.46.485.2]
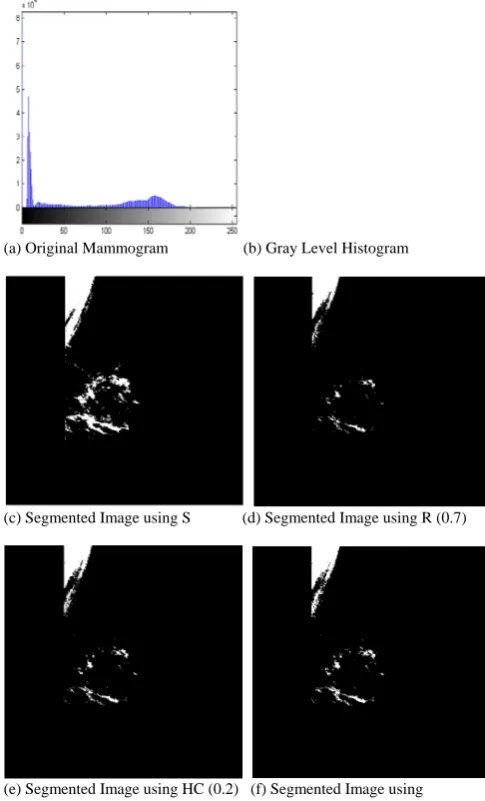
(a) Original Mammogram (b) Gray Level Histogram
(c) Segmented Image using S (d) Segmented Image using R (0.7)
(e) Segmented Image using HC (0.2) (f) Segmented Image using K (0.5, 0.7)
[image:6.595.45.288.52.453.2]Fig. 3. (a) Fatty mammogram (mdb238) of mini-MIAS database, (b) its gray level histogram, and (c), (d), (e) and (f) segmented images using Renyi entropy (
0.7), Havrda &Charvat entropy (
0.2) and Kapur entropy (
0.5,
0.7) based techniques respectivelyTABLE I
THE OPTIMALTHRESHOLD VALUES AT
=0.7 FOR RENYI,
=0.2 FOR HAVRDA & CHARVAT AND
0.5,
0.7 FOR KAPURTest Image
t
S
opt
t
Ropt
=0.7t
optHC
=0.2t
optK7
.
0
5
.
0
mdb218 180 191 194 193
mdb236 186 200 201 201
mdb238 171 179 178 177
mdb219 185 194 198 198
mdb222 186 193 194 194
mdb227 184 193 194 194
mdb240 198 210 210 210
mdb245 177 198 200 199
mdb248 177 192 193 194
mdb253 191 203 205 205
TABLE II
THE OPTIMALTHRESHOLD VALUES AT
=0.1 FOR RENYI,
=0.9 FOR HAVRDA & CHARVAT AND
0.1,
0.9 FOR KAPURTest Image
t
S
opt
t
Ropt
=0.1t
optHC
=0.9t
optK9
.
0
1
.
0
mdb218 180 194 191 195
mdb236 186 201 199 201
mdb238 171 177 179 177
mdb219 185 198 194 199
mdb222 186 194 193 194
mdb227 184 194 193 194
mdb240 198 210 209 210
mdb245 177 201 197 201
mdb248 177 194 182 195
mdb253 191 205 203 206
V. CONCLUSIONS AND FUTURE WORK
In this paper, an attempt is made to analyze d non-Shannon (Renyi, Havrda& Charvat and Kapur) measures of entropy for segmenting digital mammograms. Analysis has been taken on a number of different kinds of mammogram images (fatty, fatty-glandular and dense-glandular) of mini-MIAS database. This study shows that results of non-Shannon (Renyi, Havrda& Charvat and Kapur) measures of entropy to separate suspicious region from the tissue background in mammogram images are satisfactory.
From the proposed study, it is observed that main advantage of non-Shannon measures of entropy over Shannon entropy is that non-Shannon measures of entropy have parameters (
in case of Havrda & Charvat and Renyi and
,
in case of Kapur) that can be used as adjustable values. These parameters can pay an important role as tuning parameters in the image processing chain for the same class of mammogram images. It is also observed that Havrda & Charvat entropy, among non-Shannon measures of entropy, has a non-extensive property. So, Havrda & Charvat entropy based segmentation approach has a capability to tackle the presence of non-additive content in mammogram images. [image:6.595.309.543.73.316.2]ACKNOWLEDGMENT
Authors are greatly indebted to the Department of Electronics and Communications Engineering, SLIET, Longowal-148106 (District: Sangrur) Punjab for providing excellent lab facilities that make this work feasible.
REFERENCES
[1] C. C. Boring, T. S. Squires, T. Tong and M. Montgomery,“Cancer Statistics 1994”, CA-Cancer J. Clinicians, 44, pp.7-26, 1994. [2] H. D. Cheng and Muyi Cu, “Mass Lesion Detection with a Fuzzy
Neural Network”, J.Pattern Recognition, 37, pp.1189-1200, 2004. [3] Jun Xu and Jinshan Tang, “Detection of Clustered Microcalcifications
using an Improved Texture based Approach for Computer Aided Breast Cancer Diagnosis System”, J. CSI Communications, vol. 31, no. 10, pp. 17-20, 2008.
[4] Sickles E, “Breast Calcifications: Mammographic Evaluation”, J.
Radiology, 160, pp.289-293, 1986.
[5] Wallis M, Walsh M and Lee J, “A Review of False Negative Mammography in a Symptomatic Population”, J. Clin. Radiology, 144, pp.13-15, 1991.
[6] Celia Varela, Pablo G. Tahoces, Arturo J. Mendez, Miguel Souto and Juan J. Vidal, “Computerized Detection of Breast Masses in Digitized Mammograms”, J. Computers in Biology and Medicine, vol.37, pp.214-226, 2007.
[7] San-Kan Lee, Chien-Shun Lo, Chuin-Mu Wang, Pau-Choo Chung, Chein-I Chang, Ching-Wen Yang and Pi-Chang Hsu, “A Computer- Aided Design Mammography Screening System for Detection and Classification of Micro-calcifications”, International J. of Medical
Informatics, vol.60, pp.29-57, 2000.
[8] AboulElla Hassanien, “Fuzzy Rough Sets Hybrid Scheme for Breast Cancer Detection”, J. Image and Vision Computing, vol.25, pp.172-183, 2007.
[9] P. K. Sahoo, S. Soltani, A. K. C. Wong and Y. C. Chen, “ A Survey of the Thresholding”, J. Computer Vision Graphic Image Processing, vol.41, pp.233-260, 1998.
[10] C.H. Li and C.K. Lee, “Minimum cross entropy thresholding”, J.
Pattern Recognition, vol.26, pp.617-625, 1993.
[11] Nikhil R. Pal, “On Minimum cross entropy thresholding”, J. Pattern
Recognition, vol.29, pp.575-580, 1996.
[12] Paul L. Rosin, “Unimodal Thresholding”, J. Pattern Recognition, vol.34, pp.2083-2096, 2001.
[13] Shannon, C.E., “A mathematical Theory of Communication”, Int. J.
Bell. Syst. Technical, vol.27, pp. 379-423, 1948
[14] M. Portes de Albuquerque, I. A. Esquef, A. R. Gesualdi, Mello “Image Thresholding using Tsallis Entropy”, J .Pattern Recognition
Letters, vol. 25, pp.1059-1065,2004.
[15] Prasanna K. Sahoo and Gurdial Arora, “Image Thresholding using Two-Dimensional Tsallis-Havrda-Charvat Entropy”, J .Pattern
Recognition Letters, vol. 27, pp.520-528,2006.
[16] Baljit Singh and Amar Partap Singh, “Edge Detection in Gray Level Images based on the Shannon Entropy”, J. Computer Science, vol.4, no.3, pp.186-191, 2008.
[17] J. N. Kapur, “Measures of Information and their Applications”, John
Wiley and Sons Publishers, New Delhi, 1st Edition, pp: 1-20, 1994.
[18] Amar Partap Singh Pharwaha and Baljit Singh “Shannon and non-Shannon measures of Entropy for Statistical Texture Feature Extraction in Digitized Mammograms”, Proc. of World Congress on
Engineering and Computer Science 2009, San Francisco, USA, Oct
20-22, 2009, vol.2, pp. 1286-1291.
[19] H. D. Cheng, Y. M. Lui and R. I. Freimanis, “A Novel Approach to Micro calcification Detection using Fuzzy Logic Technique”, IEEE
Trans. on Medical Imaging,vol.17, no.3, pp.442-450, 1998.
[20] Mohanalin, Prem Kumar Kalra and Nirmal Kumar, “An Automatic Method to Enhance Micro calcifications using Normalized Tsallis Entropy, J. Signal Processing,vol.90, pp.952-958, 2010.