Optimization of Fluence Energy in Relation to
Weld Properties Based on Vogel Approximation
Method
Joseph I. AcheboAbstract - This paper explores the use of the Vogel Approximation Method to determine the best suitable Fluence energy that can produce a mild steel weld of acceptable Ultimate Tensile Strength (UTS). Although this model is most often utilised for optimizing facility location problems, in this study it is uniquely adapted to accurately determine and predict acceptable mild steel fluence energy weld parameters. The UTS was the mechanical property chosen in this study because it defines the ductility and malleability of the weldment, making it suitable for a wide range of engineering applications. In this study, a fluence energy of 3.79kW achieving a UTS of 506 MPa of weldment. W2 was obtained
and found to be suitable. This value falls within an average range of 50 MPa/kW and 150 MPa/kW obtained by other investigators. Other properties were investigated such as the Micro-structural analysis, Brinell Hardness Number (BHN), Charpy V-Notch (CVN) Impact energy, and weld factor. The values obtained show that weldment W2 has the best weld
quality. This study elucidates a step by step approach in the application of the Vogel Approximation Model in determining the optimized Fluence energy.
Index terms: BHN, CVN, fluence energy, microstructure, vogel approximation method, weld factor
1. INTRODUCTION
Different welding machines produce varying amounts of energy input during the welding process for melting the welding electrodes, which in turn, form droplets. Some of this energy input is used to transfer these droplets to the weld pool. This weld pool transition action therefore reduces the amount of the calculated initial input energy. Once this expected loss is taken into account, the input energy will eventually always be in equilibrium with the output energy.
Yang and Debroy [1] wrote that the total energy absorbed by the workpiece in the Gas Metal Arc Welding (GMAW) process consists of two parts: Energy transfer from the arc, and transport of heat along with the metal droplets. The authors emphasized that in the GMAW process, hot metal drops carry a significant amount of thermal and kinetic energy into the weldpool. Khan [2] wrote that energy supplied in welding is usually in the form of heat generated by a flame, an arc, the resistance to an electric current, radiant energy, or by mechanical means (friction, ultrasonic vibrations, or by explosion).
J.I. Achebo is with the Department of Production Engineering, University Of Benin, Benin City, Edo state, Nigeria. (email:
Some of this energy is absorbed by the work pieces being welded, and some energy is also lost as a result of the convective process that occurs between the welding environment and the arc heat. The determined input – output energy has a significant effect, contributing to the achievement of good weld penetration, as well as the formation of desirable, and uniform bead geometry. The ascertained mechanical properties of the eventual weldment, serve as a reliable criteria for determining the success and desirability of the weld itself.
Thus, understanding, influencing, and optimizing the fluence energy inherent in the weld process could lead to significantly improved weld bead geometry, with the desired mechanical properties especially the Ultimate Tensile Strength (UTS).
Studies have shown that applying too much heat input energy would increase the kinetic energy of the metal droplets which could lead to the formation of spatter. Spatter tends to encourage the formation of weld micro-craters, and since blazing hot metallic materials quickly absorb atmospheric moisture, these undesirable micro-craters are likely to absorb and retain moisture. If left uncontrolled, this moisture content initiates an unwelcome domino effect. The presence of water leads to oxidization of the adjacent weldment molecules surrounding the micro-craters. What invariably follows is that the weldment, upon solidification, becomes brittle, which would eventually exert a negative effect on the quality of the weld bead geometry in general.
On the converse, a less than optimal energy input could lead to undercuts, inadequate weld penetration, and inadequate molten weld metal mixing; conditions which similarly lead to unsatisfactory weldments.
II. MATERIALS AND METHODS
A GMAW machine is used to melt 3.2 mm mild steel electrodes, utilizing a combination of 90%Ar + 10% CO2
shielding gas with a flow rate of 18 l/min. Measurements of process parameters were taken as indicated in the equations specified here under:
Paleocrassas and Tu [3] proposed an equation for determining the amount of energy deposited per area for a unit length of weld also known as Fluence, F as:
(1)
Where P is the total power, defined as P = IE, where I is the welding current in Amperes, and E is the arc voltage in volts, v is the welding speed, m/s, whereas, r represents the wire radius, mm.
In this study the Fluence was regarded as the input energy, Ein. Different energy levels were achieved by varying the
welding speed.
The output energy was obtained from the equation:
(2) Balkan et al [4] determined the total amount of energy transferred onto the weld surface as:
(3)
where To is the preheat temperature, Cp is the specific heat
capacity, qv is the volume flow rate of liquid metal, obtained
from:
, / (4)
wf is the wire feed rate obtained from wf = 0.0258Im
Where Im is the mean current and r is the radius of the
welding wire.
Cp is the specific heat capacity, ρ is the density of the molten
metal, v is the welding speed and T is the melting temperature.
In this case, the welding speed and melting temperature were varied in order to achieve the output energy. Balkan et al [4] proposed an equation for evaluating weld strength, weld factor (fw), which is also known as comparative weld
strength, it is expressed as:
(5)
Where and are strengths of a weld and its base
material.
The Ultimate Tensile Strength, UTS of the material was obtained from a stress-strain curve developed by an Avery Extensometer used to conduct the weld tensile test. A Charpy V-Notch (CVN) Impact tester was used to determine the toughness of the weld material. The hardness tester was used to determine the Brinell Hardness Number (BHN) of the weld.
III. VOGEL APPROXIMATION METHOD Banjoko [5] described this model as an improvement over North West Corner Rule. He explained the steps to be followed in using this model as follows:
1. Calculate the difference between the two smallest unit cost cells for each row and column;
2. Then select the row or column with the largest difference and make the largest feasible allocation into the cell having the smallest unit cost;
3. Once a row or column requirement has been
satisfied, remove it from further consideration; 4. Repeat steps 1, 2, and 3 until m + n – 1 (i.e, number
of rows plus number of columns minus one) cells have been occupied.
[image:2.595.299.557.539.736.2]IV. PRESENTATION AND DISCUSSION OF RESULTS The Vogel Approximation Method is utilized considering the equilibrium input-output energy equations in this study as expressed in Tables 1 – 6.
Table 1: Input-Output Energy with their corresponding UTS Welding Electrode, UTS
(MPa) Input Energy,
KJ/m
C1 C2 C3
Basemetal
X1 595 468 506 4.05
X2 709 405 610 5.95
X3 350 586 427 8.54
Output Energy KJ/m
5.19 6.21 7.14 18.54
In applying the Vogel Approximation Method, we allocate energy to the least UTS value and also from the two least UTS values in each row and column, subtract the smallest value from the other one. This leads to the creation of Table 2.
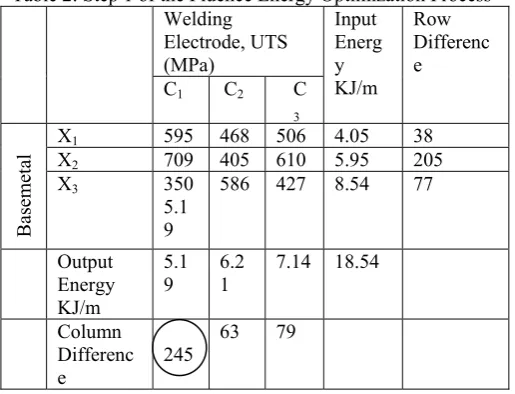
Table 2: Step 1 of the Fluence Energy Optimization Process
Welding
Electrode, UTS (MPa)
Input Energ y KJ/m
Row Differenc e
C1 C2 C
3
Basemetal
X1 595 468 506 4.05 38
X2 709 405 610 5.95 205
X3 350
5.1 9
586 427 8.54 77
Output Energy KJ/m
5.1
9 6.21 7.14 18.54
Column Differenc
e 245
63 79
From Table 2, column C1 has the highest value difference.
Table 3: Step 2 of the Fluence Energy Optimization Process Welding Electrode, UTS (MPa) Input Energy KJ/m Row Difference
C2 C3
X1 468 506 4.05 38
X2 405
5.95 610 5.95
X3 586 427 3.35 159
Output
Energy KJ/m 6.21 7.14 13.35
Column
Difference 63 79
In Table 3, row X2 has the largest difference between the
[image:3.595.41.280.331.493.2]two least UTS values. Therefore, it is eliminated and the energy value is allocated to the least UTS value in the matrix. This eventually leads to the formation of Table 4.
Table 4: Step 3 of the Fluence Energy Optimization Process
In Table 4, energy value is allocated to the least UTS value and the larger row difference is eliminated. This exercise leads to the formation of Table 5.
Table 5: Step 4 of the Fluence Energy Optimization Process Welding
Electrode, UTS (MPa)
Input Energy KJ/m
C2 C3
X1 468
0.26 506 3.79 4.05 Output Energy
KJ/m 0.26 3.79 4.05
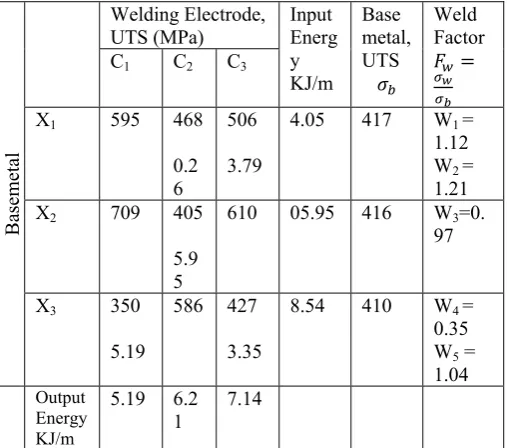
Table 6 shows the final optimization process, where all the selected parameters are presented including the computed weld factor.
Basemetal
Welding Electrode,
UTS (MPa) Input Energ
y KJ/m Base metal, UTS Weld Factor
C1 C2 C3
X1 595 468
0.2 6 506 3.79
4.05 417 W1 =
1.12 W2 =
1.21
X2 709 405
5.9 5
610 05.95 416 W3=0.
97
X3 350
5.19
586 427 3.35
8.54 410 W4 =
0.35 W5 =
1.04
Output Energy KJ/m
5.19 6.2
1 7.14
From Table 6, the selection process outlays are determined as shown in Table 7:
Table 7: Weldment Selection Outlay Weldment
W1 W2 W3 W4 W5
468 0.26 1800 506 3.79 133.5 405 5.95 68.07 350 5.19 67.4 427 3.35 127.5
From Table 7, it is seen that 1kW of Fluence Energy was used to achieve a weldment with a UTS of 1800 MPa. This value of UTS has not been reported in the literature for mild steel. This further indicates that a UTS of 1800 MPa/kW of Fluence energy may not be achievable. Mostly an average range of 50 MPa/kW – 150 MPa/kW has been reported for low to high strength steels, but since W2 (see Table 7) was
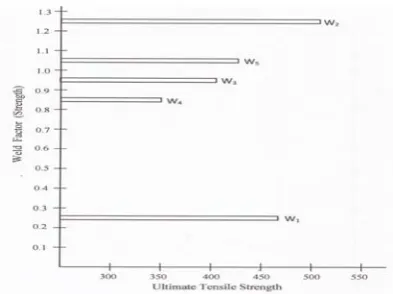
found to have the highest UTS value, it is therefore, regarded as the most viable requiring a considerable lower energy input. The UTS value of 506 MPa is the most economically desirable weldment strength with a Fluence energy of 3.79kJ/m (see Fig. 1 and 2). Eagar [6] wrote that heat energy power densities of approximately 1000 W/cm2
are required to melt most metals. Fluence energy is the energy utilized for welding per spot per area, compared with the initial welding energy of 18.54 KJ/m, only about 20.4% of the entire input energy was used. Eagar [6] cited in his paper that for arc welding, as little as half of the heat generated may enter the plate, and only 40% of this heat is used to fuse the metal. For oxyacetylene welding, Eagar [6] said that the heat entering the metal may be 10% or less of the total heat, and the heat necessary to fuse the metal may be less than 2 % of the total heat. Shih [7] wrote that 35% of the energy of an AC welding machine was used to produce good quality welds. The amount of energy used to weld the base metal can be affected by the type of alloying elements, the atmospheric condition of the arc column, and welding Welding Electrode, UTS (MPa) Input Energy KJ/m Row Difference
C2 C3
X1 468 506 4.05 36
X2 586 427
3.35
3.35
Output Energy KJ/m
- 0.26 7.14 7.40
[image:3.595.309.558.343.463.2]Table 8: Chemical Compositions of Weldments
Weldment Alloying Elements
Al C Mn Cr Mo Si Cu N P S Ti Nb O
W1 0.002 0.16 1.36 0..065 0.04 0.08 0.04 0.005 0.016 0.028 0.002 0.04 0.003
W2 0.004 0.23 1.28 0.042 0.06 0.16 0.02 0.002 0.010 0.035 0.004 0.08 0.008
W3 0.008 0.12 1.42 0.028 0.12 0.10 0.06 0.008 0.015 0.052 0.010 0.12 0.004
W4 0.007 0.19 1.14 0.082 0.09 0.12 0.10 0.008 0.05 0.043 0.012 0.18 0.006
W5 0.010 0.18 1.41 0.038 0.07 0.09 0.12 0.006 0.04 0.064 0.021 0.06 0.008
conditions. For instance, carbon is a hardening element, a high amount of carbon would require a great amount of energy to disintegrate. Alloying elements, therefore, have a great influence on the UTS of a weldment, as they can either increase or reduce the UTS.
The weld metals, W1 – W5 produced by the selected
Fluence energies were subjected to chemical composition test as shown in Table 8.
From Table 8, weldment, w2, appears to have better
strength with a higher value of carbon and silicon, and proportionate values of chromium and sulphur. These alloying elements contribute immensely to improved weld metal strength. This claim is supported by weld factor of 1.21 (see Table 6). This indicates that weldment W2 has the
highest strength value.
Since weldment W2 is chosen as the weld with the best
qualities, some mechanical tests were carried out to validate this claim. From the tests elucidated in Fig.3, it is apparent that W2 has a better weld quality; with a Brinell Hardness
Number (BHN) of 460, and a Charpy V-Notch (CVN) Impact value of 120 J. However, weldment, W5 has a higher
BHN but much lower CVN value. This indicates that W5 has
[image:4.595.305.507.422.585.2]a lower strength and a lower ability to absorb impact loads, therefore its higher BHN value indicates that the weldment material has traces of brittleness in it.
Fig 1: Weld Factor Vs Ultimate Tensile Strength
Fig. 2: Weld Factor Vs Welding Energy
Fig. 3: BHN, CVN Vs Weldment V. CONCLUSION
The Vogel Approximation method was used to select five weldments with denotations spanning from W1 to W5, along
with their fluence energies and corresponding UTS. The five weldments’ chemical composition analysis, microstructural analysis, BHN, CVN, and weld factor, were carried out.
Weldment W2 was found to have the best mechanical
[image:4.595.48.245.557.704.2][1] Z, Yang and T, Debroy “Modeling Macro and Microstructures of Gas Metal Arc Welded HSLA-100 Steel” Metall and Mater.
Trans B, vol. 30B,1999, pp.483 – 493
[2] I, Khan “Welding Science and Technology”. New Age
International Publishers, New Delhi, 2007, pp. 49-50. [3] A.G. Paleocrassas and J.F. Tu “Low speed laser welding of
aluminum alloy 7075 – T6 using a 300W, single mode, ytterbium fiber laser”. Weld J. vol.86, 2007, pp181s – 182s.
[4] O, Balkan, H, Demirer, and H, Yildirim “Morphological and Mechanical Properties of Hot Gas Welded PE, PP and PVC Sheets”. J of Achievem in Mater and Manufg Eng, vol. 31, issue 1, 2008, pp.60
[5] S.A. Banjoko Production and Operations Management.
Wisdom Publisher Ltd, Ibadan, 1994.
[6] T.W. Eagar (2012/03/18) Energy Sources Used for Fusion Welding [online]Available: http://eagar.mit.edu/3.37/H-337-24.pdf)