Mathematical modelling of cancer invasion:
Implications of cell adhesion variability for tumour
infiltrative growth patterns
Pia Domschkea,b,∗, Dumitru Trucub, Alf Gerischa, Mark Chaplainb
aTechnische Universit¨at Darmstadt, Department of Mathematics, Dolivostr. 15
64293 Darmstadt, Germany
bUniversity of Dundee, Division of Mathematics, Dundee DD1 4HN, Scotland, UK
Abstract
Cancer invasion, recognised as one of the hallmarks of cancer, is a complex, multiscale phenomenon involving many inter-related genetic, biochemical, cellular and tissue processes at different spatial and temporal scales. Central to invasion is the ability of cancer cells to alter and degrade extracellular mat-rix. Combined with abnormal excessive proliferation and migration which is enabled and enhanced by altered cell-cell and cell-matrix adhesion, the can-cerous mass can invade the neighbouring tissue. Along with tumour-induced angiogenesis, invasion is a key component of metastatic spread, ultimately leading to the formation of secondary tumours in other parts of the host body.
In this paper we explore the spatio-temporal dynamics of a model of cancer invasion, where cell-cell and cell-matrix adhesion are accounted for through non-local interaction terms in a system of partial integro-differential equations. The change of adhesion properties during cancer growth and development is investigated here through time-dependent adhesion charac-teristics within the cell population as well as those between the cells and the components of the extracellular matrix. Our computational simulation res-ults demonstrate a range of heterogeneous dynamics which are qualitatively similar to the invasive growth patterns observed in a number of different
∗Corresponding author
Email addresses: [email protected](Pia Domschke),
[email protected] (Dumitru Trucu),[email protected]
types of cancer, such as tumour infiltrative growth patterns (INF).
Keywords: Non-local model, Cancer invasion, Heterogeneity
1. Introduction
The development and spread of cancer in the human body is a complex, multistage process, consisting of interconnected spatio-temporal multiscale phenomena, ranging from genes and molecules to cells and tissue. Invasion of the surrounding tissue by cancer cells plays a central role in solid tumour progression, and is a key stage in the metastatic spread of the disease. It is defined as one of the “hallmarks of cancer” by Hanahan and Weinberg (2000, 2011).
Cancer invasion itself is a complicated multiscale process, in which cell-scale dynamics both influence and are influenced by the tissue-cell-scale evolu-tion of the tumour, or cancerous mass, and the tumour microenvironment. By combining excessive proliferation with the secretion of a variety of mat-rix degrading enzymes, as well as altered adhesive properties and migratory behaviour, cancer cells have the ability to break through tissue compart-ments (Weinberg, 2006) and are able to invade locally the surrounding tissue. Coupled with tumour-induced angiogenesis, cancers possess a deadly ability to metastasise — spreading to secondary locations in the host body, giving rise to secondary tumours.
Recognised as playing a key role in all cell migratory dynamics, cell-cell and cell-matrix adhesion are particularly important during cancer invasion (Behrens et al., 1989; Byers et al., 1995; Larebeke et al., 1992; Le et al., 1998; Umbas et al., 1992; Zheng et al., 2005). The past few decades have witnessed intensivein vivo andin vitro research efforts focused on exploring the impact of adhesion on the morphology and direction of migratory tumour cell patterns arising in cancer invasion (Friedl et al., 1995; Kolega, 1981; Pierce et al., 1978).
Among transmembrane proteins,cadherins have been identified as having a major contribution to cell adhesion (Weinberg, 2006). These are calcium-dependent adhesion molecules that interact with intra-cellular proteins, most notably β-catenin, to form adherence junctions between cells in human tis-sue (Juliano, 2002). The homeostasis of this important molecular process is essentially altered during cancer progression, where a reduction in cell-cell adhesion favours an increase in motility of highly migratory cancer cell-cells within the invading tumour (Umbas et al., 1992). An important role in cell-cell adhesion is played by cell-cell signalling mechanisms based on the interactive dynamics between the calcium-sensing receptor distribution and
Ca2+ ions from the extracellular matrix (Hills et al., 2012; Hofer et al., 2000; Ko et al., 2001), which is significantly changed during cancer invasion. The direct correlation between this calcium-based cell signalling mechanism and the regulation of E-cadherin and β-catenin was first discovered in colon car-cinoma (Bhagavathula et al., 2007).
matrix stiffness and exploit the ECM confinement to progress further into the surrounding tissue (Hung et al., 2013; Pathak and Kumar, 2012; Zaman et al., 2006).
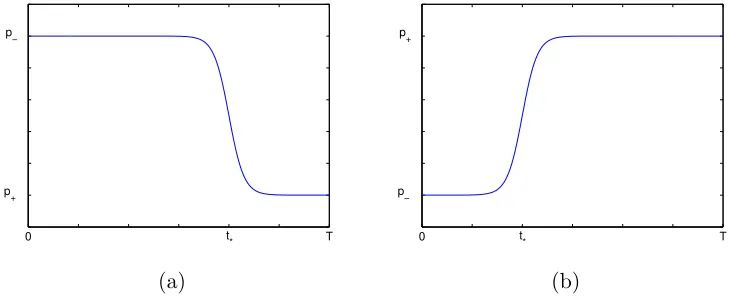
The interplay between cell-cell and cell-matrix adhesion has been recog-nised to play an important role in determining patterns of invasive spread at the tissue level. The invasive growth pattern of a solid tumour can be examined and pathologically evaluated using the so-called infiltrative growth pattern (INF) classification. An invasive tumour can be classified histopath-ologically into three main categories – INFa, INFb and INFc – using the following definitions from the Japanese Gastric Cancer Association (2011):
• INFa – an invading tumour showing an expansive growth with a distinct border from the surrounding tissue/stroma;
• INFb – an invading tumour showing an intermediate pattern between INFa and INFc;
• INFc – an invading tumour showing an infiltrative growth with no distinct border from the surrounding tissue/stroma.
Figure 1 shows all three types of tumour infiltrative patterns observed in oesophageal cancer and lung squamous cell carcinoma. As can be observed, there is progressively more heterogeneity of the patterns observed from INFa to INFb to INFc, with more mixing of cancer cells with stroma and a more poorly defined border between the cells and the normal tissue. Recently, the invasive infiltrative growth patterns of malignant solid tumours have been considered as potential prognostic factors for stomach, gallbladder, bladder and oesophageal cancer (Ito et al., 2012; Kr¨uger et al., 2004; Luebke et al., 2005; Okada et al., 2009). The Japanese classification of oesophageal cancer notes that the differences between the three categories of the classification depend on the relative strength of invasion and proliferation in the peripheral area of cancer nests (groups of cancer cells) (Japan Esophageal Society, 2009). Cancer nests themselves often display heterogeneous invasive patterns (Ito et al., 2012; Japanese Gastric Cancer Association, 2011; Masuda et al., 2012; Ueda et al., 2007). Nonetheless, the classification is still rather basic and additional insight, such as that which could be provided by mathematical modelling, would be beneficial.
(a) (b)
Figure 2: Figures showing (a) a phyllodes tumour; (b) an intermedi-ate grade ductal carcinoma in situ (DCIS). Images with permission from
www.breastpathology.info
accounts for 2.5% of all fibroepithelial lesions of the breast) and Figure 2b an example ductal carcinoma in situ (DCIS). In each case in these examples the interface between the tumour and adjacent normal tissue has a rounded non-invasive contour which correlates with clinical behaviour. Both of these lesion types have the potential to progress to invasion with characteristic alterations of their interfaces – more aggressive phyllodes tumours with a tendency to local recurrence have a more infiltrative edge, while DCIS can transform into invasive tumours where one starts to see tongue-like projections extending into adjacent tissues.
Despite all the experimental advances, bothin vivo andin vitro, that have increased our understanding of cancer growth, metastatic spread of cancer in the human body continues to be one of the main challenges for the medical and scientific community.
Orme and Chaplain, 1996) and metastasis (Anderson et al., 2000). Recently, these modelling efforts have been expanded to try to develop models which reflect the multiscale character of cancer invasion (Deisboeck et al., 2011; Macklin et al., 2009; Ramis-Conde et al., 2008; Trucu et al., 2013). The central role of cell-cell and cell-matrix adhesion in tumour cell invasion has received a special attention (Andasari and Chaplain, 2012; Anderson, 2005; Byrne and Chaplain, 1996; Chaplain et al., 2011; Painter et al., 2010; Ramis-Conde et al., 2008; Turner and Sherratt, 2002), remaining one of the core challenges in mathematical modelling.
In this paper we develop an earlier model of Gerisch and Chaplain (2008) who introduced cell-cell and cell-matrix adhesion into a model of cancer in-vasion using a non-local term (originally considered in a model of cell sorting by Armstrong et al. (2006)). The model studied here is a system of partial integro-differential equations describing the interactions of cancer cells, extra-cellular matrix and matrix degrading enzymes. In particular we investigate in some detail the role of cell-cell and cell-matrix adhesion, as well as the effect of additional new populations of cancer cells arising from mutations. The structure of the paper is as follows: in the next section we describe our model and the variables involved; in Sections 3 and 4 we present the results of our computational simulations; in the final section, we discuss our results in light of observed infiltrative growth patterns of cancers and give directions for future work and further development of the model.
2. A Non-Local Model of Cancer Invasion
2.1. Model formulation
Gerisch and Chaplain (2008) proposed and investigated a non-local model of cancer invasion for a single cancer cell population. Here we extend the model to explore the effects of varying the cell-cell and cell-matrix adhesion properties of the cancer cells through time-dependent parameters within the context of n cancer cell sub-populations c1, c2, . . . cn, which may mutate
se-quentially into each other,ci →ci+1. We now describe the general framework of the modelling approach.
LetD ⊂Rp, p∈ {1,2,3}, denote the bounded spatial domain and I
T =
• the vector-valued cancer cell density, c= (ci) :IT × D → Rn,
• the extracellular matrix (ECM) density, v :IT × D →R, and
• the matrix-degrading enzyme (MDE) concentration, m:IT × D →R. The unit of the cell densities is [cells/cm3], that of the ECM density is [mg/cm3], and that of the MDE concentration is [nM]1. At this point we wish to make explicit that here ECM density refers to the mass density of fibrous proteins, in particular collagen, in the ECM. For a compact notation we also define the combined vector of the cell and ECM densities
u(t, x) := (c(t, x)T, v(t, x))T.
In our model, some processes are limited according to spatial constraints and therefore we define the volume fraction of occupied space,
ρ(t, x)≡ρ(u(t, x)) :=ϑvv(t, x) +ϑc n
X
i=1
ci(t, x).
Here we postulate that cancer cells at density ci occupy a fraction ϑcci of
physical space and, accordingly, that ECM at density v occupies a fraction
ϑvv of physical space. Note that we assume that the amount of MDE present
is negligible for the volume fraction of occupied space.
In the following we present and explain the model equations governing the evolution of c, v, andm. We denote by∇c(t, x)∈Rn,p and ∇m(t, x)∈
R1,p the Jacobian matrices in (t, x) of the vector field c and of m, respectively. Furthermore, ∇· denotes the divergence operator which acts row-wise on, e.g., ∇c(t, x).
The evolution of the cancer cell sub-population densities is driven by cell random motility, cell-cell and cell-matrix adhesion-mediated directed migra-tion, proliferamigra-tion, and mutations between the cancer cell sub-populations. This can be expressed as
∂c
∂t =∇ ·[D∇c−diag(c)A(t, x,u(t,·))] +P(t,u)c+M(t,u)c. (1)
1The molarity or molar concentration of a solution with 1 mole particles per litre is
Here, the diagonal matrix D = diag(D1,1, . . . , D1,n) ∈ Rn,n contains the
random motility coefficients D1,i > 0 of the cancer cell sub-populations. In
this work we assume that these are constants.
Adhesion-mediated directed cancer cell migration is represented in (1) using the non-local operator
A(t, x,u(t,·)) :=
A1(t, x,u(t,·))T
A2(t, x,u(t,·))T ..
.
An(t, x,u(t,·))T
∈Rn,p,
which maps (t, x) together with the space-dependent function u(t,·), that is
c(t,·) andv(t,·), to ann×pmatrix. Rowiin that matrix, i.e. Ai(t, x,u(t,·))T,
represents the velocity of directed cancer cell migration of sub-population i
which is induced by cell-cell and cell-matrix adhesion properties of cancer cells and ECM. Here cell-cell adhesion refers to adhesion between cells of sub-population i itself,self-adhesion, as well as between cells of sub-population i
and sub-population j 6=i, cross-adhesion. The velocity for sub-population i
is defined by the following vector-valued integral, cf. Armstrong et al. (2006) and Gerisch and Chaplain (2008),
Ai(t, x,u(t,·)) =
1
R
Z
B(0,R)
n(y)·Ωi(kyk2)·gi(t,u(t, x+y)) dy . (2a)
Here, R > 0 is the sensing radius, B(0, R) ⊂ Rp is the ball of radius R
centred at zero, and for x ∈ D the set x+B(0, R) is the sensing region at
x. Note that for points x∈ D, which are so close to the boundary ofD such that x+B(0, R) 6⊂ D, the integral in Eq. (2a) is not yet well-defined; we resolve this issue when discussing the boundary conditions for our model at the end of this section. For y ∈ B(0, R), the unit vector pointing from x to
x+y, is denoted by n(y), i.e.
n(y) := (
y/kyk2 if y 6= 0
0∈Rp otherwise . (2b)
Furthermore, Ωi(r), withr:=kyk2, is theradial dependency function for sub-population i. It characterizes the relative importance of points at distance r
and normalised such that 1 =
Z
B(0,R)
Ωi(kyk2) dy . (2c) Specific instances of Ωi are specified later. Finally, the function gi(t,u) is the
i-th component of
g(t,u)≡g(t,c, v) = [Scc(t)c+Scv(t)1v]·(1−ρ(u))+ . (2d)
In the above, 1 ∈ Rn is the all-one vector, S
cv(t) ∈ Rn,n is the diagonal
matrix containing the non-negative cell-matrix adhesion coefficients of all cancer cell sub-populations with the ECM, and Scc(t)∈Rn,n represents the
symmetric matrix containing the non-negative cell-cell adhesion coefficients. Note that these matrices may have coefficients depending explicitly on time. We introduce the additional notation thatSci,cj := (Scc)i,j is the self-adhesion
coefficient of sub-population i if i = j and the cross-adhesion coefficient between sub-populations i and j if j 6= i. Furthermore (Scv)i,i =:Sci,v. As
usual, the positive part of an expression is denoted by (·)+:= max{0,·} and the factor (1−ρ(u))+ models an inhibition of migration due to volume filling effects, see e.g. Hillen and Painter (2001).
The diagonal matrix P(t,u(t, x)) ∈ Rn,n multiplied by c in (1) models
cancer cell proliferation. With the factor c we make explicit that cells of sub-population i may proliferate only if they already exist.
Cancer cells mutate and thus change from one cancer cell sub-population to another one. This gives rise to a model with a total of n cancer cell sub-populations. The matrix M(t,u(t, x)) ∈ Rn,n multiplied by c in (1),
represents the effect of mutations. As in the case of the proliferation term, the factor c makes explicit that cells of sub-populationi may mutate only if they already exist. Since mutations of cells of sub-population i correspond to a loss of cells in that sub-population and mutations of other cells into cells of sub-population i correspond to a gain of cells in that sub-population, the diagonal elements of M must be non-positive and the off-diagonal elements of Mmust be non-negative. Furthermore, in order to ensure conservation of cell mass, we require that the column sums of M equal zero, i.e.
n
X
i=1
Mij = 0, for j = 1,2, . . . , n.
structural conditions may apply and give rise to a lower triangular or even a full matrix M.
The evolution of the ECM density is governed by MDE-mediated matrix degradation as well as ECM remodelling. This is expressed as
∂v
∂t =−γmv+ψ(t,u), (3)
where ψ(t,u) represents the ECM remodelling term, and γ is the rate con-stant of ECM degradation due to the presence of MDEs. We require that
v = 0 implies that ψ(t,u) ≥ 0 as this will ensure the non-negativity of the ECM density.
Finally, the evolution of the MDE concentration is determined by mo-lecular diffusion of the enzymes, by natural decay, and by the secretion of MDEs by the cancer cell sub-populations into the tumour microenvironment. Hence we obtain
∂m
∂t =∇ ·[D3∇m] +α
T
c−λm . (4)
In the above equation, D3 is the positive MDE diffusion constant, α ∈ Rn is the non-negative vector of MDE secretion rates by the cancer cell sub-populations, and λ is the non-negative decay constant.
The system (1)–(4) is supposed to hold for x ∈ D and t ∈ IT and is
complemented with zero-flux boundary conditions for c and m, that is [D∇c−diag(c)A(t, x,u(t,·))]·n(x) =0
∇m·n(x) = 0 fort ∈ IT , x∈∂D, (5)
where n(x) denotes here the unit outer normal vector on ∂D inx∈∂D, and initial conditions for all equations
c(0, x) = c0(x), v(0, x) =v0(x), m(0, x) = m0(x) for x∈ D. (6) The zero-flux boundary conditions for the cancer cell sub-populations imply that cells cannot cross the boundary of the domain D and in par-ticular cannot sense any adhesive signals outside D. Thus we set function
gi(t,u(t, x+y)) := 0 if x +y 6∈ D; then the integral in Eq. (2a) is
2.2. Non-dimensionalisation of the model and model parameters
We non-dimensionalise system (1)–(6) by introducing the following di-mensionless quantities
˜
t = t
τ , x˜= x
L, c˜(˜t,x˜) =
c(t, x)
c∗
, ˜v(˜t,x˜) = v(t, x)
v∗
, m˜(˜t,x˜) = m(t, x)
m∗
.
(7) Based on a typical cancer cell volume of 1.5×10⁻⁸cm3, see Anderson (2005) and references cited there, we set
ϑc= 1.5×10⁻⁸cm3/cell
and define below the scaling parameter c∗ as the inverse of ϑc, i.e. as the
maximum cell density such that no overcrowding occurs. In Abreu et al. (2010) it is stated that the collagen density in engineered provisional scaffolds should be between 2 and 4 mg/cm3 for in vivo delivery. We take the upper limit as scaling parameter v∗ for the ECM density. Assuming that ECM at this density fills up all available physical space, we obtain 1 =ρ(0, v∗) = ϑvv∗ and thus
ϑv :=
1
v∗
.
The scaling parametersτ andLare chosen as in Gerisch and Chaplain (2008) and, as in loc. cit., the value of the scaling parameterm∗remains unspecified. In summary, we obtain
τ = 104s, L= 0.1cm, c∗ = 1
ϑc
≈6.7×10⁷cells/cm3, v∗ = 1
ϑv
= 4mg/cm3.
(8) With the scalings as defined in Eq. (7) we obtain the non-dimensional system which looks identical to (1)–(6) but each quantity having a tilde; the appropriate non-dimensional model parameters are given in Table A.1 and the units as well as the non-dimensionalisation of intermediate quantities are collected in Table A.2, see Appendix A. The non-dimensionalisation is mostly standard but for the convenience of the reader we detail the non-dimensionalisation of the non-local term in Appendix B.
2.3. Specific choices for simulations in two spatial dimensions
In this study we consider spatially two-dimensional (p= 2) simulations. The spatial domain D = (−1.5,1.5)2 and the final simulation time is set to
T = 60.
Remark 1. In all figures with simulation results, expect noted otherwise, we display in all plots, as in Gerisch and Chaplain (2008), the central part
(−1,1)2 of D only. In this region the formation of the different patterns can be seen and in most of the plots the invasion of the cancer cells has not yet reached the boundary of D at final time T = 60 such that influences of the boundary conditions on the invasion patterns are negligible.
In the definition of the non-local term, Eq. (2a), we use the radial de-pendency function, see Gerisch and Chaplain (2008),
Ωi(r) := Ω(r) =
3
πR2
1− r
R
for i= 1, . . . , n . (9) This implies that points in the sensing region at x have, with increasing distance r fromx, a decreasing influence on adhesion-driven migration in x. In our simulations we use the following initial functions in (6). First of all, only cancer cell sub-populationc1 is present initially forming a cancerous mass centred at the origin
c1,0(x) := exp(− kxk22/), := 10−2, ci,0(x) := 0, i= 2, . . . , n . (10a)
For the initial ECM density we assume a heterogeneous distribution such that ρ(u(0, x))≤1 is satisfied. This is achieved using
(x1, x2) := 1
3(x+ 1.5)∈[0,1]
2 for x∈ D, ζ := 6π ,
h(x1, x2) := 1 2+
1
2sin(ζx1/(x2+ 1))·sin(ζx1x2)·sin(ζ(1−x1)/(x2+ 1))
·sin(ζ(x1−1)(x2 −1)),
v0(x) := min
h(x1, x2),
1−ϑcc1,0(x)
ϑv
.
(10b) Finally, we assume that cancer cells have already released some MDE into their environment and set
Below we will consider simulations where a parameterpchanges its value from an initial valuep− to a final value p+ around the time pointt∗ and con-sider two types of transition functions. The first type of transition function is an immediate switch from p− to p+ att∗ and is defined by
p(H)(t;p−, p+, t∗) :=p−+ (p+−p−)H(t−t∗). (11) Here, H(·) denotes the Heaviside step function. The second type is a more gradual, smooth change from p− to p+ around t∗ and is defined by
p(T)(t;p−, p+, t∗) := 1
2(p−+p+)− 1
2(p−−p+) tanh (C(t−t∗)). (12) The constant C > 0 accounts for the width of the “transition” from p− to
[image:14.612.122.490.375.525.2]p+ and is chosen to be C = 1/3 in all simulations. Figure 3a illustrates the behaviour of this transition for a decreasing function, i.e. p− > p+, and Figure 3b for an increasing function, i.e. p− < p+.
0 T
p
−
p
+
t
*
(a)
T
0 t
*
p
−
p
+
(b)
Figure 3: Plot of p(T)(t;p−, p+, t∗) with (a): p− > p+, (b): p− < p+, and
t∗ ∈(0, T) as indicated. (T = 60,C = 1/3)
Remark 2 (Numerical technique). The simulations of the model equa-tions were all performed in Matlabr using the mTDR system
spatial discretisation on a uniform grid with grid width h = 1/200 results in an initial value problem for a large system of ordinary differential equa-tions, which is then solved by using the ROWMAP time integration scheme (Weiner et al., 1997), a Fortran subroutine called from Matlabr. For the
time integration we use a relative and absolute tolerance of 10−5.
In the following sections we explore this cancer invasion modelling frame-work. We focus on one and two cancer cell sub-populations situations, with both constant and time-dependent adhesion coefficients.
3. The Non-Local Model for a Single Cancer Cell Population
Consider, initially, a single cancer cell population c1 =: c and a model where the (nondimensionalized) equations (1), (3), and (4) are as follows:
∂c
∂t =∇ ·[D1,1∇c−cA(t, x,u(t,·))] +µ1,1(t)c(1−ρ(u)), ∂v
∂t =−γmv+µ2(1−ρ(u))
+,
∂m
∂t =∇ ·[D3∇m] +α1c−λm ,
(13)
with the non-local term A as given in (2a), and the function g defined in (2d) is specified by:
g(t,u) = [Scc(t)c+Scv(t)v]·(1−ρ(u))+.
We have further chosen P(t,u) = µ1,1(t)(1−ρ(u)) yielding a logistic-type growth law for the cancer cells with competition for space with the ECM,
M(t,u) = 0 since with a single cancer cell sub-population we have no muta-tions, andψ(t,u) = µ2(1−ρ(u))+ for the remodelling of ECM. Note that for
µ2 >0 the ECM remodelling process takes place, independent of the present cell or matrix density, as long as the locally available space is not entirely occupied, i.e., as long as 1−ρ(u)>0. We remark that this is different from Gerisch and Chaplain (2008) where the remodelling term was µ2(1−ρ(u)); this however did not guarantee a non-negative ECM density.
The basic parameter set B1 that we use in this section is based on the one given in Gerisch and Chaplain (2008) and is given by:
D1,1 = 10−4 µ1,1 = 0.1 γ = 10 µ2 = 0 D3 = 10−3
α1 = 0.1 λ= 0.5 R= 0.1 Scc = 0.5 Scv = 0.1.
The values given inB1apply whenever no other values for a certain parameter are specified. Note that Gerisch and Chaplain (2008) used a larger cancer cell random motility constant (D1 = 10−3) in their simulations. However, given the difference in size between cancer cells and MDE molecules, it is not unreasonable to assume that the cancer cell population has a lower diffusion coefficient than the MDEs. Also, as indicated in (13), the parameters µ1,1,
Scc, and Scv can be time-dependent, and in that case their default constant
values, as given in B1, do not apply.
Gerisch and Chaplain (2008) explored the following simulation scenario. At time t= 30, two key parameters of the model, the cell-cell adhesion coef-ficient and the cancer cell proliferation rate, are changed such that invasion starts taking place, namely
Scc(t) = Scc(H)(t; 0.5,0.02,30) and µ1,1(t) =µ (H)
1,1 (t; 0,0.1,30). This means that the cell-cell adhesion coefficient is decreased from its default valueScc = 0.5 to 0.02, and the cancer cell proliferation rate is increased from
µ1,1 = 0 to its default value 0.1. The corresponding simulation results are shown in Figure 4. It can be seen that for the initially high cell-cell adhesion coefficient and the low cell-matrix adhesion coefficient (compared to the val-ues used later), the cancer cells aggregate from the initial central cancer cell
Figure 4: Simulation results of model (13) with cell-cell adhesion coef-ficient Scc(t) = Scc(H)(t; 0.5,0.02,30) and proliferation rate µ1,1(t) =
[image:16.612.109.501.441.621.2]mass into a thin structure. After time t = 30, when the proliferation and cell-cell adhesion parameters are changed, we observe a structured invasion of the full spatial domain by the cancer cells.
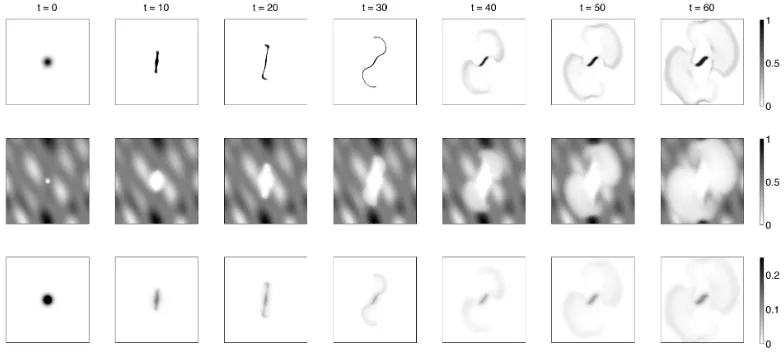
Remark 3 (presentation of simulation results). The simulation results in this Section 3, shown in Figures 4 to 9 and each obtained from a simu-lation of model (13) using parameters according to B1 with modifications as
detailed in each figure caption, present the cancer cell density c in the top row and the ECM density v in the second row at initial time t = 0 and at times t= 10,20,30,40,50, and60 (from left to right). Figure 4 also presents the MDE concentration m in the third row. It can be seen that the MDE concentration profile closely resembles the cancer cell density profile at all stages. The main difference is that it is slightly more diffused, which is to be expected given the structure of the MDE equation in (13). This also holds true for the simulation results shown in the other figures where we, for this reason, do not present the MDE concentration m.
3.1. Time-Dependent Cell-Cell Adhesion Coefficient
Knowing that, as time evolves, cancer cells tend to alter their adhesive properties, we consider here first the cell-cell adhesion coefficient to be time-dependent, i.e., using Eq. (12), we set Scc(t) =S
(T)
cc (t;Scc,−, Scc,+, tcc). As in
the simulation shown in Figure 4, we use the following set of parameters defin-ing the cell-cell adhesion coefficient, namely (Scc,−, Scc,+, tcc) = (0.5,0.02,30).
However, in comparison to that simulation, we now have a smooth transition between the two parameters Scc,− and Scc,+ instead of a step function. Fur-thermore, here the cancer cell proliferation rate is not time-dependent but at
µ1 = 0.1, cf. basic parameter set B1, right from the beginning. The results of this simulations are shown in Figure 5 and they look similar to those in Figure 4.
3.2. Time-Dependent Cell-Matrix Adhesion Coefficient
In a similar manner to the cell-cell adhesion coefficientScc, the cell-matrix
adhesion coefficient Scv can be chosen time-dependent, and we set Scv(t) =
Scv(T)(t;Scv,−, Scv,+, tcv) using the smooth transition function (12). Since it has
Figure 5: Simulation results of model (13) with cell-cell adhesion coefficient
Scc(t) =Scc(T)(t; 0.5,0.02,30). See Remark 3 for further details.
and µ1,1, are taken to be constants, according to the basic parameter set
B1. The corresponding simulation results are shown in Figure 6 and reveal that, although the cell-cell adhesion is rather high, an increase in cell-matrix adhesion drives the cancer cell population towards higher density patches of extracellular matrix. Since the ECM is chosen to be heterogeneous, the adhesive strength is stronger where there is more ECM present. Due to high self-adhesion, the cancer cells tend to remain together, resulting in a more heterogeneous mixing of cells and ECM reminiscent of an INFb-type infiltrative pattern. The increased cell-matrix adhesion also results in a more extensive invasion of the ECM i.e. a greater depth penetrated at the final time of t = 60.
Figure 6: Simulation results of model (13) with cell-matrix adhesion coeffi-cient Scv(t) =S
(T)
[image:18.612.111.501.488.607.2]The effect of ECM remodelling. In Gerisch and Chaplain (2008) as well as in all our simulations so far, the ECM remodelling was kept at zero, i.e. µ2 = 0, in order to retain the initial heterogeneity of the ECM throughout the simu-lations. In what follows now, we set the ECM remodelling rate to µ2 = 0.05 to study the effect of ECM remodelling on the invasive behaviour. We use the basic parameter set B1 with the constant cell-cell adhesion coefficient
Scc = 0.5. The cell-matrix adhesion coefficient function is chosen
accord-ing to (12) with the parameters (Scv,−, Scv,+, tcv) = (0.1,0.3,10). Note that
tcv= 10 conveys an earlier transition time than the one chosen before. In the
[image:19.612.111.499.366.485.2]simulation results shown in Figure 7, we observe a well-defined pattern that the cancer cell population follows in its evolution. Because of the remodelling of the ECM inside the outer boundary of the evolving cancer cells, i.e. within the developing tumour mass, the cancer cells invade not only outward into surrounding tissue but also tend to move back inwards. Furthermore, due to the disappearance of the heterogeneous, structured ECM due to remodelling, the invasive cell front is much more uniform.
Figure 7: Simulation results of model (13) with cell-matrix adhesion coeffi-cient Scv(t) = S
(T)
cv (t; 0.1,0.3,30) and ECM remodelling rate µ2 = 0.05. See Remark 3 for further details.
3.3. Time-dependent Cell-Cell and Cell-Matrix Adhesion Coefficients
Scc(t) and Scv(t) are functions of time and are obtained from (12) with
para-meters (Scc,−, Scc,+, tcc) = (0.5,0.1,30) and (Scv,−, Scv,+, tcv) = (0.1,0.3,30),
respectively. The results of this simulation can be seen in Figure 8. We can immediately observe similarities between the patterns shown here and the ones in Figure 5, where only Scc is time-dependent, and Figure 6, where
only Scv is time-dependent. The differences between the results shown in
Figure 8 and those in Figure 5 are caused by the additional time-dependent increase of the cell-matrix adhesion coefficient and higher value ofScc,
[image:20.612.110.501.309.448.2]result-ing in a faster spread of the cancer cells into the ECM. At the same time, in comparison to Figure 6, the results in Figure 8 have a more diffuse invading front of cancer cells, due to the additional time-dependent decreasing cell-cell adhesion coefficient.
Figure 8: Simulation results of model (13) with cell and cell-matrix adhesion coefficients as Scc(t) = S
(T)
cc (t; 0.5,0.1,30) and Scv(t) =
Scv(T)(t; 0.1,0.3,30), respectively. See Remark 3 for further details.
The effect of ECM remodelling. We now explore the cancer cell dynamics by incorporating the remodelling of the ECM in the context of time-dependent cell-cell and cell-matrix adhesive properties and set the corresponding para-meter µ2 = 0.05. We consider two different settings of the time-dependent cell-matrix adhesion parameter with, in both cases, the same time-dependent cell-cell adhesion parameter (always using the transition function (12)). Fig-ure 9 shows the corresponding simulation results in two subplots
Figure 9a: Scv(t) = Scv(T)(t; 0.1,0.3,10), Scc(t) =Scc(T)(t; 0.5,0.25,40),
(a)Scv(t) =S
(T)
cv (t; 0.1,0.3,10) andScc(t) =S
(T)
cc (t; 0.5,0.25,40)
[image:21.612.110.501.123.384.2](b)Scv(t) =Scv(T)(t; 0.25,0.5,10) andScc(t) =Scc(T)(t; 0.5,0.25,40)
Figure 9: Simulation results of model (13) with cell-cell and cell-matrix adhesion coefficients as given in each subplot and ECM remodelling rate
µ2 = 0.05. See Remark 3 for further details.
We observe that, while the main features of the invasive pattern present in Figure 7 are preserved in the current simulations, the additional time-dependent decrease of Scc(t) causes a more diffuse and heterogeneous
invas-ive pattern in Figure 9a. Furthermore, as can be observed in Figure 9b, increasing Scv(t) further compared to the simulation shown in Figure 9a,
leads to an even more pronounced heterogeneous pattern with cancer cells and ECM inter-mixed throughout the domain. This is reminiscent of the tu-mour infiltrative growth pattern, INFc, seen in Figure 1 and the DCIS seen in Figure 2b.
4. The Non-Local Model with Two Cancer Cell Sub-Populations
we explore this situation by modelling the overall tumour dynamics where there are two cancer cell sub-populations,c1 and c2. During the development of the cancer, we assume that the second sub-population emerging in the tumour mass arises from mutations in the cells of the first sub-population. In a different investigation, focused on the uPA system, Andasari et al. (2011) considered the dynamics of two cancer cell sub-populations in a reaction-diffusion-taxis model of invasion.
Using the general model formulation (1), (3), and (4), we consider the following (nondimensionalized) model for the two sub-populations c1 and c2:
∂c1
∂t =∇ ·[D1,1∇c1−c1A1(t, x, u(t,·))] +µ1,1c1(1−ρ(u)) +M1,1(t,u)c1, ∂c2
∂t =∇ ·[D1,2∇c2−c2A2(t, x, u(t,·))] +µ1,2c2(1−ρ(u)) +M2,1(t,u)c1, ∂v
∂t =−γmv+µ2(1−ρ(u))
+,
∂m
∂t =∇ ·[D3∇m] +α1c1+α2c2−λm .
(14) In the above, as in the case of a single cancer cell population, we have chosen a logistic-type growth law for each cancer cell sub-population; note however that the proliferation ratesµ1,1 andµ1,2 are constants here. The mutation of cancer cells from type c1 to type c2 is modelled as in Andasari et al. (2011), that is, the non-zero elements of the matrix M(t,u(t, x)) are given by
−M1,1(t,u) =M2,1(t,u) = δH(t−t1,2)·H(v(t, x)−vmin).
Here, H(·) denotes the Heaviside function, t1,2 is the time point after which mutations from sub-population 1 to sub-population 2 begin to occur, vmin is the minimum ECM density that is needed for mutations to take place, and δ > 0 is the mutation rate. The non-local terms A1 and A2 are as defined in (2a) with the function g, cf. (2d), fully specified when the 2×2 matrices Scc(t) and Scv(t) are given. We note already here that only the
componentsSc2,c2 andSc2,vare considered time-dependent in our simulations
below; all other components of these matrices are constants. The ECM remodelling process is represented as in the case of a single cell population, that is ψ(t,u) = µ2(1−ρ(u))+.
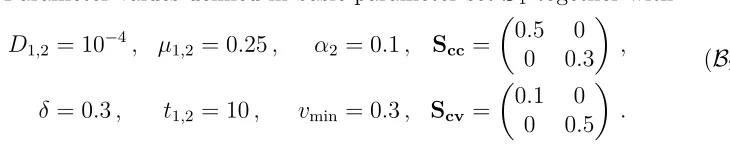
of the basic parameter set B1 used in Section 3 and is given by: Parameter values defined in basic parameter set B1 together with
D1,2 = 10−4, µ1,2 = 0.25, α2 = 0.1, Scc =
0.5 0 0 0.3
,
δ= 0.3, t1,2 = 10, vmin = 0.3, Scv =
0.1 0 0 0.5
.
(B2)
The values given inB2apply whenever no other values for a certain parameter are specified.
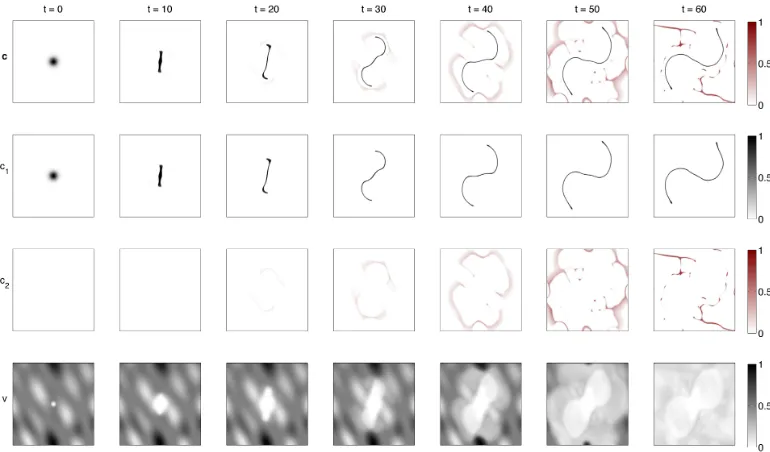
The results of the simulation using the basic parameter setB2 are shown in Figure 10. Sub-population c1 is shown in black, while sub-population c2 is shown in red. In the first row of the figure, both sub-population densities are superimposed, i.e. plotted on top of each other, meaning that one can only see the density of the dominant species at each point. The second and third row show the individual cancer cell sub-populations densities c1 and
[image:23.612.126.491.163.236.2]c2, respectively, and the fourth row shows the ECM density. We see that after time t=t1,2 = 10, the second sub-populationc2 emerges in the tumour mass. Due to the lower self-adhesion and the higher cell-matrix adhesion coefficients, as compared to those of cell typec1, the mutated cancer cell sub-population spreads much faster into the surrounding tissue than the primary sub-population. The patterns of both sub-populations att = 50,60 (top row) bear a striking resemblance to the phyllodes tumour (fibroadenoma) seen in Figure 2a.
Remark 4 (presentation of simulation results). The simulation results in this Section 4, shown in Figures 10 to 17 and each obtained from a simu-lation of model (14) using parameters according to B2 with modifications as
detailed in each figure caption, present the superimposed cancer cell densities
c1 and c2 in the top row and the ECM density v in the bottom row at initial
time t = 0 and at times t = 10,20,30,40,50, and 60 (from left to right). In the superimposed cell densities the black and red colour scale refer to c1 and
c2, respectively. Since c1, c2, and v are represented in the same range [0,1],
the black colour bar refers to c1 and v and the red colour bar to c2. Only
Fig-ure 10 shows in the additional two central rows the individual cell densities
c1 and c2 as well. For the same reason as in Section 3, see Remark 3, the
Figure 10: Simulation results of model (14) with parameter set B2. See Remark 4 for further details.
The effect of ECM remodelling and the influence of the cross-adhesion coef-ficient. We now consider again the effect that ECM remodelling has on the cancer cell dynamics. Figure 11 shows the results obtained using the basic parameter set B2, but where instead of using the default value zero for the ECM remodelling rate, we set this rate toµ2 = 0.05. Despite the fact that we have time-independent adhesive properties in this simulation, the two can-cer cell sub-populations alongside the continuously remodelling ECM form together a strongly heterogeneous pattern. Once again this is reminiscent of the tumour infiltrative growth pattern INFc. Since, as in the simulations shown in Figure 10, the cell-cell cross-adhesion parameter Sc1,c2 = 0, the two
sub-populations do not mix.
We continue our investigation by now increasing the cross-adhesion coef-ficient Sc1,c2 from its default value zero and observe that the two cancer cell
Figure 11: Simulation results of model (14) with ECM remodelling rate
µ2 = 0.05. See Remark 4 for further details.
If we consider a higher cell-matrix adhesion value for the first cancer cell sub-population, we observe a faster spread of both cancer cell sub-populations and an increased number of cancer/ECM nests inside the tumour. Figure 13 shows the result for the same set of parameters as for Figure 12a except that the cell-matrix adhesion coefficient of the first sub-population is increased to
Sc1,v = 0.3. If we further increase the cross-adhesion parameter, as was done
in Figures 11 and 12, the results follow the same principle from separation towards mixing of cancer cell sub-populations (not shown). Once again the invasive pattern developed at later times shows a striking similarity to the DCIS in Figure 2b.
Time-dependent adhesive properties for sub-population c2. Following the in-vestigations in Section 3, we now alter the cell-cell and cell-matrix adhes-ive properties in our model in a time-dependent manner, using the func-tion defined in (12), and examine their influence on the cancer cell popula-tion dynamics. Secpopula-tion 4.1 considers the case where the cell-matrix adhe-sion coefficient of the second cancer cell subpopulation is time-dependent,
Sc2,v(t) = S
(T)
c2,v(t;Sc2,v,−, Sc2,v,+, tc2,v), and Section 4.2 the case where in
ad-dition the self-adhesion coefficient of that subpopulation is time-dependent,
Sc2,c2(t) = S
(T)
c2,c2(t;Sc2,c2,−, Sc2,c2,+, tc2,c2). All other adhesion coefficients, in
(a)Sc1,c2 = 0.075
(b)Sc1,c2 = 0.15
[image:26.612.113.500.161.583.2](c)Sc1,c2 = 0.3
Figure 12: Simulation results of model (14) with ECM remodelling rate
µ2 = 0.05 and positive cross-adhesion coefficient Sc1,c2 as indicated in the
Figure 13: Simulation results of model (14) with ECM remodelling rate
µ2 = 0.05, cross-adhesion coefficient Sc1,c2 = 0.075, and cell-matrix adhesion
coefficient Sc1,v = 0.3. See Remark 4 for further details.
4.1. Time-dependent Cell-Matrix Adhesion Coefficient
In Section 3.2, while maintaining a constant cell-cell adhesion and assum-ing no ECM remodellassum-ing, the cell-matrix adhesion coefficient was increased with time. We perform here corresponding simulations for the model with two cancer cell sub-populations. The adhesion coefficients are chosen as fol-lows
Scc =
0.5 Sc1,c2
Sc1,c2 0.5
, Scv =
0.1 0 0 Sc2,v(t)
,
Sc2,v(t) =Sc2(T,v)(t; 0.1,0.3,30).
(15)
Figure 14a shows the results for the case without cross-adhesion, Sc1,c2 = 0,
and Figure 14b for the case with non-zero cross-adhesion, Sc1,c2 = 0.5. We
observe that in the absence of cross-adhesion, the with time increasing cell-matrix adhesion enables the second cancer sub-populationc2to dominate and invade extensively. The ECM is largely degraded throughout the domain. However, in the case of non-zero cross-adhesion, while the extent of the invasive boundary of the cancer cells is similar, the structure of the cancer cell pattern is quite different. In this case, there is a more filamentous and connected structure with the ECM less degraded overall. This is similar to the results in Figure 6 where the parameter values are comparable i.e. the same cell-cell adhesion value of 0.5 and the same time-dependent increasing cell-matrix adhesion function Scv(t) = S
(T)
cv (t; 0.1,0.3,30).
ex-(a)Sc1,c2 = 0
[image:28.612.114.501.123.398.2](b)Sc1,c2 = 0.5
Figure 14: Simulation results of model (14) with adhesion coefficients ac-cording to (15) andSc1,c2 as indicated in the two subplots. See Remark 4 for
further details.
tracellular matrix. Again, as in Section 3.2, we now set the ECM remodelling rate to µ2 = 0.05 to see how this influences the dynamics of cancer invasion. The adhesion coefficients are again chosen as in (15). Figure 15a shows the results for the case without cross-adhesion, Sc1,c2 = 0, and Figure 15b for
the case with non-zero cross-adhesion, Sc1,c2 = 0.5. In contrast to the results
(a)Sc1,c2 = 0
[image:29.612.114.499.122.400.2](b)Sc1,c2 = 0.5
Figure 15: Simulation results of model (14) as in Figure 14 but with ECM remodelling rate µ2 = 0.05. See Remark 4 for further details.
proliferation according to spatial constraints in our modelling framework.
4.2. Time-dependent Cell-Cell and Cell-Matrix Adhesion Coefficients
In Section 3.3, the cell adhesion coefficient was decreased and the cell-matrix adhesion coefficient was increased with time while assuming no ECM remodelling. We perform here similar simulations for the model with two cancer cell sub-populations. The adhesion coefficients are chosen as follows
Scc=
0.5 0 0 Sc2,c2(t)
, Scv =
0.1 0 0 Sc2,v(t)
, (16a)
Sc2,c2(t) = Sc2,c2(T) (t; 0.5,0.1,30), Sc2,v(t) = Sc2,v(T)(t; 0.1,0.3,30). (16b)
Figure 16: Simulation results of model (14) with adhesion coefficients ac-cording to (16). See Remark 4 for further details.
aggregation leading to the formation of infiltrative patterns in the second cell sub-population, with a significant increase in spreading of the patterns belonging to the second cell sub-population relative to the first one. Compar-able to Figure 8, the overall cancer population develops a similar invading pattern, with a more migratory character observed for the infiltrative fea-tures of sub-population c2. The patterns at t = 50,60 (top row) once again resemble the phyllodes tumour (fibroadenoma) seen in Figure 2a.
The effect of ECM remodelling. In order to investigate the influence of ECM remodelling on the dynamics of cancer invasion, we increase the correspond-ing parameter to µ2 = 0.05. While maintaining the structure of the adhesion coefficients given in (16a), we now use the following for Sc2,c2(t) andSc2,v(t),
namely:
Sc2,c2(t) =Sc2(T,c2) (t; 0.5,0.25,40) andSc2,v(t) =Sc2,v(T)(t; 0.1,0.3,20) (17a)
for the plots in Figure 17a, and
Sc2,c2(t) =Sc2(T,c2) (t; 0.5,0.25,40) andSc2,v(t) =Sc2,v(T)(t; 0.25,0.5,20) (17b)
for the plots in Figure 17b.
(a)
[image:31.612.114.500.124.403.2](b)
Figure 17: Simulation results of model (14) as in Figure 16 but with ECM remodelling rate µ2 = 0.05 and Sc2,c2(t) and Sc2,v(t) according to (17a) in
subplot (a) and to (17b) in subplot (b). See Remark 4 for further details.
5. Discussion and Conclusions
In this paper we have presented a model of cancer invasion which exam-ines in some detail the effect of both cell-cell and cell-matrix adhesion on the growth and development of a cancerous tissue. By considering both one and two sub-populations of cancer cells, this investigation further develops pre-vious modelling work which considered only a single cancer cell population with constant adhesion properties (Gerisch and Chaplain, 2008). In line with observed tumour infiltrative patterns (Ito et al., 2012; Masuda et al., 2012), and also other tumours such as ductal carcinoma in situ and fibroadenoma, the computational simulation results of the model showed a range of het-erogeneous invasion patterns as a consequence of several possible changing cell-cell and cell-matrix adhesion scenarios.
induce significant qualitative differences in the evolution of malignant tu-mours. Our simulations reveal the impact that the changes in these coeffi-cients, considered in different scenarios, have on the heterogeneous pattern of cancer progression and invasion. In agreement with experimental evidence, our simulations show that an increase in the cell-matrix adhesion parameter
Scv results in an increased motility of the cancer cells.
We have found that differences in the initial conditions also influence the spatio-temporal evolution of the invading cancer. For instance, using the same model and parameters as in Section 3.2 but with the following different initial condition for the ECM density
v(0, x) = max{0,1−c(0, x)−h(x)},
h(x) = 0.1 sin(2π(x1+x2))2cos(3πx2)2−0.1 cos(π(x2+ 2x1))2)
−0.3 cos(x1 −x2)2,
(18)
simulation results as shown in Figure 18a are obtained. These are clearly different from the corresponding results shown in Figure 6.
A time-dependent cell-matrix adhesion parameter Scv(t) may lead to the
evolution of a different invasion pattern than those obtained for the case when
Scv is kept constant. For example, if we replace the time-dependent
cell-matrix coefficient by the constantScv = 0.3, i.e. using the upper value of the
time-dependent case, we obtain the results shown in Figure 18b. This change leads to a different and, expectedly, more invasive behaviour compared to the one shown in Figure 18a. Finally in Figure 18c we see the invasive pattern obtained when the cancer cell diffusion coefficient is increased by a factor of 10 to a value of 10−3. As expected, compared with Figure 18a, the cancer cell density has invaded the ECM to a greater extent, and the structure of the cancer cell density throughout is different. This shows that cancer cell random motility, as well as adhesion, is also an important factor in invasion. In both the one and two cancer cell sub-population cases, changes in the time-dependent cell-cell and cell-matrix adhesion parameters influence the invasion patterns observed in our simulations. Infiltrative patterns of cancer cells are more distinct for higher cell-matrix and cell-cell adhesion parameter values. At the same time, a weak cell-cell adhesion leads to a diffusive spread of the corresponding cancer cell sub-populations.
(a) Simulation results as in Fig. 6 but with initial ECM density (18).
(b) Simulation results as in Fig. 6 but with initial ECM density (18) andScv= 0.3
[image:33.612.113.502.164.563.2](c) Simulation results as in Fig. 6 but with initial ECM density (18) and cancer cell diffusion coefficient D1,1 = 10−3.
infiltrative complexity and spread of these invasion patterns depends strongly on the changes in the adhesion properties of the cancer cells.
The evolution of a range of tumour infiltrative patterns as a result of variations of adhesive parameters can be investigated by considering time-dependent perturbations of some given adhesive properties. To this end, we consider a scenario where the cell-cell and cell-matrix adhesion parameters of the first cancer cell sub-population are kept constant, whereas for the second sub-population the self-adhesion and cell-matrix adhesion properties are perturbed by a time-dependent function σ(t). Thus, following (2d), these perturbed adhesion parameters can be formalised as follows:
Scc =
0.5 Sc1,c2
Sc1,c2 Sc2,c2(t)−ε·σ(t)
, Scv =
0.3 0
0 Sc2,v(t) +ε·σ(t)
, (19)
where the time-dependent cell-cell and cell-matrix adhesion coefficientsSc2,c2(t)
and Sc2,v(t) are given, using (12), by
Sc2,c2(t) =Sc2(T,c2) (t; 0.5,0.3,40) and Sc2,v(t) =Sc2(T,v)(t; 0.3,0.5,20). (20)
The cross-adhesion coefficient is constant and chosen to be either Sc1,c2 = 0
or Sc1,c2 = 0.15. The perturbation function is given by
σ(t) = 0.3t
T
with T = 60 being the final simulation time, see Section 2.3. In this ex-ploratory experiment, the perturbation parameter ε is chosen from the set
{1,1/2,1/4,1/8,1/16}.
Figure 19 shows the simulation results at the final timeT = 60 for differ-ent choices of Sc1,c2 and ε. For both choices of Sc1,c2, we observe a consistent
transition from a strong pattern formation for small ε to a rather diffusive spread of the mutated cancer cell population for large values of ε.
(a)Sc1,c2 = 0
[image:35.612.114.501.121.579.2](b)Sc1,c2 = 0.15
Figure 19: Plots showing the cancer cell densities (black: c1, red: c2) and ECM (blue) att= 60 obtained from simulations of model (14) using the para-meters as defined in (19) and (20) for different constant cross-adhesion values
Sc1,c2 and perturbation parameter ε as indicated. All other parameters are
grade of a cancer can be related to changes in the adhesion parameters in our model. Mathematical investigations regarding pattern stability and perturb-ation analysis alongside the calibrperturb-ation of this modelling will provide further insights into the evolution of these invasion patterns, thus advancing the overall histo-pathological assessment of cancer invasion in a more objective manner.
Appendix A. Parameter Tables
p unit p˜ conditions
ϑc cm3/cell ϑcc∗ ϑc >0
ϑv cm3/mg ϑvv∗ ϑv >0
D1,i cm2/s D1,i
τ
L2 D1,i>0
R cm R1
L R >0
γ 1/(nM s) γτ m∗ γ ≥0
D3 cm2/s D3
τ
L2 D3 >0
α (nM/s)/(cells/cm3) ατ c∗
m∗
α≥0
[image:36.612.112.455.268.488.2]λ 1/s λτ λ≥0
p unit ˜ p references/notes ρ ( u ) — ρ v olume fraction of o ccupied space A ( t, x, u ( t, · )) cm/s
τ A L
matrix of adhesion-mediated directed can cer cell sub-p opulation v elo cities P ( t, u ) 1/s τ P diagonal matrix of cancer cell proliferation co efficien ts M ( t, u ) 1/s τ M matrix of cancer cell m utation co effi cien ts, diag ( M ) ≤ 0, M − diag ( M ) ≥ 0, 1 T M = 0 . Ωi ( r ) 1/cm p L p Ω i radial dep endency functi on, normalised, Ωi ≥ 0 g ( t, u ( t, x )) cm 2 /s
τ g 2 L
adhesion co efficien t function Scc ( t ) cm 2 /(s(cells/cm 3 )) τ
c∗ S 2L
cc matrix of cell-c ell adhesion co efficien ts, Scc ≥ 0 Scv ( t ) cm 2 /(s(mg/cm 3 )) τ
v∗ S 2L
cv diagonal matrix of cell-mat rix adhesion co efficien ts, Scv ≥ 0 ψ ( t, u ) mg/(cm 3 s)
τ ψ v∗
ECM remo delling la w, ψ ≥ 0 if v = 0 T able A.2: In termediate mo de l quan tities p of the mo del (1)–(6) with their unit and their non-dimensionalised coun terparts ˜ p . The latter ha v e to b e read, for instance, as follo ws
˜A(˜i
t, ˜ x, ˜ u (˜ t, · )) =
τ A L
[image:37.612.151.448.128.692.2]Appendix B. Non-dimensionalisation of the non-local term
Lett∈ I,x∈ D, andR >0 and consider the non-local termAi(t, x,u(t,·)),
see (2a), which we repeat here for convenience:
Ai(t, x,u(t,·)) =
1
R
Z
B(0,R)
n(y)·Ωi(kyk2)·gi(t,u(t, x+y)) dy .
Before we non-dimensionalise that term, let us first take a look at the units of the inidvidual terms. Recall that Ωi is normalised, cf. (2c), that is
1 = Z
B(0,R)
Ωi(kyk2) dy .
Consequently, the unit of Ωi is [1/cmp] . Since Ai is a velocity, [cm/s], and
n(y) is dimensionless, it follows that the unit ofgi must be [cm2/s]. This can
be understood by recalling, cf. Armstrong et al. (2006), that the expression for Ai is derived according to Stokes law and thus gi corresponds to the
product of 1/(6πµ), with the dynamic viscosity µ in [N s/cm2], and a force in [N]. Now, consider the specific form (2d) of the function g, i.e.
g(t,u)≡g(t,c, v) = [Scc(t)c+Scv(t)1v]·(1−ρ(u))
+
.
The factor (1−ρ(u))+ is dimensionless. Thus the elements of matrix Scc(t)
have unit [cm2/(s(cells/cm3))] and those ofScv(t) have unit [cm2/(s(mg/cm3))].2
Below we make use of the following dimensionless quantities, see also (7), ˜
t := t
τ , x˜:= x
L, y˜:= y L,
˜
R:= R
L , r˜≡ ky˜k2 := r L =
kyk2
L ,
˜
ϑc :=ϑcc∗, ϑ˜v :=ϑvv∗, S˜cc(˜t) :=
τ c∗
L2 Scc(τ˜t), ˜Scv(˜t) :=
τ v∗
L2 Scv(τt˜), ˜
u(˜t,x˜) :=
c(˜tτ,xL˜ )
c∗
,v(˜tτ,xL˜ ) v∗
.
First observe that, for y ∈ B(0, R) we have ˜y ∈ B(0,R˜). Now, for a given function f : B(0, R) → R holds, under some mild assumptions on f, the following formula (change of variables in the integral)
Z
B(0,R)
f(y) dy=Lp
Z
B(0,R˜)
f(Ly˜) d˜y .
2These units appear odd on first sight but splitting off the 1/(6πµ)-factor fromgi, we
1. For y∈B(0, R) we have n(y) = n(˜y).
2. We define the dimensionless function ˜Ωi(˜r) by
˜
Ωi(˜r) :=LpΩi(kLy˜k2) =LpΩi(kyk2) = LpΩi(r).
Then ˜Ωi is also non-negative and it is normalised over B(0,R˜) as Ωi is
normalised over B(0, R) because
1 = Z
B(0,R)
Ωi(kyk2) dy=L
p
Z
B(0,R˜)
Ωi(kLy˜k2) d˜y= Z
B(0,R˜) ˜
Ωi(ky˜k2) d˜y . 3. We obtain
ρ(u(t, x)) = ˜ϑvv˜(˜t,x˜) + ˜ϑc n
X
i=1 ˜
c(˜t,x˜) =: ˜ρ(˜u(˜t,x˜)).
4. We define the dimensionless function ˜g(˜t,u˜(˜t,x˜)) by
˜
g(˜t,u˜(˜t,x˜)) :=h˜Scc(˜t)˜c(˜t,x˜) +S˜cv(˜t)1˜v(˜t,x˜)
i
· 1−ρ˜(˜u(˜t,x˜))+ = τ
L2g(τ˜t,u(τ˜t, Lx˜)).
Now, putting everything together we arrive at the dimensionless form of the velocity ˜Ai(˜t,x,˜ u˜(˜t,·))
τ
LAi(t, x,u(t,·)) = τ LR
Z
B(0,R)
n(y)·Ωi(kyk2)·gi(t,u(t, x+y)) dy
= L
pτ
LR
Z
B(0,R˜)
n(Ly˜)·Ωi(kLy˜k2)·gi(t,u(t, x+Ly˜)) d˜y
= 1 ˜
R
Z
B(0,R˜)
n(˜y)·Ω˜i(ky˜k2)·
τ
L2gi(τ˜t,u(τt, L˜ x˜+Ly˜)) d˜y = 1
˜
R
Z
B(0,R˜)
n(˜y)·Ω˜i(ky˜k2)·g˜i(˜t,u˜(˜t,x˜+ ˜y)) d˜y
=: ˜Ai(˜t,x,˜ u˜(˜t,·)).
Acknowledgement
and AG would like to acknowledge Northern Research Partnership PECRE scheme. DT and MAJC gratefully acknowledge the support of the ERC Advanced Investigator Grant 227619, “M5CGS - From Mutations to Meta-stases: Multiscale Mathematical Modelling of Cancer Growth and Spread”. The authors would like to thank an anonymous referee for helpful com-ments and bringing the website “Breast Pathology on the Web” (http: //www.breastpathology.info) to our attention. The authors would also like to thank Dr Jeremy Thomas (Consultant Pathologist, Western General Hospital, Edinburgh) for providing the original images for Figure 2 and for helpful suggestions concerning the description of the Phyllodes tumour and DCIS.
References
Abreu, E.L., Palmer, M.P., Murray, M.M., 2010. Collagen density signific-antly affects the functional properties of an engineered provisional scaffold. J Biomed Mater Res Part A 93A, 150–157. doi:10.1002/jbm.a.32508. Andasari, V., Chaplain, M., 2012. Intracellular modelling of cell-matrix
ad-hesion during cancer cell invasion. Math Model Nat Phenom 7, 29–48. doi:10.1051/mmnp/20127103.
Andasari, V., Gerisch, A., Lolas, G., South, A., Chaplain, M., 2011. Math-ematical modeling of cancer cell invasion of tissue: biological insight from mathematical analysis and computational simulation. J Math Biol 63, 141–171. doi:10.1007/s00285-010-0369-1.
Anderson, A.R., Hassanein, M., Branch, K.M., Lu, J., Lobdell, N.A., Maier, J., Basanta, D., Weidow, B., Narasanna, A., Arteaga, C.L., Reynolds, A.B., Quaranta, V., Estrada, L., Weaver, A.M., 2009. Microenvironmental independence associated with tumor progression. Cancer Res 69, 8797– 8806. doi:10.1158/0008-5472.CAN-09-0437.
Anderson, A.R.A., 2005. A hybrid mathematical model of solid tumour invasion: the importance of cell adhesion. IMA Math Med Biol 22, 163– 186. doi:10.1093/imammb/dqi005.
Andreasen, P.A., Egelund, R., Petersen, H.H., 2000. The plasminogen activ-ation system in tumor growth, invasion, and metastasis. Cell Mol Life Sci 57, 25–40. doi:10.1007/s000180050497.
Andreasen, P.A., Kjøller, L., Christensen, L., Duffy, M.J., 1997. The urokinase-type plasminogen activator system in cancer metastasis: a re-view. Int J Cancer 72, 1–22. doi:10.1002/(SICI)1097-0215(19970703) 72:1<1::AID-IJC1>3.0.CO;2-Z.
Armstrong, N.J., Painter, K.J., Sherratt, J.A., 2006. A continuum approach to modelling cell–cell adhesion. J Theor Biol 243, 98 – 113. doi:10.1016/ j.jtbi.2006.05.030.
Behrens, J., Mareel, M.M., Roy, F.M.V., Birchmeier, W., 1989. Dissecting tumor cell invasion: Epithelial cells acquire invasive properties after the loss of uvomorulin-mediated cell-cell adhesion. J Cell Biol 108, 2435–2447. doi:10.1083/jcb.108.6.2435.
Berrier, A.L., Yamada, K.M., 2007. Cell-matrix adhesion. J Cell Physiol 213, 565–573. doi:10.1002/jcp.21237.
Bhagavathula, N., Hanosh, A.W., Nerusu, K.C., Appelman, H., Chakrabarty, S., Varani, J., 2007. Regulation of e-cadherin and β-catenin by Ca2+ in colon carcinoma is dependent on calcium-sensing receptor expression and function. Int J Cancer 121, 1455–1462. doi:10.1002/ijc.22858.
Byers, S.W., Sommers, C.L., Hoxter, B., Mercurio, A.M., Tozeren, A., 1995. Role of e-cadherin in the response of tumor cell aggregates to lymphatic, venous and arterial flow: Measurement of cell-cell adhesion strength. J Cell Sci 108, 2053–2064.
Byrne, H., Chaplain, M., 1996. Modelling the role of cell-cell adhesion in the growth and development of carcinomas. Math Comput Model 24, 1–17. doi:10.1016/S0895-7177(96)00174-4.
Byrne, H.M., Chaplain, M.A.J., Pettet, G.J., McElwain, D.L.S., 2001. An analysis of a mathematical model of trophoblast invasion. Appl Math Lett 14, 1005–1010. doi:10.1016/S0893-9659(01)00079-9.
Byrne, H.M., Preziosi, L., 2004. Modelling solid tumour growth using the theory of mixtures. Math Med Biol 20, 341–366. doi:10.1093/imammb/ 20.4.341.
Chaplain, M.A.J., Lachowicz, M., Szyma´nska, Z., Wrzosek, D., 2011. Math-ematical modelling of cancer invasion: The importance of cell-cell ad-hesion and cell-matrix adad-hesion. Math Mod Meth Appl S 21, 719–743. doi:10.1142/S0218202511005192.
Chaplain, M.A.J., Lolas, G., 2005. Mathematical modelling of cancer cell invasion of tissue: The role of the urokinase plasminogen activation system. Math Mod Meth Appl S 15, 1685–1734. doi:10.1142/S0218202505000947. Chaplain, M.A.J., Lolas, G., 2006. Mathematical modelling of cancer inva-sion of tissue: Dynamic heterogeneity. Netw Heterog Media 1, 399–439. doi:10.3934/nhm.2006.1.399.
Chaplain, M.A.J., McDougall, S.R., Anderson, A.R.A., 2006. Mathematical modelling of tumor-induced angiogenesis. Annu Rev Biomed Eng 8, 233– 257. doi:10.1146/annurev.bioeng.8.061505.095807.
Deisboeck, T.S., Wang, Z., Macklin, P., Cristini, V., 2011. Multiscale cancer modeling. Annu Rev Biomed Eng 13, 127–155. doi:10.1146/ annurev-bioeng-071910-124729.
Friedl, P., Noble, P.B., Walton, P.A., Laird, D.W., Chauvin, P.J., Tabah, R.J., Black, M., Zanker, K.S., 1995. Migration of coordinated cell clusters in mesenchymal and epithelial cancer explants in vitro. Cancer Res 55, 4557–4560.
Gatenby, R.A., 1995. Models of tumor-host interaction as competing popu-lations: Implications for tumor biology and treatment. J Theor Biol 176, 447 – 455. doi:10.1006/jtbi.1995.0212.
Gatenby, R.A., Gawlinski, E.T., 1996. A reaction-diffusion model of cancer invasion. Cancer Res 56, 5745–5753.
Gerisch, A., 2001. Numerical methods for the simulation of taxis– diffusion–reaction systems. PhD thesis. Martin-Luther Universit¨at Halle-Wittenberg.
Gerisch, A., 2010. On the approximation and efficient evaluation of integral terms in pde models of cell adhesion. IMA J Numer Anal 30, 173–194. doi:10.1093/imanum/drp027.
Gerisch, A., Chaplain, M., 2008. Mathematical modelling of cancer cell invasion of tissue: Local and non-local models and the effect of adhesion. J Theor Biol 250, 684 – 704. doi:10.1016/j.jtbi.2007.10.026.
Gerisch, A., Chaplain, M.A.J., 2006. Robust numerical methods for taxis– diffusion–reaction systems: Applications to biomedical problems. Math Comput Model 43, 49–75. doi:10.1016/j.mcm.2004.05.016.
Gerisch, A., Painter, K.J., 2010. Mathematical modeling of cell adhesion and its applications to developmental biology and cancer invasion, in: Chauvi`ere, A., Preziosi, L., Verdier, C. (Eds.), Cell Mechanics: From Single Scale-Based Models to Multiscale Modelling. CRC Press, pp. 319– 350.
Hanahan, D., Weinberg, R.A., 2000. The hallmarks of cancer. Cell 100, 57–70. doi:10.1016/S0092-8674(00)81683-9.
Hanahan, D., Weinberg, R.A., 2011. Hallmarks of cancer: The next genera-tion. Cell 144, 646–674. doi:10.1016/j.cell.2011.02.013.
Hills, C.E., Younis, M.Y.G., Bennett, J., Siamantouras, E., Liu, K.K., Squires, P.E., 2012. Calcium-sensing receptor activation increases cell-cell adhesion and -cell-cell function. Cell Physiol Biochem 30, 575–586. doi:10.1159/000341439.
Hofer, A.M., Curci, S., Doble, M.A., Brown, E.M., Soybel, D.I., 2000. In-tercellular communication mediated by the extracellular calcium-sensing receptor. Nat Cell Biol 2, 392–398. doi:10.1038/35017020.
Hung, W.C., Chen, S.H., Paul, C.D., Stroka, K.M., Lo, Y.C., Yang, J.T., Konstantopoulos, K., 2013. Distinct signaling mechanisms regulate mi-gration in unconfined versus confined spaces. J Cell Biol 202, 807–824. doi:10.1083/jcb.201302132.
Ito, E., Ozawa, S., Kijima, H., Kazuno, A., Nishi, T., Chino, O., Shimada, H., Tanaka, M., Inoue, S., Inokuchi, S., Makuuchi, H., 2012. New in-vasive patterns as a prognostic factor for superficial esophageal cancer. J Gastroenterol 47, 1279–1289. doi:10.1007/s00535-012-0587-y.
Japan Esophageal Society, 2009. Japanese classification of esophageal cancer, tenth edition: part I. Esophagus 6, 1–25. doi:10.1007/ s10388-009-0169-0.
Japanese Gastric Cancer Association, 2011. Japanese classification of gastric carcinoma: 3rd English edition. Gastric Cancer 14, 101–112. doi:10.1007/ s10120-011-0041-5.
Juliano, R.L., 2002. Signal transduction by cell adhesion receptors and the cytoskeleton: Functions of integrins, cadherins, selectins, and immunoglobulin-superfamily members. Annu Rev Pharmacol 42, 283–323. doi:10.1146/annurev.pharmtox.42.090401.151133.
Ko, K., Arora, P., Bhide, V., Chen, A., McCulloch, C., 2001. Cell-cell adhesion in human fibroblasts requires calcium signaling. J Cell Sci 114, 1155–1167.
Kr¨uger, S., Noack, F., B¨ohle, A., Feller, A., 2004. Histologic tumor growth pattern is significantly associated with disease-related survival in muscle-invasive transitional cell carcinoma of the urinary bladder. Oncol Rep 12, 609–613. doi:10.3892/or.12.3.609.
Larebeke, A.F.N.V., Bracke, M.E., Mareel, M.M., 1992. Invasive epithelial cells show more fast plasma membrane movements than related or parental non-invasive cells. Cytometry 13, 9–14. doi:10.1002/cyto.990130104. Le, P.U., Nguyen, T.N., Drolet-Savoie, P., Leclerc, N., Nabi, I.R., 1998.
Increased β-actin expression in an invasive moloney sarcoma virus-transformed MDCK cell variant concentrates to the tips of multiple pseudopodia. Cancer Res 58, 1631–1635.
Luebke, T., Baldus, S., Grass, G., Bollschweiler, E., Thiele, J., Dienes, H.P., Hoelscher, A., Moenig, S., 2005. Histological grading in gastric can-cer by ming classification: Correlation with histopathological subtypes, metastasis, and prognosis. World J Surg 29, 1422–1427. doi:10.1007/ s00268-005-7795-z.
Macklin, P., McDougall, S.R., Anderson, A.R.A., Chaplain, M.A.J., Cristini, V., Lowengrub, J., 2009. Multiscale modelling and nonlinear simulation of vascular tumour growth. J Math Biol 58, 765–798. doi:10.1007/ s00285-008-0216-9.
Masuda, R., Kijima, H., Imamura, N., Aruga, N., Nakamura, Y., Masuda, D., Takeichi, H., Kato, N., Nakagawa, T., Tanaka, M., Inokuchi, S., Iwazaki, M., 2012. Tumor budding is a significant indicator of a poor prognosis in lung squamous cell carcinoma patients. Mol Med Rep 6, 937–943. doi:10. 3892/mmr.2012.1048.
Mierke, C.T., Frey, B., Fellner, M., Herrmann, M., Fabry, B., 2010. Integrin
α5β1 facilitates cancer cell invasion through enhanced contractile forces. J Cell Sci 124, 369–383. doi:10.1242/jcs.071985.
Moissoglu, K., Schwartz, M.A., 2006. Integrin signalling in directed cell migration. Biol Cell 98, 547–555. doi:10.1042/BC20060025.
and non-matrix substrates. Cardiovasc Res 69, 614–624. doi:10.1016/j. cardiores.2005.08.002.
Okada, K.I., Kijima, H., Imaizumi, T., Hirabayashi, K., Matsuyama, M., Yazawa, N., Oida, Y., Dowaki, S., Tobita, K., Ohtani, Y., Tanaka, M., Inokuchi, S., Makuuchi, H., 2009. Wall-invasion pattern correlates with survival of patients with gallbladder adenocarcinoma. Anticancer Res 29, 685–691.
Orme, M.E., Chaplain, M.A.J., 1996. A mathematical model of the first steps of tumour-related angiogenesis: Capillary sprout formation and secondary branching. IMA J Math Appl Med 13. doi:10.1093/imammb/13.2.73. Painter, K.J., Armstrong, N.J., Sherratt, J.A., 2010. The impact of adhesion
on cellular invasion processes in cancer and development. J Theor Biol 264, 1057–1067. doi:10.1016/j.jtbi.2010.03.033.
Parsons, S.L., Watson, S.A., Brown, P.D., Collins, H.M., Steele, R.J., 1997. Matrix metalloproteinases. Brit J Surg 84, 160–166. doi:10.1046/j. 1365-2168.1997.02719.x.
Pathak, A., Kumar, S., 2012. Independent regulation of tumor cell migration by matrix stiffness and confinement. P Natl Acad Sci USA 109, 10334– 10339. doi:10.1073/pnas.1118073109.
Pepper, M.S., 2001. Role of the matrix metalloproteinase and plasminogen activator-plasmin systems in angiogenesis. Arterioscl Throm Vas 21, 1104– 1117. doi:10.1161/hq0701.093685.
Perumpanani, A.J., Sherratt, J.A., Norbury, J., Byrne, H.M., 1996. Biolo-gical inferences from a mathematical model for malignant invasion. Invas Metast 16, 209–221. URL: http://wrap.warwick.ac.uk/16405/.
Perumpanani, A.J., Sherratt, J.A., Norbury, J., Byrne, H.M., 1999. A two parameter family of travelling waves with a singular barrier arising from the modelling of extracellular matrix mediated cellular invasion. Physica D 126, 145–159. doi:10.1016/S0167-2789(98)00272-3.