© 2018, IRJET | Impact Factor value: 7.211 | ISO 9001:2008 Certified Journal | Page 174
Implementation of WAMPAC Security and Stability Improvement of
Power Grids with Systems
Soheila Parandeh
1, Nasim S Esmaeilzadeh
2, Amir Vaezi
3, Kimia Parandeh
4, Ehsan Bagheri
51
Ms Soheila Parandeh, Departement of Electrical and Computer Engineering, Graduate University of Advanced
Technology, Haftbagh Road, Kerman, Iran.
2
Ms Nasim Esmaeilzadeh, Micro and Nanotechnology Depatement, Middle East Technical University,
Ankara, Turkey
3
Mr Amir Vaezi, Departement of Electrical and Computer Engineering, Azad University Kerman Branch, Joupar
Road, Kerman, Iran
4,5Ms
Kimia Parandeh, Departement of Electrical and Computer Engineering, Ghasrdasht St, Shiraz, Iran
---***---Abstract - In this paper, due to the importance of extensivemonitoring, protection and control systems as well as the importance of hybrid systems, both the AC and DC sectors have been attempted to make the implementation of the WAMPAC system more transparent to these types of networks. As a general rule, the main purpose of using extensive monitoring, protection and control systems is to consider the stability and security of power systems. Therefore, in this paper, the above principles are considered and, with respect to the sample network, the relevant strategies have been implemented, and the simulation results point to improving security and stability in the power grid.
Key Words: WAMPAC, Security, Sustainability, Intelligent Network, Combined Systems (Hybrid).
1. INTRODUCTION
Modern power network is required to automatically keep the entire system running and prevent the network to fail in peak demand periods when all power generation components and grid are under transient stresses[1, 2]. Intelligent learning and adaptive control systems have been investigated and applied in different areas of medicine, engineering, power systems, and robotic [3-6]. In [3][7], intelligent learning methods have been used for tumor motion tracking in external radiotherapy. The goal of intelligent network design is to provide a general monitoring system for creating control and security strategies to maintain system performance, stability and security[8, 9].
The ability to measure voltage and current phases in power systems allows for new controls that have been developed for phasor measurement techniques through the availability of data acquisition devices (DAQs) to monitor all points of the power system in real time [10]. This provides a practical view of the parameters, abnormal conditions and the stability and security of the system's information, and provides these developments with valuable information for the technical operator at the energy management center. Phase wise measurement technology is an excellent solution for improving the planning, operation, and activation of WAMPAC advanced monitoring, protection and control
applications [11-14]. Its structure can be categorized in three sections:
• Monitoring (monitoring) the operation of a large-scale power system from the point of view, size and angle of voltage and frequency (WAM) [15, 16].
• Special and advanced protection of the power system based on the phasor measurement in a large part of the power system called (WAP)[17].
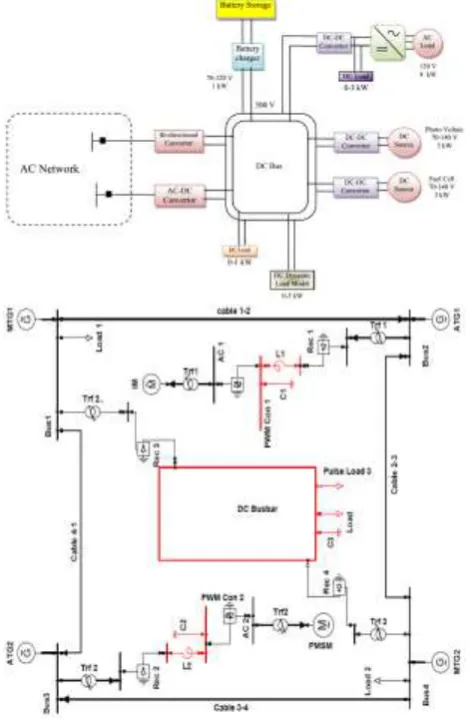
• The control of the system is based on the measurement of phasor in a large portion of the power system (WAC)[18]. As shown in Figure 1, the three above-mentioned factors integrate together the structure of the "Power Monitoring, Protection and Exhaust System" (WAMPAC) structure.
A DC distribution system allows direct connection of battery blocks to backup storage systems, which is often required by hospitals, large office buildings and industrial plants currently powered by UPS. Two modes of conversion (from AC to DC) and vice versa. The smart grid provides an excellent opportunity for power management and security [19]. Aminzahed et al. designed a set of horizontally vibration based piezoelectric device to harvest electrical energy from high rise building and investigated basement frequency effect on voltage amount [20].
© 2018, IRJET | Impact Factor value: 7.211 | ISO 9001:2008 Certified Journal | Page 175
power supplies, and optimization integrates the management of the system with the fieldbus systems [30].
Therefore, the control system must be robust and maintain the voltage within acceptable limits, as well as renewable energy generators should provide all power demand for the load, network and storage [31]. Security and resilient control of power system is easier to obtain if we reduce the high complexity of it by using dynamic model reduction methods[32, 33]. Defense strategy methods [34] are another retrofitting solutions that can increase cyber security of power system without any additional cost. According to the above, in this paper, a smart micro-grid, with both AC and DC side, is integrated as an AC / DC hybrid smart grid. As shown in Figure 2, the proposed network includes several sources that include generator side switches, network inverters, and controllable loads.
1.1 Controller design for a hybrid network
As shown in Figure 2, the AC side of the network includes AC sources such as synchronous generators and various load types, such as passive loads and motor loads, and so on, the DC network side to connect to other renewable resources and DC loads plus storage. The point is to consider the energy that is available from renewable DC sources, which not only need to respond to demand on the DC side, but also to supply AC side demand. Power sharing can lead to maintaining safety, increasing stability and reducing AC side oscillations, so using an AC-DC / DC-AC sofa provides the ability to exchange power between AC and DC side AC.
In order to investigate and evaluate the performance of the integrated AC /DC system and the network studied, this paper is presented in experimental load variations to show the system's behavior as well as active and reactive power control. In this experiment, with the availability of DC power grid, AC power demand and reactive power supply through the WAMPAC system, with all restrictions. Connecting the DC system to the bus with a bi-directional converter will enable the injection of any given amount of active and reactive power to a common point of connection [5]. Additionally, the DC system is responsible for adjusting the voltage of the PCC point. Clearly, the DC system only receives active power. With reference to Chart 1 and AC / DC mixing network performance above, it indicates the active and reactive power distribution between the AC and DC sectors and the AC frequency and the AC and DC bus bases.
1.2 Transient stability in micro-grid
The smart grid schematic shown in Figure 3, as seen in this structure, has two to four primary and auxiliary generators, respectively, of two main 36-megawatt generators and two 4-megawatt auxiliary generators connected to the DC-DC loop. The bulk of the load in this micro-grid relates to two 36.5 MW engines powered by an induction machine or permanent magnet, powered by a Pfigure WM drive as well as a dynamic propeller model as a mechanical load, and each rectifier is one of two DC's, one kilowatt it provides. The DC
distribution section is powered by two other rectifiers powered by the BAK converter, which feeds the voltages to different DC levels.
2. Pulse load simulation
When the load is in operation, it looks like a very small resistor that is similar to a short circuit or a very large load connection to the power system. The pulse-load function can be controlled by changing the trip trigger rate. In this section, we study the effects of the size and duration of the load pulses and its delays on the stability of the power system. Note that the dynamical behavior of the system in the presence of pulses is the main concern. Therefore, the system parameters that are affected in the presence of pulse loads need to be studied. For this purpose, at first, the 30 MW DC switch over the DC bus is set to 0.1. The simulation results of Chart 2 illustrate the stability of the system during the application of this pulse load. As shown in Chart 2, the output power of the main and auxiliary generators and pulse load was simulated in 15 seconds, and it was found that all parameters were in the steady state of the initial values. The first main generator (MTG), provides a large portion of the power of about 64% of the pulse load capacity and the second generator, will provide 30% of the remaining demand, which is shared between two auxiliary generators. In the case of a rectifier connected to bus 4, the load is directly supplied by the second generator and is responsible for supplying a large amount of load. It should be noted that power dividing and sharing depends on the location of the load pulse and the network topology.
© 2018, IRJET | Impact Factor value: 7.211 | ISO 9001:2008 Certified Journal | Page 176
It is seen from Chart 6 that an induction motor used as a drive force in the grid structure, would cause voltage collapse and, as a result, instability of the system. The load pulse causes the voltage and frequency effects on the stability of the system; additionally, in the event of a large drop in parameters, rotor angle stability, voltage deviations and frequencies should be considered [36].
Because under these conditions, protective systems may be cut off and disconnected from the grid. Therefore, there should be an alignment between the protective devices and the power system, through the Pulse-Load Test on the system, and this coordination is applied by means of the methods used for detecting non- Natural and high current, such as short-circuiting; in addition, the loading of equipment under these conditions for safety and damage prevention should be investigated.
3. Simulation of repeating pulses
In this section, a simulation and evaluation of the recurring pulses are considered, in which case several pulses occur in a given period. In order to investigate and simulate the behavior of the system under these conditions, 10 pulses are plotted with 0.1 second intervals that are repeated in 1 second. The Chart 7 shows trains of the pulses applied to the system and the active power output of the generators. And the main bus voltage and frequency are shown in Chart 8. The repetition of these pulses is one of the factors influencing the sustainability of power systems; voltage and frequency changes should be seen over the duration and length of these pulses. Some pulse loads due to the damping ratio or the large system inertial and the application of successive pulses result in a sharp drop in frequency and, therefore, a failure to return the frequency to normal and normal range. Chart 9 shows the degree of drop in frequency of about 2 Hz and its instability.
4. Dynamic Security Analysis
In this section, the network is considered to have isolated function and is not supported by the high-end network. Due to the fact that the load-to-production ratio is close to 1, this system will cause a significant transition in the system. Due to the small physics of the system, the connection of low impedance cables causes instability among the various components of the system. Given the load pulses in such a system, security analysis is required under different conditions with respect to storage distribution. Voltage limitation in AC and DC bus terminals and transient situations in pulse times are among the main security restrictions. In addition, the frequency of the AC voltage should be within the range of nominal voltages, and under these conditions, none of the system accessories, such as cables and transformers, should be overloaded, in the table 1 security restrictions are listed.
According to the above description, in this section simulations will be analyzed in two different functions. First mode, regardless of storages, and in the second case, the effects of storage distribution have been investigated. Mode
1 - Sample network security analysis with regional load distribution regardless of storages
In this case, the effects of the definite and pulse-load attendance are discussed. A single-line diagram of the sample network with regional load distribution is shown in Figure 4. Each of the rectifiers supplies one of two DC 0.318 kV buses. Thus, it has a 10 kV rated DC output system with a 3000 amp lithium battery as well as 200 micro Faraday microprocessor capacitors DC is used to connect the photovoltaic and DC bus to a PWM controlled DC / DC converter. It should be noted that for continuous communication between the AC and DC sectors of the two-way AC-DC / DC-AC converter used with PWM decoupage. An advanced controller for voltage source converter using Nyquist Array is designed in [37].
To study this mode, the voltages and loads are kept within the name range, and in the simulation of the transient mode, a pulsed train consisting of 4 pulses with a frequency of 0.2 Hz and a load ratio of 10% and a range of 20 kW is considered. Accordingly, Figures 14 to 17 show the frequency of the system and the load of generators, the power distribution based on pulse load conditions, the bus and voltage voltages AC and DC and the angle of the generator rotors.
The frequency fluctuation range is 0.5 ± Hz, and according to Chart 10 there is no additional overload in the generators. In Chart 11, the fast response of the super capacitor is due to the high power density at the start of the pulse load operation. In Chart 12, the transient and permanent voltages are shown in accordance with the limitations of Table 1.
Second Mode - Sample network security analysis considering the distribution of storage in different areas.
In this mode, cases such as thermal management, increased reliability and etc. in the presence of pulse load is discussed. Simulations also can be considered separately in each of the zones. But it is obvious that the highest reliability of storage distribution will be in distribution in all four regions; hence, according to Chart 13, the distribution of storage in all four areas has been investigated.
Table -1: Security Range
security range repemarap
1.1
-9.9 AC voltage range
69.5
-59.5 AC voltage frequency
%a11 raet seel System load components
1.1
© 2018, IRJET | Impact Factor value: 7.211 | ISO 9001:2008 Certified Journal | Page 177
Chart -1: Experimental results of AC / DC mixing networkperformance
Chart -2: Pulse load power behavior and active generator power
Chart -3: main bus voltage AC and DC bus in the presence of pulse load
© 2018, IRJET | Impact Factor value: 7.211 | ISO 9001:2008 Certified Journal | Page 178
Chart -5: Changes and voltage deviations and frequencyunder pulse load
Chart -6: Voltage and active power of induction generator in 1 second
Chart -7: Pulse train applied to the system and output power of the generator
© 2018, IRJET | Impact Factor value: 7.211 | ISO 9001:2008 Certified Journal | Page 179
Chart -9: Deviations and variations of voltage andfrequency under applied conditions
Chart -10: Frequency of the system and load of generators
Chart -11: Power split based on pulse load conditions
Chart -12: AC and DC bus voltages
© 2018, IRJET | Impact Factor value: 7.211 | ISO 9001:2008 Certified Journal | Page 180
Fig -1: WAMPAC system general schemaFig -2: Schematic network DC connected to the network
Fig -3: A single-line smart grid diagram studied
Fig -4: sample network studied with regional load distribution
3. CONCLUSION
One of the main challenges in present and future systems is the lack of proper and reliable analysis of real-time information from network performance. It is noteworthy that any problem in failing to send PMU information has an effect on monitoring, and the speed of WAMPAC system performance. The purpose of system security is to monitor system state when its state of operation changes from normal to emergencies. Therefore, rapid computations in complex systems are very necessary to solve the problem. Therefore, considering and categorizing issues such as overload can cause system instability and security problems which should be taken seriously; and by implementing this, the user of the system can have an appropriate visualization and knowledge of the security margins of the system in different situations. In this paper, we examined these factors to improve the performance of the WAMPAC system in the software environment.
REFERENCES
[1] J. Khalesi, S. Modaresahmadi, G. J. I. J. o. S. Atefi, and T. o. M. E. Technology, “SEM Gamma prime observation in a thermal and stress analysis of a first-stage Rene’89H gas turbine blade: numerical and experimental investigation,” pp. 1-14, 2018. [2] Y. Yan, Y. Qian, H. Sharif, D. J. I. c. s. Tipper, and
tutorials, “A survey on smart grid communication infrastructures: Motivations, requirements and challenges,” vol. 15, no. 1, pp. 5-20, 2013.
[3] L. Ghorbanzadeh, A. E. Torshabi, J. S. Nabipour, M. A. J. T. i. c. r. Arbatan, and treatment, “Development of a synthetic adaptive neuro-fuzzy prediction model for tumor motion tracking in external radiotherapy by evaluating various data clustering algorithms,” vol. 15, no. 2, pp. 334-347, 2016.
[image:7.595.309.555.83.264.2] [image:7.595.67.270.88.269.2] [image:7.595.44.280.336.696.2]© 2018, IRJET | Impact Factor value: 7.211 | ISO 9001:2008 Certified Journal | Page 181
[5] W. M. Nikshi, R. C. Hoover, M. D. Bedillion, and S.Shahmiri, "Trajectory Tracking of the Mixed conventional/braking Actuation Mobile robots using Model Predictive Control." pp. 704-709. [6] P. J. T. R. C.-C.-.-. STONE, Carnegie Mellon University,
http://www. cs. cmu. edu/~ pstone/pstone-home. html., “A Survey from a Machine Learning Perspective,” 1997.
[7] A. Esmaili Torshabi, L. J. T. i. c. r. Ghorbanzadeh, and treatment, “A Study on Stereoscopic X-ray Imaging Data Set on the Accuracy of Real-Time Tumor Tracking in External Beam Radiotherapy,” vol. 16, no. 2, pp. 167-177, 2017.
[8] N. R. Jennings, and M. Wooldridge, "Applications of intelligent agents," Agent technology, pp. 3-28: Springer, 1998.
[9] J. Rafiee, F. Arvani, A. Harifi, M. J. M. s. Sadeghi, and s. processing, “Intelligent condition monitoring of a gearbox using artificial neural network,” vol. 21, no. 4, pp. 1746-1754, 2007.
[10] D. A. Wilson, and M. S. Williamsen, "Peripheral data acquisition, monitor, and adaptive control system via personal computer," Google Patents, 1995. [11] Andani, Majid Taheri, and S. Shahmiri, “Fuzzy-Based
Sliding Mode Control and Sliding Mode Control of a Spherical Robot,” in Annual Conference of the IEEE Industrial Electronics Society, 2018.
[12] K. Ogra, Y. Chandra, A. Pandey, V. Verma, A. Kumar, and R. Sinha, "Evolution of Production Logging Technologies and Capabilities: In Quest to Know the Unknown, A Brownfield Case Study, Mumbai High, ONGC Western Offshore."
[13] C. R. Pandian, Software metrics: A guide to planning, analysis, and application: CRC Press, 2003. [14] F. Rahmani, F. Razaghian, A. J. W. A. o. S. Kashaninia,
Engineering, I. J. o. E. Technology, Computer, Energetic, Electronic, and C. Engineering, “Novel Approach to Design of a Class-EJ Power Amplifier Using High Power Technology,” vol. 9, no. 6, pp. 541-546, 2015.
[15] S. Raikawal, “wide area monitoring,control and protection of power system,” international journal of computer applications, 2015.
[16] V. Salehi, A. Mohamed, A. Mazloomzadeh, and O. A. J. I. T. o. S. G. Mohammed, “Laboratory-based smart power system, part II: Control, monitoring, and protection,” vol. 3, no. 3, pp. 1495-1417, 2012. [17] B. Singh, N. Sharma, A. Tiwari, K. Verma, S. J. I. J. o. E.
Singh, Science, and Technology, “Applications of phasor measurement units (PMUs) in electric power system networks incorporated with FACTS controllers,” vol. 3, no. 3, 2911.
[18] W. U. Rahman, M. Ali, C. A. Mehmood, and A. J. W. T. o. P. S. Khan, “Design and Implementation for Wide Area Power System Monitoring and Protection using Phasor measuring Units,” vol. 8, pp. 57-64, 2013.
[19] X. Fang, S. Misra, G. Xue, D. J. I. c. s. Yang, and tutorials, “Smart grid—The new and improved
power grid: A survey,” vol. 14, no. 4, pp. 944-980, 2012.
[20] I. Aminzahed, Y. Zhang, M. J. I. J. o. I. D. Jabbari, and Manufacturing, “Energy harvesting from a five-story building and investigation of frequency effect on output power,” vol. 19, no. 3, pp. 391-308, 2016. [21] A. A. Babajani, M. Jafari, and P. H. J. A. E. J. Sefat,
“Numerical investigation of distance effect between two Searasers for hydrodynamic performance,” vol. 55, no. 3, pp. 2257-2268, 2016.
[22] M. Besharati-Givi, and X. Li, "Performance analysis of fogging cooled gas turbine with regeneration and reheat under different climatic conditions." pp. V002T08A005-V002T08A005.
[23] M. Besharati-Givi, and X. Li, "Parametric study of inlet cooling with varied COP on gas turbine performance." pp. V002T08A004-V002T08A004. [24] M. Besharati-Givi, and X. Li, "Impact of blade cooling
on gas turbine performance under different operation conditions and design aspects." pp. V001T09A009-V001T09A009.
[25] D. S. Callaway, and I. A. J. P. o. t. I. Hiskens, “Achieving controllability of electric loads,” vol. 99, no. 1, pp. 184-199, 2011.
[26] Ö. Özdemir, F. D. Munoz, J. L. Ho, and B. F. J. I. T. o. P. S. Hobbs, “Economic analysis of transmission expansion planning with price-responsive demand and quadratic losses by successive LP,” vol. 31, no. 2, pp. 1096-1107, 2016.
[27] J. M. Guerrero, J. C. Vasquez, J. Matas, L. G. De Vicuña, and M. J. I. T. o. i. e. Castilla, “Hierarchical control of droop-controlled AC and DC microgrids—A general approach toward standardization,” vol. 58, no. 1, pp. 158-172, 2011.
[28] M. T. Andani, H. Pourgharibshahi, Z. Ramezani, and H. Zargarzadeh, "Controller design for voltage-source converter using LQG/LTR." pp. 1-6. [29] M. Shojaie, and O. A. Mohammed, "A Multi-input
DC-DC Converter with AC-DC-DC PFC Buck-boost Stage for Hybrid Energy storage Systems." pp. 1-5.
[30] J. Figueiredo, J. J. E. C. Martins, and Management, “Energy production system management– renewable energy power supply integration with building automation system,” vol. 51, no. 6, pp. 1120, 2010.
[31] H. Ibrahim, A. Ilinca, J. J. R. Perron, and s. e. reviews, “Energy storage systems—characteristics and comparisons,” vol. 12, no. 5, pp. 1221-1250, 2008. [32] M. Khatibi, T. Amraee, H. Zargarzadeh, and M.
Barzegaran, "Comparative analysis of dynamic model reduction with application in power systems." pp. 1-6.
[33] M. Khatibi, H. Zargarzadeh, and M. Barzegaran, "Power system dynamic model reduction by means of an iterative SVD-Krylov model reduction method." pp. 1-6.
© 2018, IRJET | Impact Factor value: 7.211 | ISO 9001:2008 Certified Journal | Page 182
[35] S. K. J. I. J. o. N.-L. M. Sinha, “Non-linear dynamicresponse of a rotating radial Timoshenko beam with periodic pulse loading at the free-end,” vol. 49, no. 1, pp. 113-149, 2005.
[36] J. Machowski, J. Bialek, J. R. Bumby, and J. Bumby, Power system dynamics and stability: John Wiley & Sons, 1997.