R E S E A R C H A R T I C L E
Open Access
Differential expression analysis of human
endogenous retroviruses based on ENCODE
RNA-seq data
Kerstin Haase
1, Anja Mösch
1and Dmitrij Frishman
1,2,3*Abstract
Background:Human endogenous retroviruses (HERVs) are flanked by long terminal repeats (LTRs), which possess
promoter activity and can therefore influence the expression of neighboring genes. HERV involvement in different types of cancer has already been thoroughly documented. However, so far there has been no systematic study of HERV expression patterns in a multitude of cell types in health and disease. In particular, the publication of the comprehensive ENCODE dataset has already facilitated many gene expression studies, but none so far focusing exclusively on HERVs.
Results:We present a comprehensive differential analysis of HERV expression based on ENCODE Tier 1 and Tier 2 RNA-seq data produced by Cold Spring Harbor Laboratories and the California Institute of Technology. This analysis was conducted for individual HERV loci and for entire HERV families in twelve different cell lines, of which six correspond to the normal condition and the other six represent cancer cell types. Although the principal component analysis revealed that the two groups of cells show distinguishable expression patterns, we were not able to link these differences to one or multiple particular HERV families. Two samples exhibit expression patterns, which are not similar to the corresponding cell lines of the other producing lab. Instead they show signs of cancer formation and expression of the pluripotency marker HERVH, despite being classified as a normal cell line and a differentiated cell, respectively.
Conclusions:Our study demonstrates that ENCODE data are generally comparable between the different
contributing labs and that the analysis of HERV elements can provide novel insights into differentiation and disease state of a cell that are easily overlooked when focusing on protein-coding genes. Our findings hint at a change in HERV expression during cancerogenesis.
Keywords:Gene expression, Cancer, Next-generation sequencing
Background
Human endogenous retroviruses (HERVs) are remnants of germline infections by exogenous retroviruses that were integrated into the host genome and passed on to the offspring. Estimates place the amount of human DNA that has a retroviral origin at 8 % [1]. Due to the
presence of the proviral pol gene, which encodes the
reverse transcriptase, HERVs can reintegrate copies of themselves in other genomic locations and hence belong to the group of transposable elements. In addition to the
gag, pol and env genes, which are counterparts of the
original functional virus genes, HERVs also contain long
terminal repeat sequences (LTRs) at the 5’ and 3’ end.
These LTRs have a strong promoter function, which can increase the transcription level of neighboring genes [2]. As internal viral genes tend to degrade over time due to the absence of evolutionary pressure, many HERV se-quences are lacking some, or even all of their ORFs, or contain their fragments. In particular, many solitary LTR sequences can be found in the human genome [3].
* Correspondence:[email protected] 1
Department of Genome Oriented Bioinformatics, Wissenschaftszentrum Weihenstephan, TU München, Maximus-von-Imhof-Forum 3, Freising 85354, Germany
2Helmholtz Center Munich - German Research Center for Environmental
Health (GmbH), Institute of Bioinformatics and Systems Biology, Ingolstädter Landstraße 1, Neuherberg 85764, Germany
Full list of author information is available at the end of the article
Some of the HERV loci in the human genome have been identified as being beneficial to the host. For example,
syn-cytin, encoded by the envgene of the HERV-W family is
linked to differentiation and morphogenesis of the placen-tal tissue and hypothesized to have immunosuppressive function that supports the maternofetal tolerance [4, 5]. There are also multiple studies linking HERVs to diseases such as multiple sclerosis and schizophrenia [6, 7], al-though they are mainly based on detecting elevated expres-sion levels of certain HERV families in affected individuals and do not necessarily shed light on causal relationships. HERVs have also been implicated in breast cancer and melanoma [8, 9] where samples of patients contained expressed HERV genes, viral proteins and antibodies for HERV peptides. However, in order to understand the causative mechanisms of HERV involvement in disease, a rigorous tissue specific differential expression analysis of HERV families between disease and healthy states is critic-ally required. Such differential analyses are complicated by the fact that HERVs are repetitive elements spread over the entire genome, which makes mapping of their transcripts to genomic loci particularly challenging. Previous attempts to create an overview of HERV expression patterns in dif-ferent tissues relied on a specifically designed chip with various captured retroviral pol sequences [10, 11] and were thus limited to the subset of HERV family members that still contain intact pol sequences. In order to increase the number of covered retroviral elements, a more compre-hensive approach, capable of identifying the full-length se-quences would be required. RNA-Seq has become a method of choice for addressing such problems [12] as it provides precise measurements of transcript levels in the cell and thus makes it possible to map all retroviral ele-ments, both structurally intact and partial, back to their genomic loci.
Over the past ten years the Encyclopedia Of DNA Elements project (ENCODE) [13] has been working on systematic identification of all functional elements in the human genome. With the most recent data release, made available in September 2014, ENCODE incorporates 27 different kinds of experiments, such as Exon Arrays, ChiP-Seq, and RNA-Seq analyses, conducted by seven research labs in order to gather as much information as possible on a standardized group of cell lines. These cell types are subdivided into three tiers depending on their assigned priority. Tier 1, which only contains three differ-ent cell types, constitutes the highest priority and has thus the largest number of conducted studies associated with it. All tiers include healthy cell lines as well as cancerous ones, and all data submissions are also subdivided based on the cellular compartments in which measurements were performed. The ENCODE guidelines force submit-ters to provide at least two biological replicates per experi-ment for more robust statistical analyses. There are a total
of 151 RNA-Seq experiments in the ENCODE summary
of the first stage (2007–2012), with 87 of them using small
RNA-Seq (as of September 2014).
Since this valuable resource of highly standardized refer-ence data became available, many research groups pub-lished studies integrating or comparing the ENCODE data to their own samples or conducting meta-analyses across
ENCODE cell lines [14–16]. ENCODE data has also been
used in computational studies on gene expression, but as of now transcriptome analyses spanning multiple cell types aim at protein-coding genes or functional regulatory RNAs [17, 18]. Examination of ENCODE RNA-Seq data with regard to HERV expression has either been limited to single cell types or covers HERVs only as a very small subset of the overall analysis [19, 20].
In this work we have comprehensively analyzed EN-CODE RNA-Seq data covering all annotated HERV loci in a broad variety of cell lines, disease and developmen-tal stages. We sought to gain an insight into the overall expression patterns of HERV elements and to examine on a large scale if there are measurable differences in HERV activity between cancer and normal cells, as already reported for individual tumor types. Furthermore, a major goal of our study was to assess the consistency of different ENCODE-contributing laboratories with regard to expres-sion values from the same cell lines.
We present the analysis of 25 RNA-Seq samples from
ENCODE’s top two priority tiers with regard to the
ex-pression of all annotated HERV loci obtained from the HERVd database [21, 22]. We found that there are con-siderable differences between the expression profiles obtained by single- vs paired-end sequencing, with the former showing lower overall expression. This finding holds true both for HERVs and for housekeeping genes. Apart from the discrepancies stemming from different library designs and two cases probably caused by trans-formation of the underlying cell lines, we did not observe any striking distinctions between the data provided by the two contributing laboratories. This suggests that EN-CODEs quality standards are sufficient to provide a robust basis for comparative analysis.
Results
Differential expression analysis shows strong differences between sequencing technologies
We detected HERV expression in all analyzed samples. The CSHL dataset has on average 120,411,532 mapped fragments, of which 0.73 % are assigned to HERV loci.
In Caltech’s paired-end data set, featureCount works
with 67,730,782 fragments on average, of which approxi-mately 1.3 % have been mapped to HERVd annotations. The single-end data sets include on average 20,640,141 reads, with 0.42 % of them assigned to HERV loci. A list showing all numbers of mapped fragments per sample as well as the fraction being assigned to HERV loci can be found in Additional file 1.
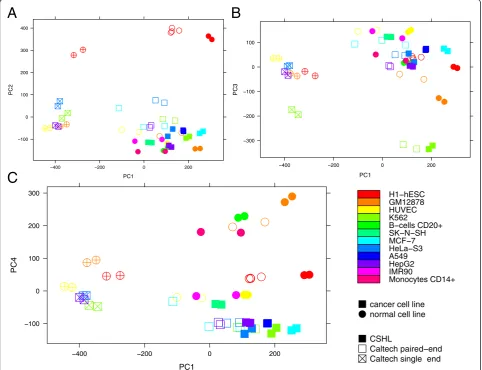
The principal component analysis of the transformed expression values of all 25 samples (Fig. 1) shows that the strongest differences in HERV expression result from
variations of the sequencing technology used. The first principal component (which captures 19.06 % of the total variance) clearly subdivides the Caltech samples into those analyzed by single- and paired-end sequen-cing. The second and third principal components, ac-counting for 10.30 % and 5.70 % of the variance, respectively, separate certain cell types from the rest of the datasets. While the second component clusters to-gether all eight embryonic stem cell samples, the third component lets the six K562 samples stand out. Finally, the fourth component (5.01 % of the variance) mostly reflects the differences between normal and cancer cell types, with the exception of the MCF-7 sample from Caltech where one replicate is clearly separated from the other two and overlaps with a normal tissue (HUVEC).
Given that single-end datasets lead to very different results compared to their paired-end counterparts, we
PC1
PC2
100 0 100 200 300 400
400 200 0 200
PC1
PC3
300 200 100 0 100
400 200 0 200
PC1
PC4
100 0 100 200 300
400 200 0 200
H1 hESC GM12878 HUVEC K562
B cells CD20+ SK N SH MCF 7 HeLa S3 A549 HepG2 IMR90
Monocytes CD14+
cancer cell line normal cell line
CSHL
Caltech paired end Caltech single end
A
B
C
Fig. 1Principal component analysis of normalized HERV expression values in 25 ENCODE RNA-Seq data sets. The first, second, third, and fourth principal components account for 19.06 %, 10.30 %; 5.70 %, and 5.01 % of the variance, respectively. Each data point represents one replicate. Circles: normal cell lines; squares: cancer cells; filled symbols: CSHL samples; empty symbols: Caltech; crosses in the symbols: single-end sequencing.
decided to exclude them from the further analyses to pre-vent them from introducing a bias into the expression data. The paired-end data seems to give a better overview of the expression rates. Note that in the GEO summary of the ENCODE Caltech RNA-Seq data, the single-end protocol which is also strand-specific, is described as less reliable for quantification [http://www.ncbi.nlm.nih.gov/ geo/query/acc.cgi?acc=GSE33480].
Housekeeping genes confirm strong differences in ENCODE expression data, especially between different sequencing protocols
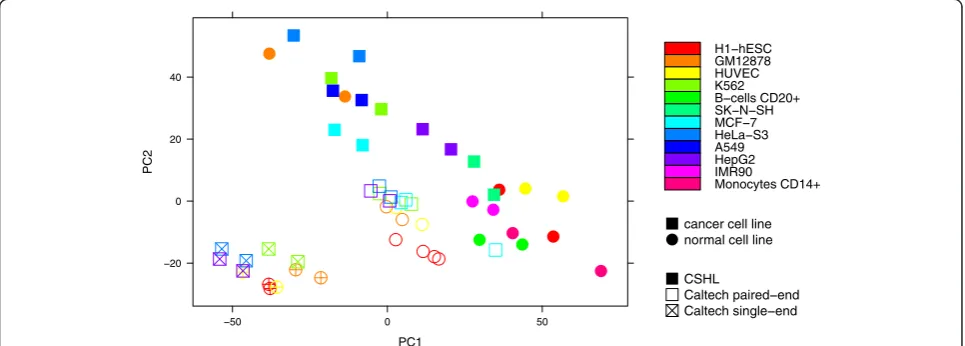
Differences in expression of housekeeping genes were also mostly due to the used library protocols. While the first principal component (accounting for 30.67 % of the variance) primarily divides the CSHL cell lines into
can-cerous and normal ones (with the exception of CSHL’s
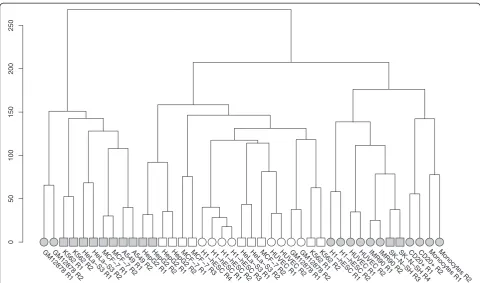
GM12878 and a small overlap involving SK-N-SH), the samples provided by Caltech are neatly separated into paired- and single-end protocols (Fig. 2). A hierarchical clustering of housekeeping genes based on the Euclidean distances between their expression vectors yields three subtrees. One of them contains exclusively Caltech and the other two contain only CSHL samples. The two CSHL subtrees separate nearly perfectly cancerous from normal call lines, with the exception of GM12878 and SK-N-SH (Fig. 3).
The observed differences thus do not depend on the chosen transcript family, but are rather indeed an inher-ent pattern in the ENCODE datasets.
Two cell lines show behavior atypical for their disease and developmental stage
After excluding the single-end Caltech samples, we cal-culated the Euclidean distances between the transformed
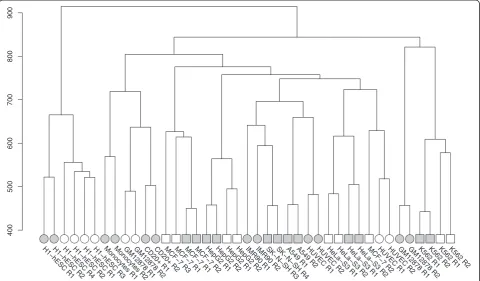
expression vectors for all remaining paired-end datasets and performed a hierarchical clustering. As seen in Fig. 4, most replicates are highly similar to each other with regard to HERV expression, with the exception of
IMR90 and the second replicate of Caltech’s MCF7
se-quencing. ESCs are clearly the most diverse among the differentiated cell types, serving as an outgroup.
Par-ticularly striking is the clustering of CSHL’s GM12878
replicates. While the same cell line, analyzed by Caltech, is branched together with two other healthy
blood cell types, GM12878’s expression vectors
deter-mined at CSHL cluster with all four exadeter-mined blood cancer samples (K562).
In addition to the global clustering presented above we also compared every condition against every other condition in a pairwise fashion, leading to 171 differ-ential expression analyses. Following the common practice [23, 24] we defined significantly differentially expressed HERV loci as those with an absolute value of the logarithmic fold change of at least one and the adjusted p-value smaller than 0.001 (FDR of 0.1 %). The number of identified loci varied depending on the compared samples (Fig. 5). Pairwise analyses in-volving embryonic stem cells led to the largest num-ber of differences with up to 956 significant loci (Caltech H1-hESC vs. CSHL HepG2). The smallest number of significantly differentially expressed loci between two different cell types is three and occurs three times (Caltech and CSHL HUVEC vs. IMR90 and Caltech MCF-7 vs. CSHL HeLa-S3). While the largest numbers of differentially expressed HERVs are seen when ESCs are compared to the other cell types,
it is remarkable that Caltech’s HeLa-S3 line shows
very few loci, which are significant in comparison with both H1-hESC samples (see Fig. 5).
PC1
PC2
20 0 20 40
50 0 50
H1 hESC GM12878 HUVEC K562 B cells CD20+ SK N SH MCF 7 HeLa S3 A549 HepG2 IMR90
Monocytes CD14+
cancer cell line normal cell line
CSHL
Caltech paired end Caltech single end
Caltech’s HeLa-S3 cell line shows a strong up-regulation of HERVH, typical for embryonic stem cells
Upon extracting all significantly over-expressed loci per cell type from the pairwise comparisons and grouping them by their family affiliation, we observed characteris-tic patterns for different samples. The eight most often up-regulated HERV families are four internal and four LTR sequences (Fig. 6). Internal regions that are most overexpressed in the pairwise comparisons are ERVL, a very old endogenous element that is found even outside of primates and shows high similarity to foamy retrovi-ruses [25] and its younger relative HERVL. Additionally, two LTR sequences, LTR16C and LTR33, are also among the eight most often overexpressed families, which be-long to the ERVL superfamily. The other two internal families are the pluripotency marker HERVH and the young human endogenous viral element, which is also the most active in terms of expression and transposition, HERVK [26]. The two additional often up-regulated LTR sequences are LTR7, which is a long terminal repeat se-quence of HERVH, and LTR12, belonging to the HERV superfamily ERV1.
Overall, the same cell types analyzed by any two la-boratories show a similar composition of HERV families, with the exception of GM12878 from CSHL, which ex-hibits a nearly double amount of significant HERVs
compared to its Caltech counterpart. Especially the large number of ERVL members in the CSHL sample is un-matched in the corresponding Caltech cell line. The only other cell types with a similar large number of active
HERVL loci is CSHL’s K562 sample, which is also a
blood cell type, but contrary to GM12878 cancerous. Another cell line that exhibits an extremely deviant behavior in the lab comparison is HeLa-S3 from Caltech. It appears to over-express an immense amount of HERVH family members (290 loci), which are only found in low numbers in all other specialized cells. The over-expression is not as strong as in the embryonic stem cells, but is higher than any other number of a single HERV family in all other cell lines (Fig. 6). The differ-ence between cancerous and normal cell lines revealed by the principal component analysis could not be linked to a particular overexpressed HERV family. We were not able to identify any expression patterns sep-arating the six normal from the six cancer cell lines on the basis of individual HERV families.
Discussion
Based on the comprehensive analysis of 25 RNA-Seq sam-ples from the ENCODE project with regard to their HERV expression we find that datasets created with different se-quencing library methods (paired- vs single-end) are not
0
50
1
00
150
200
250
GM12878 R1GM12878 R2K562 R1K562 R2HeLa
S3 R1 HeLa
S3 R2 MCF
7 R1 MCF
7 R2
A549 R1A549 R2HepG2 R1HepG2 R2HepG2 R1HepG2 R2MCF
7 R1 MCF
7 R3 H1
hESC R4 H1
hESC R1 H1
hESC R2 H1
hESC R3 HeLa
S3 R1 HeLa
S3 R2 MCF
7 R2
HUVEC R1HUVEC R2GM12878 R1GM12878 R2K562 R1K562 R2H1 hESC R1 H1
hESC R2 HUVEC R1HUVEC R2IMR90 R1IMR90 R2SK
N SH R3 SK
N SH R4
CD20+ R1CD20+ R2Monocytes R1Monocytes R2
very easily comparable, because single-end samples achieve less coverage. This is expected, as the sequencing tech-nique used by Caltech is strand specific and as such trades quantification against a qualitative analysis.
Although a principal component analysis of the HERV expression patterns in different cell types revealed the possibility to distinguish cancerous from healthy samples based on HERV activity, we could not link this difference to a specific HERV family. However, our study revealed unexpected results regarding GM12878 from CSHL, which showed hints of being a tumorous cell line in two different analyses. First, a hierarchical clustering of all HERV loci expression grouped this cell type with all four K562 (blood cancer) replicates instead of the GM12878 samples from CSHL. Second, the composition of up-regulated HERV families in this sample, when compared to all others, is much more similar to that of K562, espe-cially regarding the strong activity of ERVL. A possible reason for this behavior could be the transformation of an initially normal cell line to a tumorous one prior to experimental measurements. However, this explanation does not seem to be particularly plausible given that ENCODE imposes strict data quality requirements, espe-cially with regard to tier 1 cell lines to which GM12878 belongs. The respective Caltech GM12878 RNA-Seq track has been accessible through the UCSC genome
browser [27, 28] since August 2012 and so far no unusual features of this dataset, including a possible progression towards a tumor line, have been reported. It is conceiv-able that the change in HERV expression detected in our study, which is the first comprehensive investiga-tion of HERV expression in ENCODE samples, occurs very early in the transition from a normal to a cancer cell type and hence remained undetected in studies fo-cusing on protein-coding gene expression, although we were able to detect aberrant behavior hinting at this change when performing PCA on housekeeping genes. Further research is needed to verify this hypothesis, as it implies that unusual HERV expression could serve as an early indication of carcinogenic transformation and thus represent a valuable diagnostic lead.
Another striking finding is the low amount of
differen-tially expressed HERVs when comparing Caltech’s HeLa-S3
sample to the ESCs. The strongest difference between HERV expression in ESCs compared against specialized cell types is the very strong up-regulation of HERVH family
members. Because HERVH activity is also high in Caltech’s
HeLa cells, unmatched in any of the other differentiated cell types, the difference in expression pattern to ESCs is understandably small. The HERVH family is known to play a vital role in embryonic stem cells. In particular, since they can serve as a marker for pluripotency due to their strong
400
500
600
700
800
900
H1−hESC R1H1−hESC R2H1−hESC R4H1−hESC R2H1−hESC R1H1−hESC R3Monocytes R1Monocytes R2GM12878 R1GM12878 R2CD20+ R1CD20+ R2MCF−7 R3MCF−7 R1MCF−7 R1MCF−7 R2HepG2 R1HepG2 R2HepG2 R1HepG2 R2IMR90 R1IMR90 R2SK−N−SH R3SK−N−SH R4A549 R1A549 R2HUVEC R1HUVEC R2HeLa−S3 R1HeLa−S3 R2HeLa−S3 R1HeLa−S3 R2MCF−7 R2HUVEC R1HUVEC R2GM12878 R1GM12878 R2K562 R1K562 R2K562 R1K562 R2
association with binding sites for the pluripotency tran-scription factors NANOG, OCT4 and SOX2 [29]. Fur-thermore, it has been suggested that HERVH and its LTR7 can recruit the transcription factors p300 and OCT4 to regulate the transcription of pluripotency-associated transcripts [20]. Intriguingly, Santoni et al. also used ENCODE RNA-Seq data from Caltech to analyze HERVs in hESCs, although they relied on the
2010 data release whereas in this study we utilized the most recent data published in 2012. For comparison with differentiated cells, Santoni et al. also obtained the 2010 data on corresponding HeLa-S3 cells and found
that “HERV-H expression is barely detectable in HeLa”,
although it was identified when using transient-transfection assays [30]. It is thus apparent that there has been a significant change between the 2010 and
H1 hESC_CSHL
H1
hESC_CaltechHepG2_CSHLK562_CSHL
GM12878_CSHLHUVEC_CSHLCD20+_CSHLSK N
SH_CSHL HeLa
S3_Caltech HeLa
S3_CSHL A549_CSHL
MCF 7_CSHL
K562_Caltech HUVEC_Caltech
GM12878_CaltechHepG2_CaltechMCF 7_Caltech
IMR90_CSHL Monocytes_CSHL
H1 hESC_CSHL H1
hESC_Caltech HepG2_CSHL K562_CSHL GM12878_CSHL HUVEC_CSHL CD20+_CSHL SK
NSH_CSHL HeLa
S3_Caltech HeLa
S3_CSHL A549_CSHL MCF
7_CSHL K562_Caltech HUVEC_Caltech GM12878_Caltech HepG2_Caltech MCF
7_Caltech IMR90_CSHL Monocytes_CSHL
0 400 800
Value
Color Key
2012 HERV expression data submitted to the ENCODE project by Caltech.
Santoni et al. observed that the HERV expression strength in ESCs diminishes during differentiation. Ex-pression is highest at the undifferentiated N0 stage, still observable during N1 (early initiation), and only barely measurable during N2 (neural progenitor). Thus, a
con-ceivable explanation for the behavior of Caltech’s HeLa-S3
cells would be reprogramming towards pluripotency, although an underlying mechanism for this process re-mains enigmatic.
Conclusions
In this study we analyzed the expression of known human endogenous retroviral elements in RNA-Seq samples from the ENCODE project. It is the first examination of se-quencing data from a variety of cell types and labs with regard to HERV expression patterns.
We found that all analyzed cell lines have active HERV loci and, by performing differential expression analysis, we identified cell type specific expression pat-terns. Our analysis also revealed discrepancies between different RNA-Seq datasets: single cell lines showed sig-nificantly different expression profiles depending on the laboratory where measurements were conducted. We verified that this finding was not due to the particular
kind of transcripts considered, namely HERVs, by re-peating the same analysis with housekeeping genes.
Furthermore, in two cases deviant expression patterns were closer to those of a completely different cell type than the same line from a different research institution.
Thus, we believe it is of particular importance to monitor cultured cell lines very closely as small changes to a cell type can lead to major alterations of expression patterns for some non-coding RNAs. While conducting differential expression analysis it might not be sufficient to regard even identical cell lines as comparable. Our analysis of cancer-specific HERV families is further com-plicated by consideration of distinctly different cancer cell lines. However, PCA shows that there is an inform-ative signal in the expression data differentiating cancer from normal cell lines.
If further investigations confirm that a change in HERV expression patterns is an early sign of cell trans-formation, it can be utilized as a diagnostic tool to help recognize tumor formation.
Methods RNA-Seq data
We obtained RNA-Seq data for the ENCODE Tier 1 and Tier 2 cell types mapped against the latest human genome assembly (hg19) using the UCSC track download portal
[31, 32]. Only samples from the ENCODE category long
H1−hESC Cal tech H1−hESC C SHL GM12878 Caltech GM12878 CSHL HUVEC C al tech HUVEC C SH L K562 C a lt ech K562 C SHL CD20+ CSH L SK−N−SH C SH L MCF−7 Caltech MCF−7 C SH L HeLa−S3 Caltech HeLa−S3 C S HL A549 CSH L HepG2 Calt e ch HepG2 CSHL IMR90 CSH L Monocytes−CD14+ C S HL
Number of diff
erentially o v er−e xpressed loci 0 200 400 600 800 1000 Other ERVL HERVH HERVK HERVL LTR12 LTR16C LTR33 LTR7
RNA extracts (>200 bp) were considered, as short RNA extractions aim at identifying small non-coding RNAs while our proviral remnants of interest are considerably longer (mean length of 928 nt). We further restricted the considered tracks to whole cell extracts, as we are inter-ested in the overall analysis of HERV expression in the en-tire human cells rather than in individual compartments.
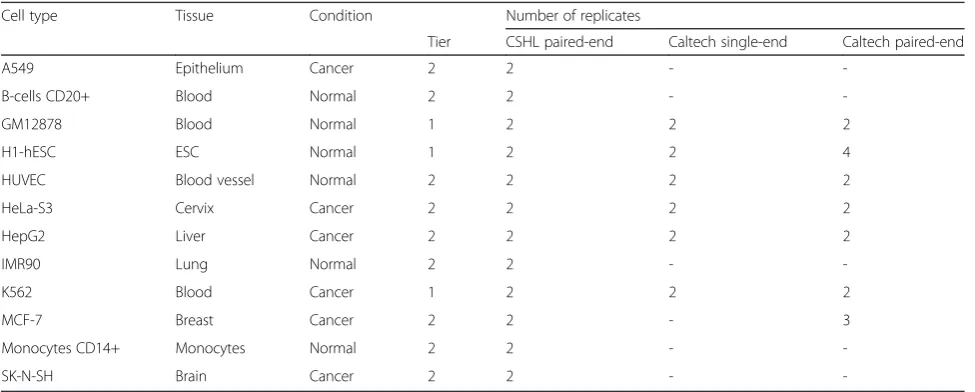
We focused on data produced by either the Cold Spring Harbor Laboratories (CSHL) or the California Institute of Technology (Caltech) (Table 1) because these provide the most comprehensive coverage of (mostly) the same cell types, facilitating a direct comparison of the results produced by these two groups. Moreover, due to the fact that Caltech performed both single-end and paired-end sequencing on a subset of cell types, expression analysis results can also be compared between differ-ent library preparations. However, the single-end data sets contain fewer reads and we therefore investigated whether or not this lower coverage is still sufficient to detect HERVs, which make up only a small
frac-tion of the cell’s transcriptome.
HERV annotation
We used the currently most comprehensive collection of annotated HERVs, the HERVd database [21, 22]. This database contains 98,008 entries describing 224 different HERV families, from full-length proviral elements to sin-gular Long Terminal Repeats (LTRs). Since the HERVd annotation is based on the hg17 assembly of the human genome we transferred all genomic coordinates to hg19 using the liftOver tool [27].
A number of HERVd entries did not survive the lifting process: 2,342 entries are completely or partially deleted and another 24 entries are split in the latest hg19 assem-bly. We nevertheless attempted to identify the location
of these entries in hg19 by sequence similarity searches using BLAT [33]. Similarity hits were accepted as the origin of a given HERV if the corresponding alignments were gap free, covered the complete query sequence, and had a minimum sequence identity of at least 98 %. In the same fashion we identified additional viral elements in hg19 by using all known HERV sequences as query and accepting new origins when they met the identity cutoff. It should be noted that we only performed similarity searches in regions without existing HERV annotations to avoid du-plicated entries. However, while the initial HERVd already contains HERV loci that are overlapping with each other, we decided against filtering these out in order not to lose HERV annotations.
Our initial HERV data set contained 100,495 loca-tions in hg19. HERVd entries located on chromosome Y were excluded from consideration as this chromo-some is not covered by all ENCODE datasets used in our study. This filtering step left us with a total of 98,998 annotated HERV loci (Additional file 2) for which we obtained read counts.
HERV expression in ENCODE RNA-Seq
We calculated the read coverage over the HERVd entries
for every RNA-Seq experiment using the“featureCount”
tool of the subread package [34]. For every annotated viral element it returns the number of reads mapped to it in every analyzed sequencing run. The program was
executed with the “primary” option, which forces
fea-tureCount to only take primary alignments into account, thus avoiding biased expression values through non-uniquely mapped reads. This is extremely important when working on HERV loci, as the different families, due to their varying integration ages, have unequal de-grees of similarities among the family members. Thus, it
Table 1ENCODE RNA-Seq data used in this study
Cell type Tissue Condition Number of replicates
Tier CSHL paired-end Caltech single-end Caltech paired-end
A549 Epithelium Cancer 2 2 -
-B-cells CD20+ Blood Normal 2 2 -
-GM12878 Blood Normal 1 2 2 2
H1-hESC ESC Normal 1 2 2 4
HUVEC Blood vessel Normal 2 2 2 2
HeLa-S3 Cervix Cancer 2 2 2 2
HepG2 Liver Cancer 2 2 2 2
IMR90 Lung Normal 2 2 -
-K562 Blood Cancer 1 2 2 2
MCF-7 Breast Cancer 2 2 - 3
Monocytes CD14+ Monocytes Normal 2 2 -
-is easier to assign a read to its exact loci for older and more distinct families than for younger families. An alter-native to using the primary alignment would be to only use uniquely mapped reads, but this would bias the ex-pression values towards older HERV families (see Fig. 7).
Furthermore, in the data sets comprised of paired-end reads the entire fragment was counted only once to maintain comparability with the single-end samples. Reads in stranded datasets were counted in a strand-specific manner; these include the single-ended Caltech samples and all CSHL samples.
Differential expression analysis
The coverage depth of HERV loci between 25 ENCODE samples (Table 1) was compared using the R
bioconduc-tor packageDESeq[35–37] , which is specially designed
for differential expression analysis. To achieve a better comparability between samples we normalized their count data by library size and carried out a variance sta-bilizing transformation based on the inherent biological variability between the replicates of the same condition. We then performed a principal component analysis (PCA) and calculated the Euclidean distances between the transformed expression values to detect overall dif-ferences between the samples.
The following analyses were limited to the paired-end RNA-Seq data as PCA revealed extensive differences be-tween single- and paired-end library preparations. Hence to avoid introducing a bias in the differential expression
analysis, we excluded single-end data. The read count value of every condition, normalized by the library size, was compared in a pairwise fashion against every other condition, resulting in 171 differential expression
ana-lyses and the corresponding fold changes. The DESeq
implementation of the negative binomial test was than used to find significant differences in the calculated ex-pression values. The initial p-values were adjusted for multiple testing using the Benjamini-Hochberg proced-ure [38] . In order to identify significantly differentially expressed HERVs we filtered for loci whose absolute logarithmic fold change was at least one and whose ad-justed p-Value did not exceed 0.001 (which is equivalent to a false discovery rate of 0.1 %).
For every analyzed cell type, we compiled a list of HERV loci up-regulated in at least one of the pairwise comparisons. By considering the corresponding families of loci, we sought to identify HERVs that are particularly active in certain cell types and under certain conditions.
Validation on housekeeping genes
In order to ascertain that the differences in HERV expres-sion between different conditions and library preparations reported in this study are not due to computational or ex-perimental biases specific to endogenous viral elements, we repeated our analysis with a set of housekeeping genes. For this purpose we used the list of 3,804 genes compiled by Eisenberg and Levanon [39]. This list was created based on RNA-seq data from 16 different human tissues by first
identifying housekeeping exons, i.e. those exons expressed in all tissues, displaying low variance between tissues, and showing no exceptional expression in any single data set. Housekeeping genes were then defined as those genes, for which at least one annotated RefSeq transcript has more than half of its exons classified as housekeeping. When ac-quiring the annotation file for the housekeeping genes from the UCSC genome browser, only 3,801 entries could be retrieved, as three identifiers [RefSeq: NM_032937, NM_003926, NM_032560] had been removed from the RefSeq database. The assessment of coverage for every housekeeping gene in all our selected ENCODE data sets was carried out exactly as described above for HERVd, in-cluding normalization and principal component ana-lysis (The featureCount output for all housekeeping genes can be found in Additional file 3).
Additional files
Additional file 1:Read statistics per sample.For all analyzed ENCODE samples the number of fragments/reads which are used as input for featureCount are listed as well as the fraction of reads mapping to HERVd annotated loci. (CSV 1 kb)
Additional file 2:HERVd annotation of HERV loci in hg19.Tabular file contains columns for unique identifier, chromosome, start and stop position, strand and HERV family, respectively. The remaining columns represent the read counts from featureCount for all of the analyzed ENCODE samples. (CSV 14292 kb)
Additional file 3:Read counts of housekeeping genes.Tabular file containing the featureCount counts for all genes classified as housekeeping by Eisenberg and Levanon [39]. (CSV 1000 kb)
Competing interests
The authors declare that they have no competing interests.
Authors’contributions
DF conceived the study. KH performed the differential expression analysis. AM set up the HERV database. KH and DF designed the study and wrote the manuscript. All authors read and approved the final manuscript.
Acknowledgments
The authors would like to thank Prof. Christine Leib-Mösch for valuable comments regarding this manuscript.
Author details
1Department of Genome Oriented Bioinformatics, Wissenschaftszentrum
Weihenstephan, TU München, Maximus-von-Imhof-Forum 3, Freising 85354, Germany.2Helmholtz Center Munich - German Research Center for Environmental Health (GmbH), Institute of Bioinformatics and Systems Biology, Ingolstädter Landstraße 1, Neuherberg 85764, Germany.3St Petersburg State Polytechnical University, St. Petersburg 195251, Russia.
Received: 11 December 2014 Accepted: 28 October 2015
References
1. Griffiths D: Endogenous retroviruses in the human genome sequence. Genome Biology2001, 2(6):reviews1017-reviews1017.5
2. Rebollo R, Romanish MT, Mager DL. Transposable elements: An abundant and natural source of regulatory sequences for host genes. Annu Rev Genet. 2012;46:21–42.
3. Mager DL, Medstrand P. Retroviral repeat sequences. In Encyclopedia of the Human Genome. London: Nature Publishing Group; 2003:57–63.
4. Mangeney M, Renard M, Schlecht-Louf G, Bouallaga I, Heidmann O, Letzelter C, et al. Placental syncytins: Genetic disjunction between the fusogenic and immunosuppressive activity of retroviral envelope proteins. Proc Natl Acad Sci U S A. 2007;104(51):20534–9.
5. Mi S, Lee X, Li X, Veldman GM, Finnerty H, Racie L, et al. Syncytin is a captive retroviral envelope protein involved in human placental morphogenesis. Nature. 2000;403(6771):785–9.
6. Karlsson H, Schröder J, Bachmann S, Bottmer C, Yolken RH. HERV-W-related RNA detected in plasma from individuals with recent-onset schizophrenia or schizoaffective disorder. Mol Psychiatry. 2004;9(1):12–3.
7. Kolson DL, Gonzalez-Scarano F. Endogenous retroviruses and multiple sclerosis. Ann Neurol. 2001;50(4):429–30.
8. Buscher K, Hahn S, Hofmann M, Trefzer U, Ozel M, Sterry W, et al. Expression of the human endogenous retrovirus-K transmembrane envelope, Rec and Np9 proteins in melanomas and melanoma cell lines. Melanoma Res. 2006;16(3):223–34.
9. Frank O, Verbeke C, Schwarz N, Mayer J, Fabarius A, Hehlmann R, et al. Variable transcriptional activity of endogenous retroviruses in human breast cancer. J Virol. 2008;82(4):1808–18.
10. Seifarth W, Spiess B, Zeilfelder U, Speth C, Hehlmann R, Leib-Mösch C. Assessment of retroviral activity using a universal retrovirus chip. J Virol Methods. 2003;112(1–2):79–91.
11. Seifarth W, Frank O, Zeilfelder U, Spiess B, Greenwood AD, Hehlmann R, et al. Comprehensive Analysis of Human Endogenous Retrovirus Transcriptional Activity in Human Tissues with a Retrovirus-Specific Microarray. J Virol. 2005;79(1):341–52.
12. Wang Z, Gerstein M, Snyder M. RNA-Seq: a revolutionary tool for transcriptomics. Nat Rev Genet. 2009;10(1):57–63.
13. The ENCODE Project Consortium. The ENCODE (ENCyclopedia Of DNA Elements) Project. Science. 2004;306(5696):636–40.
14. Djebali S, Davis CA, Merkel A, Dobin A, Lassmann T, Mortazavi A, et al. Landscape of transcription in human cells. Nature. 2012;489(7414):101–8. 15. Hart T, Komori H, LaMere S, Podshivalova K, Salomon D. Finding the
active genes in deep RNA-seq gene expression studies. BMC Genomics. 2013;14(1):778.
16. Park E, Williams B, Wold BJ, Mortazavi A. RNA editing in the human ENCODE RNA-seq data. Genome Res. 2012;22(9):1626–33.
17. Bánfai B, Jia H, Khatun J, Wood E, Risk B, Gundling WE, et al. Long noncoding RNAs are rarely translated in two human cell lines. Genome Res. 2012;22(9):1646–57.
18. Harrow J, Frankish A, Gonzalez JM, Tapanari E, Diekhans M, Kokocinski F, et al. GENCODE: The reference human genome annotation for The ENCODE Project. Genome Res. 2012;22(9):1760–74.
19. Criscione S, Zhang Y, Thompson W, Sedivy J, Neretti N. Transcriptional landscape of repetitive elements in normal and cancer human cells. BMC Genomics. 2014;15(1):583.
20. Lu X, Sachs F, Ramsay L, Jacques PE, Göke J, Bourque G, et al. The retrovirus HERVH is a long noncoding RNA required for human embryonic stem cell identity. Nat Struct Mol Biol. 2014;21:423–5.
21. Pačes J, Pavlíček A, Pačes V. HERVd: database of human endogenous retroviruses. Nucleic Acids Res. 2002;30(1):205–6.
22. Pačes J, Pavlíček A, Zika R, Kapitonov VV, Jurka J, Pačes V. HERVd: the Human Endogenous RetroViruses Database: update. Nucleic Acids Res. 2004;32 suppl 1:D50.
23. Gao Y, Xu H, Shen Y, Wang J. Transcriptomic analysis of rice (Oryza sativa) endosperm using the RNA-Seq technique. Plant Mol Biol. 2013;81(4–5):363–78.
24. Ling YH, Xiang H, Li YS, Liu Y, Zhang YH, Zhang ZJ, et al. Exploring differentially expressed genes in the ovaries of uniparous and multiparous goats using the RNA-Seq (Quantification) method. Gene. 2014;550(1):148–53.
25. Cordonnier A, Casella JF, Heidmann T. Isolation of novel human endogenous retrovirus-like elements with foamy virus-related pol sequence. J Virol. 1995;69(9):5890–7.
26. Tönjes RR, Löwer R, Boller K, Denner J, Hasenmaier B, Kirsch H, et al. HERV-K: the biologically most active human endogenous retrovirus family. J Acquir Immune Defic Syndr Hum Retrovirol. 1996;13 Suppl 1:S261–7.
27. Hinrichs AS, Karolchik D, Baertsch R, Barber GP, Bejerano G, Clawson H, et al. The UCSC Genome Browser Database: update 2006. Nucleic Acids Res. 2006;34(Database issue):D590–8.
29. Santoni F, Guerra J, Luban J. HERV-H RNA is abundant in human embryonic stem cells and a precise marker for pluripotency. Retrovirology. 2012;9(1):111. 30. Schön U, Diem O, Leitner L, Gunzburg WH, Mager DL, Salmons B, et al.
Human endogenous retroviral long terminal repeat sequences as cell type-specific promoters in retroviral vectors. J Virol. 2009;83(23):12643–50. 31. Raney BJ, Dreszer TR, Barber GP, Clawson H, Fujita PA, Wang T, et al. Track
data hubs enable visualization of user-defined genome-wide annotations on the UCSC Genome Browser. Bioinformatics. 2014;30(7):1003–5. 32. Rosenbloom KR, Sloan CA, Malladi VS, Dreszer TR, Learned K, Kirkup VM,
et al. ENCODE Data in the UCSC Genome Browser: year 5 update. Nucleic Acids Res. 2013;41(D1):D56–63.
33. Kent WJ. BLAT-the BLAST-like alignment tool. Genome Res. 2002;12(4):656–64. 34. Liao Y, Smyth GK, Shi W. featureCounts: an efficient general purpose
program for assigning sequence reads to genomic features. Bioinformatics. 2014;30(7):923–30.
35. Anders S, Huber W. Differential expression analysis for sequence count data. Genome Biol. 2010;11:R106.
36. Gentleman RC, Carey VJ, Bates DM, Bolstad B, Dettling M, Dudoit S, et al. Bioconductor: Open software development for computational biology and bioinformatics. Genome Biol. 2004;5:R80.
37. R Core Team. R: A Language and Environment for Statistical Computing. Vienna: R Foundation for Statistical Computing; 2013. http://www.R-project.org. 38. Benjamini Y, Hochberg Y. Controlling the False Discovery Rate: A Practical
and Powerful Approach to Multiple Testing. J R Stat Soc Ser B Methodol. 1995;57(1):289–300.
39. Eisenberg E, Levanon EY. Human housekeeping genes, revisited. Trends Genet. 2013;29(10):569–74.
Submit your next manuscript to BioMed Central and take full advantage of:
• Convenient online submission
• Thorough peer review
• No space constraints or color figure charges
• Immediate publication on acceptance
• Inclusion in PubMed, CAS, Scopus and Google Scholar
• Research which is freely available for redistribution