4438 VALIDATED COLORIMETRIC METHOD FOR THE ESTIMATION OF
SUCCINYL CHOLINE CHLORIDE IN FORMULATION
K. Swaroopa Rani*, V. Rajani, K. Madhuri, K. Siva Jagan Mohan, G. Girish Kumar, G. Ankal Reddy, K. Srinivasulu
SKU College of Pharmaceutical Sciences, SK University, Anantapuramu-515003, India
*Corresponding author E-mail: [email protected]
ARTICLE INFO ABSTRACT
Key Words
Succinyl choline chloride,
Bromothymol blue, Colorimetry, Validation.
A simple and new colorimetric method was developed for the estimation of succinyl choline chloride. The proposed colorimetric method is based on the reaction between succinyl choline chloride and bromothymol blue reagent, followed by colour complex formation. Parameters affecting the reaction were studied and conditions were optimized. The absorption maximum for the colour complex was observed at 450 nm. Linearity was obtained in the concentration range of 70-600 µg/ml for succinyl choline chloride colour complex. The developed method was optimised and validated. The method was successfully applied for the estimation of succinyl choline chloride in bulk and in injection.
1. INTRODUCTION
A quaternary skeletal muscle relaxant usually used in the form of its bromide, chloride, or iodide. It is a depolarizing relaxant, acting in about 30 seconds and with duration of effect averaging three to five minutes. Succinylcholine is used in surgical, anesthetic, and other procedures in which a brief period of muscle relaxation. It is very essential to know the quality of the drug in order to prevent the harmful effects of the drug on the human body. In view of that point a new colorimetric method was developed and validated to estimate succinyl choline chloride in formulation. Literature survey revealed no method was developed with
bromo thymol blue reagent.1, 2
Figure 1. Structure of succinyl choline chloride
2. MATERIALS AND METHODS Succinyl choline chloride is procured
from Sequent scientific limited,
Mangalore. Bromo thymol blue is from S.S Chemicals, Anantapuramu. Distilled water is obtained from Double distillation
unit within the Institution. All
An Elsevier Indexed Journal ISSN-2230-7346
4439 measurements were made with Elico CL
157 Colorimeter.
2.1 Method Development involves the Following steps
2.1.1. Solvent selection: Solubility studies were conducted to the succinyl choline
chloride with various solvents1. It was
found that succinyl choline chloride was freely soluble in distilled water.3,4
2.1.2. Preparation of standard stock solution
Standard succinyl choline chloride of 100 mg was weighed and transformed to a 100ml volumetric flask and dissolved in 25ml of distilled water. The flask was shaken and volume was make upto the mark with distilled water to give a solution
containing 1000µg/ml (Stock solution).5,6
2.1.3. Selection of reagent
Reagent was selected based on the chemical structure. According to the functional groups in the structure, reagent was selected. Linearity of the drug was checked with various reagents like
dragendorffs reagent, sodium nitrite,
bromo thymol blue. There is good linearity
of drug with bromo thymol blue. 7
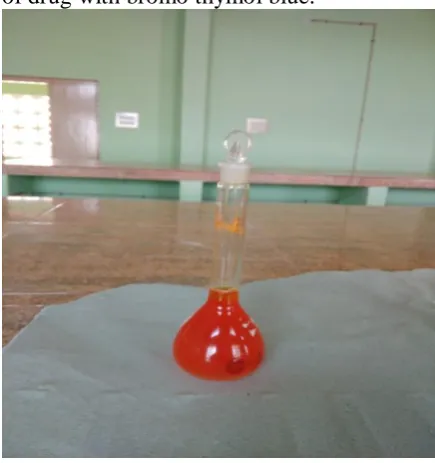
Figure 2. 2% Bromo thymol reagent
2.1.4. Determination of maximum absorbance wavelength of 10 µg/ml
colour complex
Stock solution of succinyl choline chloride was further diluted with distilled
water to get concentrations of 10 µg/ml
and 2 ml of reagent was added. Absorbance was checked at various wavelengths and it was found that 450 nm is the maximum absorbance wavelength.
2.1.5. Selection of concentration of reagent
Various trails were made with 0.1, 0.2, 0.4, 1, 2% reagent with drug solution. Better linearity was obtained with 2% reagent.
2.1.6. Effect of time on the linearity of the colour complex
The colour of the drug solution with reagent was stable up to 15 min after that the colour degrades. At 15 min there is
good linearity of coloured complex.8
2.1.7. Effect of volume of reagent on the linearity of colour complex
Linearity of coloured complex was measured with different volumes of reagent. It was found that with 2 ml of reagent linearity of coloured complex is good.
2.1.8. Selection of analytical concentration range: From standard stock solution of succinyl choline chloride,
working standard solutions of
concentrations from 70-600µg/ml were prepared. Absorbance for these solutions was measured at 450nm. These concentrations showed linear values.
2.1.9. Construction of Calibration Curve: From standard succinyl choline chloride stock solution along with reagent
concentrations of
4440 Table 1: Linearity of succinyl choline chloride
S.No Conc(µg/ml) Absorbance ±SD %RSD
1 70 0.08 ± 0.0052 1.90
2 80 0.13 ± 0.0041 1.97
3 90 0.18± 0.0058 0.87
4 100 0.27± 0.005 1.82
5 200 0.56± 0.0065 1.34
6 300 0.81± 0.0082 0.895
7 400 1.11± 0.0075 0.98
8 500 1.38± 0.0049 0.096
9 600 1.62±0.0072 1.53
Table 2. Selection of Reagent
S.No Reagent R²
1 Dragendorffs 0.920
2 Sodium nitrite 0.963
3 Bromo thymol blue 0.999
Table 3. Selection of concentration of reagent
S.No Concentration of Reagent R²
1 0.1% 0.981
2 0.2% 0.962
3 0.4% 0.995
4 1% 0.997
5 2% 0.999
Table 4. Effect of time on the linearity of colour complex
S.No Time (min) R²
1 0 0.981
2 5 0.985
3 10 0.992
4 15 0.999
5 20 0.995
Table 5. Effect of volume of reagent on the linearity of colour complex
S.No Volume (ml) R²
1 1 0.981
2 2 0.999
4441 Table 6. Regression and Analytical parameters
S.No Parameter Result
1 Maximum absorbance wavelength
(nm)
450
2 Molar absorptivity(mol/l) 0.0027
3 Range (µg/ml) 70-600
4 Sandell’s sensitivity(µg/cm2) 0.37
5 Limit of detection (µg/ml) 8.25
6 Limit if quantification (µg/ml) 25
7 Regression equation Y = 0.002x + 0.007
8 Slope 0.002
9 Intercept 0.007
10 Correlation coefficient 0.999
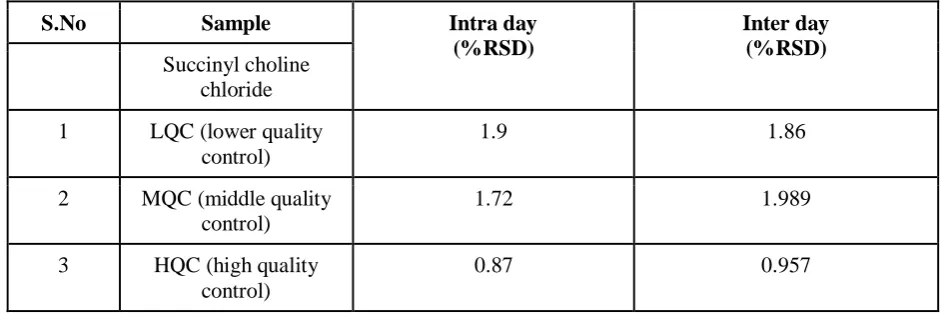
Table 7. Precision studies of succinyl choline chloride
S.No Sample Intra day
(%RSD)
Inter day (%RSD) Succinyl choline
chloride
1 LQC (lower quality control)
1.9 1.86
2 MQC (middle quality control)
1.72 1.989
3 HQC (high quality control)
0.87 0.957
Table 8. Recovery Studies
S.NO Name of the drug
Amount of sample(µg/ml)
Recovery level
Amount of drug added (µg/ml)
Total amount found(µg/ml) ± SD
%Recovery %RSD
1 Succinyl choline chloride
200 80%
100% 120%
160
200 240
356.5±0.9 411.5±0.7 431.5±0.51
99.02 102.8 98.06
1.04 1.81 1.55
Table 9. Assay Studies
S.No Drug Lable claim Amount
found
%Recovery %RSD
1 succinyl
choline chloride
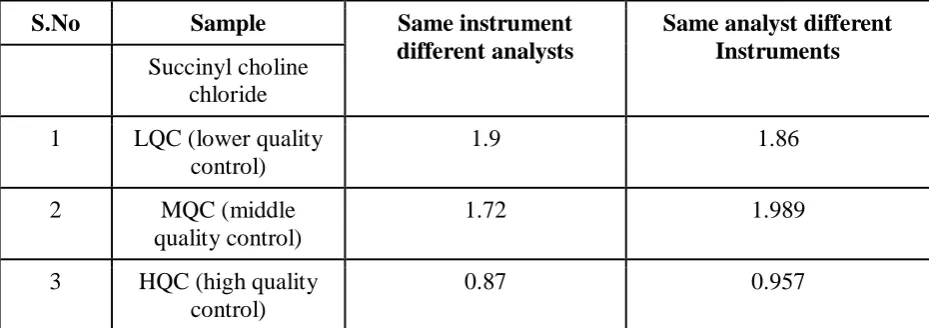
4442 Table 10. Ruggedness
S.No Sample Same instrument
different analysts
Same analyst different Instruments Succinyl choline
chloride
1 LQC (lower quality
control)
1.9 1.86
2 MQC (middle
quality control)
1.72 1.989
3 HQC (high quality
control)
0.87 0.957
From those absorbance values, calibration
curve was constructed. Regression
equation and correlation coefficient (R2)
are determined.
2.2. Assay: Label claim of succinyl choline chloride injection is 200 mg/10 ml.
Drug equivalent to 200 µg/ml was taken
from injection. Its absorbance was noted at 450 nm. Amount of drug in the injection
was calculated from regression equation. 9
2.3. Method Validation: The method validation was performed in terms of linearity, LOQ, LOD, Precision, accuracy, and ruggedness. 10,11
2.3.1. Linearity: From standard stock solution of succinyl choline chloride,
working standard solutions of
concentrations from 70-600µg/ml were prepared. These concentrations showed linear values.
2.3.2. Precision
Precision of methods was studied as intraday and inter day. Precision was performed by analysing three different concentration of drug like LQC, MQC, and HQC.
2.3.3. Accuracy: The accuracy of the proposed methods was assessed by recovery studies at three different levels i.e., 80%, 100%, 120%.
2.3.4. Limit of detection (LOD): The limit of Detection was found by formula method. LOD=3.3σ/slope, where σ is standard deviation.
2.3.5. Limit of Quantification (LOQ): The limit of quantification was found by formula method. LOQ= 10 σ/slope, where σ is standard deviation. 5
2.3.6. Ruggedness: Absorbance values were taken by two analysts with the same instrument and with the two instruments by the same analyst.
4. DISCUSSION
The selected succinyl choline chloride was estimated by colorimetry. Bromo thymol blue was selected as the coloring reagent. The method was validated for all
validation parameters as per ICH
guidelines. The linearity range for succinyl
choline chloride was 70-600µg/ml with R2
4443 5. ACKNOWLEDGEMENTS
We would like to thank Sequent scientific limited, Mangalore for providing gift sample and we would also like to thank SKU College of Pharmaceutical Sciences, Department of Pharmaceutical Analysis, for continuous support and providing the necessary facilities.
REFERENCES
1. https://www.drugbank.ca/drugs/DB
00202
2. Mykola Blazheyevskiy and
Lyubomyr Kryskiw, Kinetic
Spectrophotometric method for the determination of Suxamethonium Chloride; Chemistry & Chemical Technology, 9 (3), 2015, 261-265
3. Priyadarsini, Development and
validation of colorimetric methods for the determination of Ritonavir in tablets; Int. J. Chem. Sci.: 8(1), 2010, 711-715.
4. Ganesh Kumar, Development and
Validation of a Novel Colorimetric Method for the Estimation of Emtricitabine in Bulk and Tablet Formulation. Indian J Pharm Sci 2016;78(6):775-779
5. Braun. Reprint. Croatia: Pharma
med Press; 2006. Introduction to instrument analysis; 2–7.
6. Armitage P, Berry /sG. Statistical
Methods in Medical Research. 3rd ed. Oxford, UK; Blackwell:1994.
7. Bassett, Denny RC, Jeffry GH,
Mandham. Vogel’s Text book of
quantitative inorganic analysis.
1986.
8. Carr GP, Wahlich JC. A practical
approach to method validation in pharmaceutical analysis. J.Pharm. Biomed. Anal, 86, 1990, 613-614.
9. A.H. Beckett, J.B.Stenlake,
Practical Pharmaceutical
Chemistry, Fourth Edition –Part two, CBS Publications, 286-288.
10.ICH, Q2 (R1), Validation of
analytical procedures: Text and
methodology, International
Conference on Harmonization,
IFPMA, Geneva, 2005
11.International Conference on
Harmonization (ICH) of Technical Requirements for the Registration of Pharmaceuticals for Human use,
Validation of analytical
procedures: Methodology, adopted in 1996, Geneva
12.Sethi PD. Quantitative analysis of
drugs in pharmaceutical