ISSN:2278 7496
FORMULATION DEVELOPMENT AND EVALUATION OF FLOATING MICROSPHERE OF
TRAZODONE HYDROCHLORIDE
Ritu Bhati*1, Girijesh Kumar Pandey1, Amit Joshi1, B.K. Dubey1, Salaj Khare1, Prabhat Jain2
1Technocrats Institute of Technology-Pharmacy Education and Research, Bhopal (M.P.)
2 Scan Research laboratories Bhopal (M.P.)
*Corresponding Author’s E mail: [email protected]
Received 22 Nov. 2018; Revised 30 Nov. 2018; Accepted 17 Dec. 2018, Available online 15 Jan. 2019.
ABSTRACT
Trazodone hydrochloride (TRZ), a serotonin reuptake inhibitor antidepressant. TRZ undergoes first pass metabolism on oral administration resulting in reduced bioavailability (60%). Gastro retentive dosage forms have potential for use as controlled- release drug delivery systems. Gastro retentive floating drug delivery systems have a bulk density lower than that of gastric fluids and thus increase residence time of drug in stomach and provide controlled delivery of many drugs. The present study involves preparation and evaluation of floating microspheres using Trazodone hydrochloride (TRZ) as a model drug for improving the drug bioavailability by prolongation of gastric retention time. Ethyl cellulose, hydroxyl propyl methyl cellulose microspheres loaded with TRZ were prepared by solvent diffusion evaporation method. The microspheres had smooth surfaces with free-flowing and good-packing properties. The yield of the microspheres was up to 85.65±0.62 % and ethyl cellulose microspheres entrapped the maximum amount of the drug. Scanning electron microscopy confirmed their hollow structures with sizes in 178.5 nm. The prepared microspheres exhibited prolonged drug release and Percentage buoyancy was found to 73.98±0.65. The formulated batches were evaluated for percentage yield, particle size measurement, flow properties, percent entrapment efficiency, swelling studies. The formulations were subjected to stability studies and In-vitro release and release kinetics data was subjected to different dissolution models. It was concluded that developed floating microspheres of TRZ offers a suitable and practical approach for prolonged release of drug over an extended period of time and thus oral bioavailability, efficacy and patient compliance is improved.
Keywords: Solvent diffusion evaporation method, Trazodone hydrochloride, Ethyl cellulose, Hydroxyl propyl methyl cellulose.
INTRODUCTION:
The hepatitis C virus (HCV) is a flavivirus with 6 major genotypes that currently infects approximately 150 million people worldwide 1. Untreated chronic HCV infection often leads to progressive liver fibrosis and cirrhosis with the potential for hepatic decompensation and/or hepatocellular carcinoma. Globally, nearly half a million people die annually from liver disease related to chronic HCV infection 2. Providentially, HCV is curable. The first available treatment regimen was prolonged interferon based therapy, first without and later with ribavirin, which was associated with substantial side effects and a relatively low rate of cure 3. The first direct-acting antiviral agents (DAAs) were approved in 2011 in the form of two protease inhibitors, telaprevir and boceprevir, each combined with pegylated interferon and
simple technique which avoids the use of complex apparatus and special precautions based on a slight modification of the ionic gelation method using Na-TPP as the crosslinking agent.
MATERIALS AND METHODS
Materials
Sofosbuvir was obtained as free gift sample from Aurobindo Pharma Ltd; Excipients used were Chitosan from Himedia, Mumbai. Glacial acetic acids were purchased from Merck; Sodium tripolyphosphate was purchased from Loba chemi pvt Ltd (Mumbai, India). All other chemicals and reagent used were of analytical grade. Ultrapure water was used throughout the study.
Preparation of mucoadhesive microspheres
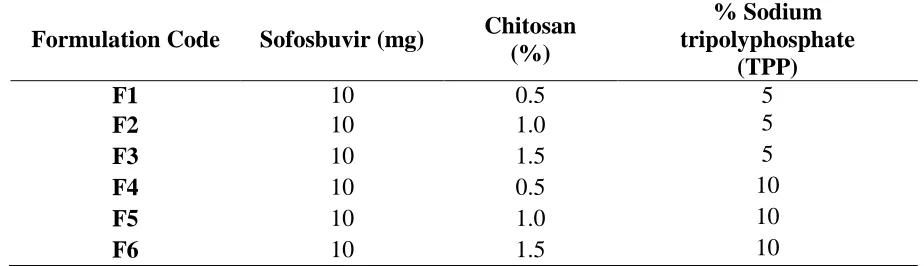
Chitosan solution of 0.5 to 1.5% wt/vol concentration was prepared in acetic acid using homogenizer (Remi motors, Mumbai) at 5000rpm for about 30 minutes. then drug was added to chitosan solution. Microspheres were formed by dropping the bubble-free dispersion of chitosan –drug solution through a disposable syringe (10 ml) onto a gently stirrer (100 rpm) at room temperature in 5% or 10% wt/vol (Sodium tripolyphosphate) TPP solution add Glutaraldehyde as cross linking agent 21. Chitosan microspheres were separated after 2 hours by filtration and rinsed with distilled water and then they were vacuum dried. The composition of formulations given in table 1.
Table 1: Formulations of the mucoadhesive microspheres
Formulation Code Sofosbuvir (mg) Chitosan
(%)
% Sodium tripolyphosphate
(TPP)
F1 10 0.5 5
F2 10 1.0 5
F3 10 1.5 5
F4 10 0.5 10
F5 10 1.0 10
F6 10 1.5 10
Evaluation of microspheres
Percentage yield
The prepared microspheres with a size range of 200-300nm were collected and weighed from different formulations. The measured weight was divided by the total amount of all non-volatile components which were used for the preparation of the microspheres.
% 𝐘𝐢𝐞𝐥𝐝 = 𝐀𝐜𝐭𝐮𝐚𝐥 𝐰𝐞𝐢𝐠𝐡𝐭 𝐨𝐟 𝐩𝐫𝐨𝐝𝐮𝐜𝐭
FTIR spectroscopic analysis
FT-IR spectroscopic studies of Sofosbuvir (pure drug), chitosan (polymer), blank (unloaded) microspheres and Sofosbuvir loaded chitosan microspheres were done by recording the respective FT-IR spectra in a JASCO, Model 4200 Spectrophotometer (Japan) over a wave number range of 400 – 4000 cm-1.
Drug entrapment
The various formulations of the mucoadhesive microspheres were subjected for drug content. 10 mg of mucoadhesive microspheres from all batches were accurately weighed and crushed. The powder of microspheres was dissolved in 10 ml 0.1 N HCl and centrifuge at 1000 rpm. This supernatant solution is than filtered through whatmann filter paper No. 44. After filtration, from this solution 0.1 ml was taken out and diluted up to 10 ml with 0.1 N HCl. The percentage drug entrapment was calculated using calibration curve method.
Measurement of mean particle size
The mean size of the microspheres was determined by Photo Correlation Spectroscopy (PCS) on a submicron particle size analyzer (Horiba Instruments) at a scattering angle of 90°. A sample (0.5mg) of the microspheres suspended in 5 ml of distilled water was used for the measurement 22.
Determination of zeta potential
The zeta potential of the drug-loaded microspheres was measured on a zeta sizer (Horiba Instruments) by determining the electrophoretic mobility in a micro electrophoresis flow cell. All the samples were measured in water at 25°C in triplicate.
Shape and Surface characterization of microspheres by scanning electron microscopy (SEM)
From the formulated batches of microspheres, formulations (F4) which showed a suitable balance among the percentage releases were examined for surface morphology and shape using scanning electron microscope Jeol Japan 6000. Sample was fixed on carbon tape and fine gold sputtering was practical in a high vacuum evaporator. The acceleration voltage was set at 10KV during scanning. Microphotographs were taken on dissimilar magnification and higher magnification (200X) was used for surface morphology 23.
In-vitro release studies
samples analyzed spectrophotometrically at 264 nm to determine the concentration of drug present in the dissolution medium 24.
RESULTS AND DISCUSSION
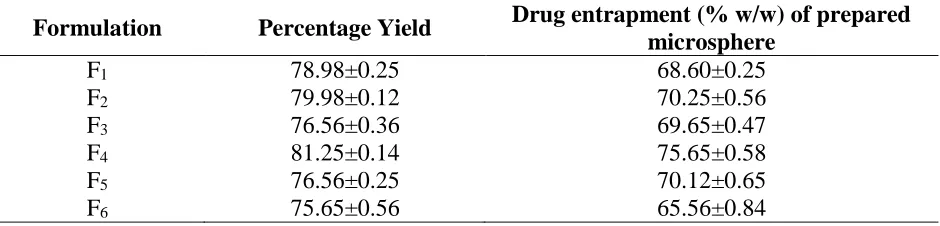
Percentage yield of different formulation was determined by weighing the microspheres after drying. The percentage yield of different formulation was in range of 75.65– 81.25%. The drug entrapment efficacies of different formulations were in range of 65.56- 75.65% w/w. This is due to the mucoadhesion characteristics of chitosan that could facilitate the diffusion of part of entrapped drug to surrounding medium during preparation of sofosbuvir microspheres Table 2. On the basis of the maximum percentage yield and drug entrapment was found to be formulation F4 in mucoadhesive microspheres so formulation F4 was further studies. The results of measurement of mean particle size of optimized formulation F4 of mucoadhesive microsphere was found 178.5.
Table 2 Percentage yield and drug entrapment for different formulation
Formulation Percentage Yield Drug entrapment (% w/w) of prepared
microsphere
F1 78.98±0.25 68.60±0.25
F2 79.98±0.12 70.25±0.56
F3 76.56±0.36 69.65±0.47
F4 81.25±0.14 75.65±0.58
F5 76.56±0.25 70.12±0.65
F6 75.65±0.56 65.56±0.84
Results of zeta potential of optimized formulation F4 of mucoadhesive microsphere was found -33.6mV.
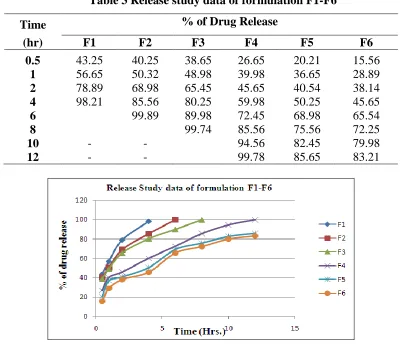
Table 3 Release study data of formulation F1-F6
Time % of Drug Release
(hr) F1 F2 F3 F4 F5 F6
0.5 43.25 40.25 38.65 26.65 20.21 15.56
1 56.65 50.32 48.98 39.98 36.65 28.89
2 78.89 68.98 65.45 45.65 40.54 38.14
4 98.21 85.56 80.25 59.98 50.25 45.65
6 99.89 89.98 72.45 68.98 65.54
8 99.74 85.56 75.56 72.25
10 - - 94.56 82.45 79.98
12 - - 99.78 85.65 83.21
Fig.1 Graph of release study of formulation F1-F6
Table 4 Release kinetics of optimized formulation of microsphere F4
Time (h)
Square Root of
Time(h)1/2
Log Time
Cumulative % Drug
Release
Log Cumulati
ve % Drug Released
Cumulativ e % Drug Remaining
Log Cumulative
% Drug Remaining
0.5 0.707 -0.301 26.65 1.426 73.35 1.865
1 1 0 39.98 1.602 60.02 1.778
2 1.414 0.301 45.65 1.659 54.35 1.735
4 2 0.602 59.98 1.778 40.02 1.602
6 2.449 0.778 72.45 1.860 27.55 1.440
8 2.828 0.903 85.56 1.932 14.44 1.160
10 3.162 1 94.56 1.976 5.44 0.736
Fig 3 Zero order release kinetics graph Fig. 3 First order release kinetics graph
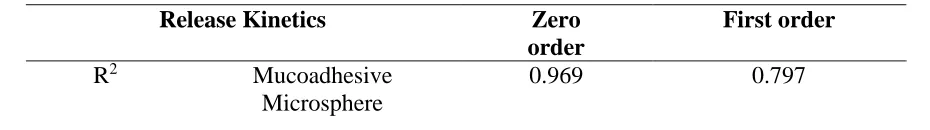
The In vitro drug release data of the optimized formulation was subjected to goodness of fit test by linear
regression analysis according to zero order, first order kinetic equation, in order to determine the mechanism of drug release. When the regression coefficient values were compared, it was observed that ‘r’ values of microsphere were maximum zero order i.e 0.969 hence indicating drug release from formulations was follow zero order Table 5.
Table 5 Comparative study of regression coefficient for selection of optimized Formulation F4
Release Kinetics Zero
order
First order
R2 Mucoadhesive
Microsphere
0.969 0.797
According to ICH guidelines, 3 months accelerated stability study at 40±2°c and 75±5% RH optimized formulations (F4) was carried out. It showed negligible change over time for parameters like appearance, drug content, dissolution and assay etc., No significant difference observed in the drug content between initial and formulations stored at 40±2°c & 75±5% RH for 3 months.
CONCLUSION
were prepared by ionic gelation using Na-TPP as the crosslinking agent. The in vitro dissolution study results indicated formulation F4 found to be the best formulation with controlled release of the drug over a period of 12 hours. The drug release from the microspheres followed zero order kinetics .The results of all studies have been shown to be satisfactory Thus, Chitosan-TPP based release formulations are an attractive alternative to traditional drug delivery systems.
REFERENCES
1. Shardendu P, Bhandari A, Mishra R and Sharma PK. Development and optimization of floating microspheres of gliclazide. International Journal of Pharma Sciences and Research. 2015; 6(5): 807- 817.
2. Jain NK. Progress in controlled and novel drug delivery systems. CBS Publishers and distributors. 2013; 2: 79-86.
3. Seth PR and Tossounian J. The hydrodynamically balanced system HBSTM: A novel drug delivery system for oral use, Drug Dev. Ind. Pharm. 1984;10:313–339.
4. Moes AJ. Gastroretentive dosage forms, Crit. Rev. Ther. Drug Carrier Syst. 1993;10:143–195. 5. Deshpande AA, Rhodes CT, Shah NH and Malick AW. Controlled-release drug delivery systems for
prolonged gastric residence: an overview, Drug Dev. Ind. Pharm. 1996;22:531–539.
6. Whitehead L, Fell JT, Collett JH, Sharma HL and Smith AM. Floating dosage forms: an in vivo study demonstrating prolonged gastric retention. J. Control. Rel. 1998; 55: 3–12.
7. Alukder R and Fassihi R. Gastroretentive delivery systems: a mini review, Drug Dev. Ind. Pharm. 2004; 30: 1019–1028.
8. Rouge N, Leroux JC, Cole ET, Doelker E and Buri P. Prevention of the sticking tendency of floatingminitablets filled into hard gelatin capsule. Eur. J. Pharm. Biopharm. 1997; 43: 165–171.
9. Sato Y, Kawashima Y, Takeuchi H and Yamamoto H. In vivo evaluation of riboflavin-containing microballoons for floating controlled drug delivery system in healthy human volunteers, J. Control. Rel. 2003; 93: 39–47.
10.Kawashima Y, Niwa T, Takechi H, Hino T and Itoh Y. Hollow microspheres for use as floating controlled drug delivery systems in the stomach, J. Pharm. Sci. 1992; 81: 135–140.
11.Soppimath KS, Kulkarni AR, Rudzinski WE and Aminabhavi TM. Microspheres as floating drug-delivery systems to increase gastric retention of drugs, Drug Metab. Rev. 2002; 33: 149–160.
13.Thanoo BC, Sunny MC and Jayakrishnan A. Oral sustained-release drug delivery systems using polycarbonate microspheres capable of floating on the gastric fluid, J. Pharm. Pharmacol. 1993; 45: 21– 24.
14.Joseph NJ, Lakshmi S and Jayakrishnan A. A floating-type oral dosage form for piroxicam based on hollow polycarbonate microspheres: in vitro and in vivo evaluation in rabbits, J. Control. Rel. 2002; 79: 71–79. 15.Stithit S, Chen W and Price JC. Development and characterization of buoyant theophylline microspheres
with near zero order release kinetics, J. Microencaps. 1998;15: 725–737.
16.Lee JH, Park TG and Choi HK. Development of oral drug delivery system using floating 11 microspheres. J. Microencaps. 1999; 16: 715–729.
17.Tanwar YS, Naruka PS and Ojha GR. Development and evaluation of floating microspheres of verapamil hydrochloride. Brazilian Journal of Pharmaceutical Sciences. 2007; 434: 529-534.