InTrans Project Reports Institute for Transportation
8-2014
Optimizing Pavement Base, Subbase, and Subgrade
Layers for Cost and Performance of Local Roads
David J. White
Iowa State University, [email protected]
Pavana Vennapusa [email protected]
Follow this and additional works at:http://lib.dr.iastate.edu/intrans_reports
Part of theCivil and Environmental Engineering Commons
This Report is brought to you for free and open access by the Institute for Transportation at Iowa State University Digital Repository. It has been accepted for inclusion in InTrans Project Reports by an authorized administrator of Iowa State University Digital Repository. For more information, please [email protected].
Recommended Citation
White, David J. and Vennapusa, Pavana, "Optimizing Pavement Base, Subbase, and Subgrade Layers for Cost and Performance of
Local Roads" (2014).InTrans Project Reports. 76.
Optimizing Pavement Base, Subbase, and Subgrade Layers for Cost and
Performance of Local Roads
Abstract
This report is one of two products for this project with the other being a design guide. This report describes test results and comparative analysis from 16 different portland cement concrete (PCC) pavement sites on local city and county roads in Iowa. At each site the surface conditions of the pavement (i.e., crack survey) and foundation layer strength, stiffness, and hydraulic conductivity properties were documented. The field test results were used to calculate in situ parameters used in pavement design per SUDAS and AASHTO (1993) design methodologies. Overall, the results of this study demonstrate how in situ and lab testing can be used to assess the support conditions and design values for pavement foundation layers and how the measurements compare to the assumed design values. The measurements show that in Iowa, a wide range of pavement conditions and foundation layer support values exist. The calculated design input values for the test sites (modulus of subgrade reaction, coefficient of drainage, and loss of support) were found to be different than typically assumed. This finding was true for the full range of materials tested. The findings of this study support the recommendation to incorporate field testing as part of the process to field verify pavement design values and to consider the foundation as a design element in the pavement system. Recommendations are provided in the form of a simple matrix for alternative foundation treatment options if the existing foundation materials do not meet the design intent. The PCI prediction model developed from multi-variate analysis in this study demonstrated a link between pavement foundation conditions and PCI. The model analysis shows that by measuring properties of the pavement foundation, the engineer will be able to predict long term performance with higher reliability than by considering age alone. This prediction can be used as motivation to then control the engineering properties of the pavement foundation for new or re-constructed PCC pavements to achieve some desired level of performance (i.e., PCI) with time.
Keywords
Drainage, Falling weight deflectometers, Low volume roads, Coefficient of subgrade reaction, Pavement performance, Portland cement concrete, PCC
Disciplines
Civil and Environmental Engineering
Comments
Optimizing Pavement Base, Subbase,
and Subgrade Layers for Cost and
Performance on Local Roads
AUGUST 2014
Final Field Data Report
Sponsored by
About the Center for Earthworks Engineering Research
The mission of the Center for Earthworks Engineering Research (CEER) at Iowa State University is to be the nation’s premier institution for developing fundamental knowledge of earth
mechanics, and creating innovative technologies, sensors, and systems to enable rapid, high quality, environmentally friendly, and economical construction of roadways, aviation runways, railroad embankments, dams, structural foundations, fortifications constructed from earth materials, and related geotechnical applications.
About the National Concrete Pavement Technology Center
The mission of the National Concrete Pavement Technology (National CP Tech) Center is to unite key transportation stakeholders around the central goal of advancing concrete pavement technology through research, tech transfer, and technology implementation.Disclaimer Notice
The contents of this report reflect the views of the authors, who are responsible for the facts and the accuracy of the information presented herein. The opinions, findings and conclusions expressed in this publication are those of the authors and not necessarily those of the sponsors.
The sponsors assume no liability for the contents or use of the information contained in this document. This report does not constitute a standard, specification, or regulation.
The sponsors do not endorse products or manufacturers. Trademarks or manufacturers’ names appear in this report only because they are considered essential to the objective of the document.
ISU Non-Discrimination Statement
Iowa State University does not discriminate on the basis of race, color, age, ethnicity, religion, national origin, pregnancy, sexual orientation, gender identity, genetic information, sex, marital status, disability, or status as a U.S. veteran. Inquiries regarding non-discrimination policies may be directed to Office of Equal Opportunity, Title IX/ADA Coordinator, and Affirmative Action Officer, 3350 Beardshear Hall, Ames, Iowa 50011, 515-294-7612, email [email protected].
Iowa Department of Transportation Statements
Federal and state laws prohibit employment and/or public accommodation discrimination on the basis of age, color, creed, disability, gender identity, national origin, pregnancy, race, religion, sex, sexual orientation or veteran’s status. If you believe you have been discriminated against, please contact the Iowa Civil Rights Commission at 800-457-4416 or the Iowa Department of Transportation affirmative action officer. If you need accommodations because of a disability to access the Iowa Department of Transportation’s services, contact the agency’s affirmative action officer at 800-262-0003.
Technical Report Documentation Page
1. Report No. 2. Government Accession No. 3. Recipient’s Catalog No.
IHRB Project TR-640
4. Title and Subtitle 5. Report Date
Optimizing Pavement Base, Subbase, and Subgrade Layers for Cost and Performance of Local Roads
August 2014
6. Performing Organization Code
7. Author(s) 8. Performing Organization Report No.
David White and Pavana Vennapusa InTrans Project 11-422
9. Performing Organization Name and Address 10. Work Unit No. (TRAIS)
Concrete Pavement Technology Center and Center for Earthworks Engineering Research Iowa State University
2711 South Loop Drive, Suite 4600 Ames, IA 50010-8664
11. Contract or Grant No.
12. Sponsoring Organization Name and Address 13. Type of Report and Period Covered
Iowa Highway Research Board Iowa Department of Transportation 800 Lincoln Way
Ames, IA 50010
Final Field Data Report
14. Sponsoring Agency Code
IHRB Project TR-640
15. Supplementary Notes
Visit www.ceer.iastate.edu for color PDFs of this and other research reports.
16. Abstract
This report is one of two products for this project with the other being a design guide.
This report describes test results and comparative analysis from 16 different portland cement concrete (PCC) pavement sites on local city and county roads in Iowa. At each site the surface conditions of the pavement (i.e., crack survey) and foundation layer strength, stiffness, and hydraulic conductivity properties were documented. The field test results were used to calculate in situ parameters used in pavement design per SUDAS and AASHTO (1993) design methodologies. Overall, the results of this study demonstrate how in situ and lab testing can be used to assess the support conditions and design values for pavement foundation layers and how the measurements compare to the assumed design values.
The measurements show that in Iowa, a wide range of pavement conditions and foundation layer support values exist. The calculated design input values for the test sites (modulus of subgrade reaction, coefficient of drainage, and loss of support) were found to be different than typically assumed. This finding was true for the full range of materials tested. The findings of this study support the recommendation to incorporate field testing as part of the process to field verify pavement design values and to consider the foundation as a design element in the pavement system. Recommendations are provided in the form of a simple matrix for alternative foundation treatment options if the existing foundation materials do not meet the design intent.
The PCI prediction model developed from multi-variate analysis in this study demonstrated a link between pavement foundation conditions and PCI. The model analysis shows that by measuring properties of the pavement foundation, the engineer will be able to predict long term performance with higher reliability than by considering age alone. This prediction can be used as motivation to then control the engineering properties of the pavement foundation for new or re-constructed PCC pavements to achieve some desired level of performance (i.e., PCI) with time.
17. Key Words 18. Distribution Statement
drainage—falling weight deflectometer—low volume roads—modulus of subgrade reaction—pavement performance—PCC pavements
No restrictions.
19. Security Classification (of this report)
20. Security Classification (of this page)
21. No. of Pages 22. Price
O
PTIMIZING
P
AVEMENT
B
ASE
,
S
UBBASE
,
AND
S
UBGRADE
L
AYERS FOR
C
OST AND
P
ERFORMANCE OF
L
OCAL
R
OADS
Final Field Data Report August 2014 Principal Investigator
Tom Cackler, P.E., Director Concrete Pavement Technology Center
Co-Principal Investigators
David J. White, Ph.D., P.E., Associate Professor and Director Center for Earthworks Engineering Research
Halil Ceylan, Ph.D., Associate Professor
Civil, Construction and Envirnomental Engineering, Iowa State University
Research Team Members
Jerod Gross, Paul Wiegand, Dale Harrington, Pavana Vennapusa
Authors
David White and Pavana Vennapusa
Sponsored by
Iowa Department of Transportation and Iowa Highway Research Board
(IHRB Project TR-640)
Preparation of this report was financed in part
through funds provided by the Iowa Department of Transportation through its Research Management agreement with the
Institute for Transportation (InTrans Project 11-422)
A report from
Center for Earthworks Engineering Research and Concrete Pavement Technology Center
Iowa State University
2711 South Loop Drive, Suite 4600, Ames, IA 50010-8664 Phone: 515-294-7910 Fax: 515-294-0467
TABLE OF CONTENTS
GLOSSARY OF TERMS ...xv
ACKNOWLEDGMENTS ... xvii
EXECUTIVE SUMMARY ... xix
CHAPTER 1: INTRODUCTION ...1
Overview ...1
Report Organization ...2
CHAPTER 2: BACKGROUND ...3
HR-175 – Experimental Macadam Stone Base ...3
HR-209 – Pavement Surface on Macadam Base – Adair County ...3
HR312 – Low Cost Techniques of Base Stabilization...4
TR-482 – Determination of the optimum base characteristics for pavements ...5
TR-461 – Soil stabilization of non-uniform subgrade soils ...8
TR-554 – Performance evaluation of concrete pavement granular subbase ...9
TR-495 – Field evaluation of compaction monitoring technology ...11
TR-503 Utility cut repair techniques ...11
CHAPTER 3: EXPERIMENTAL TESTING ...14
Experimental Plan ...14
Laboratory Test Methods ...15
In Situ Testing Methods ...17
Estimation of Foundation Layer Design Input Parameters ...27
CHAPTER 4: MATERIALS ...44
CHAPTER 5: FIELD TEST RESULTS ...61
NW 3rd St. and Greenwood Drive, Ankeny, Polk County ...62
NW 5th and Greenwood Drive, Ankeny, Polk County ...66
E63, Story County ...70
Riverside Road, Ames, Story County ...77
E23, Story County ...84
SW Westlawn Drive, Ankeny, Polk County ...90
SW Logan St., Ankeny, Polk County ...97
West Main Street, Knoxville...102
South 5th Street, Knoxville ...108
Valley View Drive, Council Bluffs ...113
9th Avenue, Council Bluffs ...118
Cliff Road (Site A), Burlington ...123
Cliff Road (Site B), Burlington ...129
Meadowbrook Drive, Burlington ...135
W38/Locust Road, Winneshiek County ...140
CHAPTER 6: ANALYSIS OF RESULTS ...153
Load Transfer Efficiency ...161
Composite Modulus of Subgrade Reaction and Loss of Support ...161
Permeability Measurements and Coefficient of Drainage ...162
Statistical Analysis ...168
CHAPTER 7: SUMMARY OF KEY FINDINGS...172
CHAPTER 8: RECOMMENDATIONS...174
REFERENCES ...177
APPENDIX A: LABORATORY TEST RESULTS...181
APPENDIX B: FIELD NOTES ...225
APPENDIX C: DCP RAW DATA ...241
APPENDIX D: FWD RAW DATA ...343
APPENDIX E: CHP RAW DATA ...403
LIST OF FIGURES
Figure 1. Relationship between in-situ saturated hydraulic conductivity (from air permeability
tests) and percent passing no. 200 sieve (from Vennapusa et al. 2006) ...6
Figure 2. Visual indication of aggregate segregation following trimming and compaction operations on a recycled PCC material on I35 in Hamilton County, Iowa...7
Figure 3. Kriged contour plots of in-situ test measurements from a site on US151 near Cedar Rapids, Iowa (reproduced from White et al. 2004a) ...7
Figure 4. Contour plots of principal stresses and deflections under uniform and non-uniform subgrade conditions (from White et al. 2005b) ...9
Figure 5. Variations in PCI with age on PCC pavement sections with (a) virgin aggregate subbase, and (b) RPCC subbase...10
Figure 6. CAT compaction monitoring system components (White et al. 2004b) ...11
Figure 7. Experimental plan developed for field testing and sampling ...14
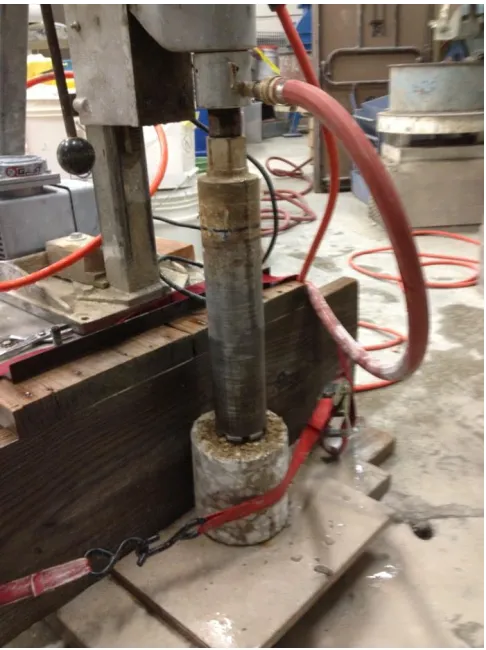
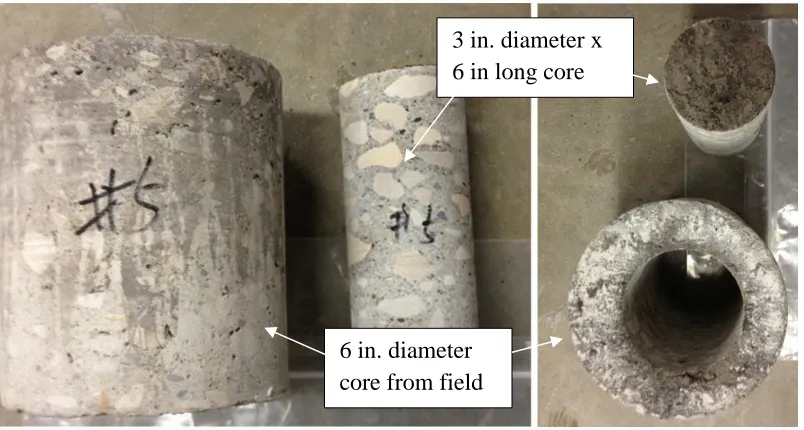
Figure 8. Picture of coring 3 in. cores from field 6 in. cores ...16
Figure 9. Pictures of field 6 in. cores and 3 in. cores ...17
Figure 10. KUAB falling weight deflectometer ...18
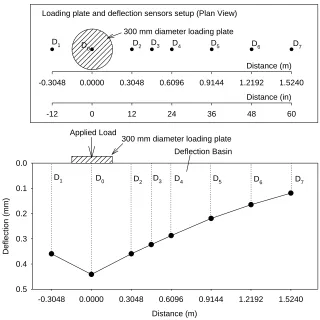
Figure 11. FWD plate and sensor setup (top), and typical deflection basin (bottom) ...18
Figure 12. FWD test at a joint for LTE determination ...19
Figure 13. Void detection using load-deflection data from FWD test ...19
Figure 14. Static kPLT values versus Dynamic kFWD measurements reported in literature ...22
Figure 15. Relationships between Static k values determined from FWD and PLT, and CBR from literature ...23
Figure 16. Dynamic cone penetrometer test ...24
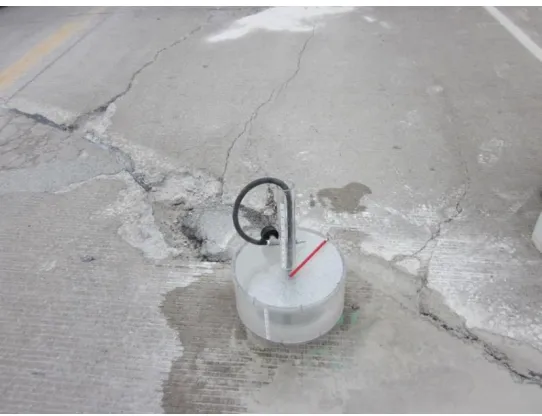
Figure 17. Core hole permeameter (CHP) device and components. ...25
Figure 18. Core hore permeability testing in situ ...26
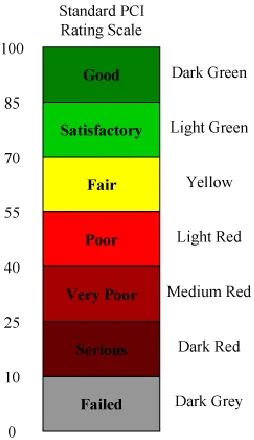
Figure 19. PCI rating scale used in PAVERTM 6.5 ...27
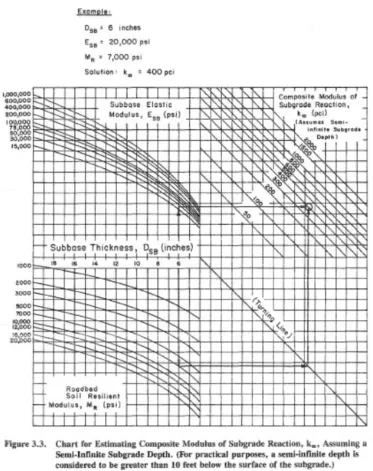
Figure 20. Chart for estimating composite modulus of subgrade reaction (kcomp) assuming a semi-infinite subgrade depth (from AASHTO 1993) ...30
Figure 21. Chart to estimate modulus of subbase layer (ESB) from CBR (from AASHTO 1993) 31 Figure 22. Slab and support conditions defining loss of support factors (from AASHTO 1986) .32 Figure 23. Chart for estimating adjusted or effective modulus of subgrade reaction (modified from AASHTO 1993) ...33
Figure 24. Typical cross-section showing drainage system in a PCC pavement (reproduced from Moulton, 1980) ...35
Figure 25. Relationship between width of drainage layer and time for 50% drainage ...37
Figure 26. Empirical relationships between KSat measured and KSat predicted from empirical models (reproduced from Zapata and Houston 2008) ...38
Figure 28. Frost susceptibility of soils (Joint Departments of Army and Air Force 1985) ...40
Figure 29. (a) Subgrade sample at w = 7.6% from NW 3rd St. and Greenwood Dr., Ankeny, (b)
subgrade sample at w = 20.1% from NW 5rd St. and Greenwood Dr., Ankeny, (c)
subgrade sample at w = 8.7% from E63, Story County, (d) subgrade sample at w = 17.7%
from E63, Story County, (e) subbase sample from Riverside Road, Ames, (f) subgrade
sample at w = 16.7%from E23, Story County ...52
Figure 30. (a) Subbase sample from SW Westlawn Dr., Ankeny (b) subgrade sample at w = 12%
from SW Westlawn Dr., Ankeny, (c) Subbase sample from SW Logan St., Ankeny, (d)
subgrade sample at w = 15.2% from SW Logan St., Ankeny, (e) Subbase sample from
West Main St., Knoxville, and (f) Subbase sample from South 5th St., Knoxville...53
Figure 31. (a) Subbase (crushed limestone) sample (b) subbase (crushed PCC) sample, (c)
subgrade sample from Core # 1 at w = 14.4%, and (d) subgrade sample from Core # 12 at
w = 14.1% from Valley View Dr., and (e) stabilized subgrade sample at air dry moisture
content and (f) subgrade sample at air dry moisture content from 9th Ave., Council Bluffs54
Figure 32. (a) Subbase sample from Cliff Rd (Site A), (b) subgrade sample at w = 18.6% from
Cliff Rd (Site A), (c) Subbase sample from Cliff Rd (Site B), (d) subgrade sample at w =
28.9% from Cliff Rd (Site B), and (e) subbase sample from Meadowbrook Dr., and (b)
subgrade sample at w = 14.8% from Meadowbrook Dr., Burlington ...55
Figure 33. (a) Subbase sample from W38 Locust Rd., (b) Macadam subbase sample (Core#1) from W38 Locust Rd., (c) Macadam subbase sample (Core#2) from W38 Locust Rd., and
(d) subgrade sample at w = 11.3% from 175th Street, Winneshiek County ...56
Figure 34. Particle size distribution curves of subgrade and subbase materials ...57
Figure 35. Relationship between corrected (for finite slab size) and uncorrected Static k values
determined from FWD tests ...62
Figure 36. Photographs of field test site during testing — NW 3rd Street and Greenwood Drive,
Ankeny ...63 Figure 37. FWD test results — NW3rd Street and Greenwood Drive, Ankeny ...64 Figure 38. DCP-CBR and cumulative blows with depth profiles — NW3rd Street and
Greenwood Drive, Ankeny ...65
Figure 39. Comparison of kFWD-Corr and CBR of foundation layers — NW3rd Street and
Greenwood Drive, Ankeny ...65 Figure 40. CHP test results — NW3rd Street and Greenwood Drive, Ankeny ...66
Figure 41. Photographs of field test site during testing — NW 5th Street and Greenwood Drive,
Ankeny ...67
Figure 42. FWD test results — NW5th Street and Greenwood Drive, Ankeny ...68
Figure 43. DCP-CBR and cumulative blows with depth profiles — NW5th Street and Greenwood
Drive, Ankeny ...69
Figure 44. Comparison of kFWD-Corr and CBR of foundation layers — NW5th Street and
Greenwood Drive, Ankeny ...69
Figure 46. Photographs of field test site during testing — E63, Story County ...72
Figure 47. Crack Survey Map — E63, Story County ...73
Figure 48. FWD test results — E63, Story County ...74
Figure 49. DCP-CBR and cumulative blows with depth profiles — E63, Story County ...75
Figure 50. Comparison of kFWD-Corr and CBR of foundation layers — E63, Story County ...75
Figure 51. CHP test results — E63, Story County ...76
Figure 52. Photographs of good panel with CHP#1 test (left) and cracked panel with CHP#2 test (right) — E63, Story County ...76
Figure 53. Photographs of field test site during testing — Riverside Road, Ames ...78
Figure 54. Crack Survey Map — Riverside Road, Ames ...79
Figure 55. FWD test results — Riverside Road, Ames ...80
Figure 56. DCP-CBR and cumulative blows with depth profiles — Riverside Road, Ames...81
Figure 57. Comparison of kFWD-Corr and CBR of foundation layers — Riverside Road, Ames ...81
Figure 58. CHP test results — Riverside Road, Ames ...82
Figure 59. Photographs of good panel with CHP#1 test (left) and cracked panel with CHP#2 test (right) —Riverside Road, Ames ...82
Figure 60. Photographs of panel # 4 with mid-panel transverse crack during testing (top on June 7, 2012) and after patching (bottom on June 10, 2013)—Riverside Road, Ames ...83
Figure 61. Photographs of field test site during testing — E23, Story County ...85
Figure 62. Crack Survey Map — E23, Story County ...86
Figure 63. FWD test results — E23, Story County ...87
Figure 64. DCP-CBR and cumulative blows with depth profiles — Riverside Road, Ames...88
Figure 65. Comparison of kFWD-Corr and CBR of foundation layers — E23, Story County ...88
Figure 66. CHP test results — E23, Story County ...89
Figure 67. Photographs of good panel with CHP#1 test (left) and cracked panel with CHP#2 test (right) — E23, Story County ...89
Figure 68. Photographs of field test site during testing — SW Westlawn Drive, Ankeny ...91
Figure 69. Crack Survey Map — SW Westlawn Drive, Ankeny ...92
Figure 70. FWD test results — SW Westlawn Drive, Ankeny ...93
Figure 71. DCP-CBR and cumulative blows with depth profiles — SW Westlawn Drive, Ankeny94 Figure 72. Comparison of kFWD-Corr and CBR of foundation layers — SW Westlawn Drive, Ankeny ...95
Figure 73. CHP test results — SW Westlawn Drive, Ankeny...95
Figure 74. Photos during construction and testing in 2008 — SW Westlawn Drive, Ankeny ...96
Figure 75. Comparison between 2008 DCP-CBR profiles and 2012 DCP-CBR profiles — SW Westlawn Drive, Ankeny ...97
Figure 76. Photographs of field test site during testing — SW Logan Street, Ankeny ...99
Figure 77. FWD test results — SW Logan Street, Ankeny ...100 Figure 78. DCP-CBR and cumulative blows with depth profiles — SW Logan Street, Ankeny101
Figure 80. CHP test results — SW Logan Street, Ankeny ...102
Figure 81. Photographs of field test site during testing — West Main Street, Knoxville ...104
Figure 82. Crack Survey Map — West Main Street, Knoxville ...105
Figure 83. FWD test results — West Main Street, Knoxville ...106
Figure 84. DCP-CBR and cumulative blows with depth profiles — West Main Street, Knoxville107 Figure 85. Comparison of kFWD-Corr and CBR of foundation layers — West Main Street, Knoxville...107
Figure 86. CHP test results — West Main Street, Knoxville ...108
Figure 87. Photographs of field test site during testing — South 5th Street, Knoxville ...109
Figure 88. Crack Survey Map — South 5th Street, Knoxville ...110
Figure 89. FWD test results — South 5th Street, Knoxville ...111
Figure 90. DCP-CBR and cumulative blows with depth profiles — South 5th Street, Knoxville112 Figure 91. Comparison of kFWD-Corr and CBR of foundation layers — South 5th Street, Knoxville112 Figure 92. CHP test results — South 5th Street, Knoxville...113
Figure 93. Photographs of field test site during testing — Valley View Drive, Council Bluffs .114 Figure 94. Crack Survey Map — Valley View Drive, Council Bluffs ...115
Figure 95. FWD test results — Valley View Drive, Council Bluffs ...116
Figure 96. DCP-CBR and cumulative blows with depth profiles — Valley View Drive, Council Bluffs...117
Figure 97. Comparison of kFWD-Corr and CBR of foundation layers — Valley View Drive, Council Bluffs...117
Figure 98. CHP test results — Valley View Drive, Council Bluffs ...118
Figure 99. Photographs of field test site during testing — 9th Avenue, Council Bluffs ...119
Figure 100. Crack Survey Map — 9th Avenue, Council Bluffs ...120
Figure 101. FWD test results — 9th Avenue, Council Bluffs ...121
Figure 102. DCP-CBR and cumulative blows with depth profiles — 9th Avenue, Council Bluffs122 Figure 103. Comparison of kFWD-Corr and CBR of foundation layers — 9th Avenue, Council Bluffs122 Figure 104. CHP test results — 9th Avenue, Council Bluffs ...123
Figure 105. Photographs of field test site during testing — Cliff Road (Site A), Burlington ...125
Figure 106. Crack Survey Map — Cliff Road (Site A), Burlington ...126
Figure 107. FWD test results — Cliff Road (Site A), Burlington ...127
Figure 108. DCP-CBR and cumulative blows with depth profiles — Cliff Road (Site A), Burlington ...128
Figure 109. Comparison of kFWD-Corr and CBR of foundation layers — Cliff Road (Site A), Burlington ...128
Figure 110. CHP test results — Cliff Road (Site A), Burlington ...129
Figure 111. Photographs of field test site during testing — Cliff Road (Site B), Burlington ...131
Figure 112. Crack Survey Map — Cliff Road (Site B), Burlington ...132
Burlington ...134
Figure 115. Comparison of kFWD-Corr and CBR of foundation layers — Cliff Road (Site B), Burlington ...134
Figure 116. CHP test results — Cliff Road (Site B), Burlington ...135
Figure 117. Photographs of field test site during testing — Meadowbrook Drive, Burlington ..136
Figure 118. Crack Survey Map — Meadowbrook Drive, Burlington ...137
Figure 119. FWD test results — Meadowbrook Drive, Burlington ...138
Figure 120. DCP-CBR and cumulative blows with depth profiles — Meadowbrook Drive, Burlington ...139
Figure 121. Comparison of kFWD-Corr and CBR of foundation layers — Meadowbrook Drive, Burlington ...139
Figure 122. CHP test results — Meadowbrook Drive, Burlington...140
Figure 123. Photographs of field test site during testing — W38/Locust Road, Winneshiek County ...142
Figure 124. FWD test results — W38/Locust Road, Winneshiek County ...143
Figure 125. DCP-CBR and cumulative blows with depth profiles — W38/Locust Road, Winneshiek County ...144
Figure 126. Comparison of kFWD-Corr and CBR of foundation layers — W38/Locust Road, Winneshiek County ...144
Figure 127. CHP test results — W38/Locust Road, Winneshiek County ...145
Figure 128. Photographs of field test site during testing — 175th Street, Winneshiek County ...147
Figure 129. Photographs of new patching areas — 175th Street, Winneshiek County ...148
Figure 130. Crack Survey Map — 175th Street, Winneshiek County ...149
Figure 131. FWD test results — 175th Street, Winneshiek County ...150
Figure 132. DCP-CBR and cumulative blows with depth profiles — 175th Street, Winneshiek County ...151
Figure 133. Comparison of kFWD-Corr and CBR of foundation layers — 175th Street, Winneshiek County ...151
Figure 134. CHP test results — 175th Street, Winneshiek County ...152
Figure 135. Average Static kFWD-Corr versus average CBRSG (average from each site) in comparison with relationships published in the literature ...154
Figure 136. Determination of average CBR of top 12 in. of subgrade and CBR of the “weak” layer within the subgrade ...155
Figure 137. Average Static kFWD-Corr versus average CBRSG-Weak Layer (average from each site) in comparison with relationships published in the literature ...156
Figure 138. Boxplots of Static kcomp-FWD-Corr and kcomp-DCP values for different foundation layer support conditions ...163
Figure 139. Boxplots of CBR of subgrade and subbase layers observed at different sites ...164
Figure 140. ...165
Figure 141. Static kcomp-FWD-Corr versus kcomp-DCPWeak (bottom) based on average values from each
site in relationship with loss of support ...166
Figure 142. Measured KCHP versus predicted Ksat in comparison with data used in empirical models from Zapata and Houston (2008) ...167
Figure 143. KCHP values measured for different foundation layer support materials ...167
Figure 144. Cd values observed for different foundation layer support materials ...168
Figure 145. Summary of multi-variate analysis results ...170
LIST OF TABLES
Table 1. Summary of experimental plan and link to PCC design and cost analysis...15
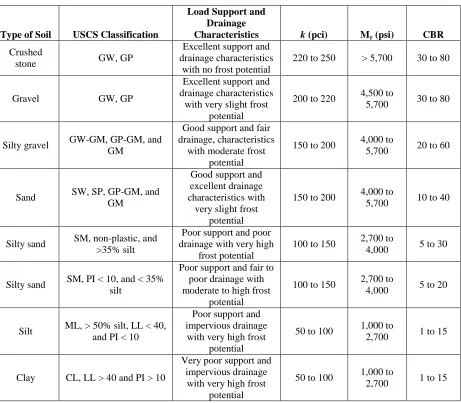
Table 2. Relative ratings of subbase and subgrade layers based on CBR values (SUDAS 2013a)24 Table 3. Typical ranges of k, Mr, and CBR for various soil types (SUDAS 2013a) ...28
Table 4. Typical ranges of LS factors for different types of materials (AASHTO 1993) ...32
Table 5. AASHTO (1993) drainage quality rating ...34
Table 6. Recommended values of Cd for PCC pavement design (AASHTO 1993) ...34
Table 7. Summary of typical effective porosity values ...36
Table 8. Summary of frost susceptibility rating and frost groups of various materials (Chamberlain 1981) ...41
Table 9. Summary of frost-heave and thaw-weakening tests performed on unstabilized materials according to ASTM D5918 (Johnson 2012) ...42
Table 10. Summary of frost-heave and thaw-weakening tests performed on cement and fly ash stabilized loess according to ASTM D5918 (Johnson 2012)...43
Table 11. Uniformity rating pavement support conditions (developed for this study) ...43
Table 12. Summary of laboratory test results ...45
Table 13. Summary of laboratory test results (contd.) ...46
Table 14. Summary of laboratory test results (contd.) ...47
Table 15. Summary of laboratory test results (contd.) ...48
Table 16. Summary of laboratory test results (contd.) ...49
Table 17. Summary of laboratory test results (contd.) ...50
Table 18. Summary of laboratory test results (contd.) ...51
Table 19. Summary of frost-heave susceptibility ratings ...58
Table 20. Summary of estimated saturated hydraulic conductivity values ...59
Table 21. Summary of PCC core compressive strength test results ...60
Table 22. Summary of field test sites...61
Table 23. Summary of field test results ...157
Table 23. Summary of field test results (Contd.) ...158
Table 23. Summary of field test results (Contd.) ...159
Table 23. Summary of field test results (Contd.) ...160
Table 24. In situ testing for pavement foundation layer characterization ...175
GLOSSARY OF TERMS
a, b, c Regression coefficients
a1 Factor used in CHP data calculations depending on the depth to impermeable
layer
AADT Annual average daily traffic
AASHTO American Association of State Highway and Transportation Officials
AREA4 Parameter determined from FWD deflection basin using data from 4 sensors
b1 Thickness of the tested layer during CHP test
Cd Coefficient of drainage
CL Low plasticity clay (or lean clay)
CH High plasticity clay (or fat clay)
CBR California bearing ratio
CBRSG California bearing ratio of subgrade (averaged over the top 12 in. of subgrade)
CBRSG-Weak California bearing ratio of subgrade (averaged over a minimum 3 in. “weak” layer within the top 16 in. of subgrade)
CBRSB California bearing ratio of subbase (averaged over thickness of the subbase
layer)
CHP Core hole permeameter
d Effective inside diameter of standpipe (in CHP test)
d1 Inside diameter of bottom casing (in CHP test)
Dynamic kFWD Dynamic modulus of subgrade reaction determined from FWD test
D0 Deflection under FWD load at plate center
D0* Non-dimensional deflection coefficient
D1 Deflection under FWD load at 12 in. away from plate center (on adjacent slab)
D2 Deflection under FWD load at 12 in. away from plate center
D4 Deflection under FWD load at 24 in. away from plate center
D5 Deflection under FWD load at 36 in. away from plate center
DCP Dynamic cone penetrometer
DPI Dynamic penetration index
E Excellent (rating)
ESB Elastic modulus of subbase determined from CBRSB
F Fair (rating)
G Good (rating)
FWD Falling weight deflectometer
H Subbase layer thickness
H1 Effective head at time t1 (during CHP test)
H2 Effective head at time t2 (during CHP test)
I Intercept
k Modulus of subgrade reaction
kPLT Modulus of subgrade reaction determined from static plate load test
kFWD Modulus of subgrade reaction determined from FWD test
kcomp Composite modulus of subgrade reaction (determined based on Mr, ESB, and
H)
kcomp-DCP Composite modulus of subgrade reaction (determined based on Mr estimated
kcomp-DCP-Weak Composite modulus of subgrade reaction (determined based on Mr estimated
from CBRSG-Weak, ESB estimated from CBRSB, and H)
kcomp-FWD-Corr Static modulus of subgrade reaction determined from FWD test that is
corrected for slab size and converted to composite value based on Mr estimated
from Static kFWD-Corr, ESB estimated from CBRSB, and H
K Saturated hydraulic conductivity
KCHP Saturated hydraulic conductivity determined from CHP test
L Radius of relative stiffness
L′ Slab size (smaller dimension of a rectangular slab, length of width)
LOS Loss of support
LTE Load transfer efficiency
Mr Resilient modulus of subgrade
P Applied load by FWD
P Poor (rating)
PCI Pavement condition index
PCC Portland cement concrete
PLT Plate load test
RPCC Recycled portland cement concrete
Rt Ratio of kinematic viscosity of permeant at temperature during time increment
t1 to t2 to that of water at temperature (T) 68oF (20oC)
SUDAS State urban design and specifications
Static kFWD Static modulus of subgrade reaction determined from FWD test (which is
equivalent to ½ of Dynamic kFWD)
Static kFWD-Corr Static modulus of subgrade reaction determined from FWD test that is
corrected for slab size
T Temperature
QC Quality control
QA Quality assurance
VG Very good (rating)
VP Very poor (rating)
ACKNOWLEDGMENTS
This project is sponsored by the Iowa Highway Research Board and the Iowa Department of Transportation. Tom Cackler, P.E., Director of the National Concrete Pavement Technology (National CP Tech) Center is the Principal Investigator (PI) on the project. Dr. David White, P.E., Director of Center for Earthworks Engineering Research (CEER) and Dr. Halil Ceylan of the Concrete Pavement Technology (CPTech) Center are Co-PIs on the project. Paul Weigand, P.E., Director of the Iowa Statewide Urban Design and Specifications (SUDAS), Dale
Harrington, P.E., Principal Senior Engineer at Snyder and Associates, Inc., Jerod Gross, P.E., of Snyder and Associates, Inc., and Dr. Pavana Vennapusa of CEER are research team members on the project.
EXECUTIVE SUMMARY
This field data report presents results from field forensic investigation conducted at 16 different portland cement concrete (PCC) pavement sites on local city and county roads in Iowa. This report is one of two products for this project with the other being a design guide.
The test sites are located in Polk and Story Counties in central Iowa, Marion and Des Moines Counties in southeast Iowa, Pottawattamie County in Western Iowa, and Winneshiek County in northeast Iowa. The sites tested varied in:
a) pavement age from about 30 days to 42 years,
b) surface distress conditions from “poor” to “excellent” (PCI values from 35 to 100),
c) type of support conditions from directly supported over natural subgrade to fly ash
stabilized subgrade to 12 in. thick granular subbase materials,
d) pavement thickness from 6 to 11 in, and
e) annual average daily traffic (AADT) from 110 to 8900.
The main objectives of field testing included documenting the surface conditions of the pavement (i.e., crack survey) and characterizing the foundation layer strength, stiffness, and hydraulic conductivity properties. The field test results were used to calculate in situ parameters used in rigid pavement design per current Iowa State Urban Design and Specifications (SUDAS) and AASHTO (1993) design methodologies. Test samples of the foundation layers were
obtained from each sites to characterize their laboratory index properties. PCC core samples were obtained to determine compressive strengths.
The foundation layer design input parameters determined from field testing include:
a) Modulus of subgrade reaction (k),
b) Composite modulus of subgrade reaction (if subbase layer is present) (kc),
c) Loss of support (LOS) , and
d) Coefficient of drainage (Cd).
Parameters (a) to (c) were determined using falling weight deflectometer (FWD) and dynamic cone penetrometer (DCP) tests, and parameter (d) was determined using a newly developed core
hole permeameter (CHP) test device. FWD tests provided a measure of subgrade k values
(hereafter, referred to as kFWD). The kFWD values determined from this study were corrected for
slab size and dynamic effects and reported as Static kFWD-Corr values. DCP tests were used to
empirically estimate the modulus of subgrade and subbase layers, and the graphically determine
the composite modulus of subgrade reaction kcomp values (hereafter, referred to as kcomp-DCP), per
AASHTO (1993) guidelines. kcomp values were also determined from Static kFWD-Corr values using
subbase layer modulus estimated from DCP tests and the AASHTO (1993) graphical procedure
and are reported as Static kcomp-FWD-Corr. Loss of support under pavements was evaluated based on
FWD testing using the concept of zero load intercept, and also by comparing the kcomp values
of support that is existing under pavements at the time of testing, but the DCP tests do not because only properties of individual layers are used in the calculation.
CHP tests were conducted to determine in situ hydraulic conductivity (KCHP) values. The Cd
values were determined by estimating the time of drainage using the KCHP values, pavement
geometry (i.e., width and cross slope), and effective porosity of the drainage layer material.
In addition to these design input parameters, frost-heave susceptibility classification of the foundation materials was determined.
Previous research indicated that uniformity of pavement support conditions plays a critical role in long-term performance of PCC pavements (White et al. 2004). Uniformity of pavement support conditions was also evaluated in this study based on FWD test results. A uniformity classification matrix was developed to compare results from each site.
Overall, the results of this study demonstrate how in situ and lab testing can be used to assess the support conditions and design values for pavement foundation layers. The measurements show that in Iowa, a wide range of pavement conditions and foundation layer support values exist. The calculated design input (modulus of subgrade reaction, coefficient of drainage, and loss of support) values are different than typically assumed. This finding was true for the full range of materials tested. This finding supports the recommendation to incorporate field testing as part of the process to field verify the selected pavement design values.
A summary of key analysis results obtained from all field sites are as follows:
The joint LTE at 13 out of the 15 sites showed an average of ≥ 92% at the joints,
irrespective of the foundation layer conditions. The remaining three projects showed average LTE < 50%.
It is found that modulus of subgrade reaction values determined from FWD test (Static
kFWD-Corr) correlate well with subgrade layer CBR, when the weakest layer CBR within
the top 16 in. of subgrade (CBRSG-Weak) is used. These correlations are also in line with
the data published previously by the U.S. Army Corps of Engineers (Barker and Alexander 2012), Thornton (1983), and Darter et al. (1995). There is significant
variability in the k versus CBR relationships, however.
Composite k values determined that account for subbase layer modulus and thickness
based on FWD tests (Static kcomp-FWD-Corr) were on average about 0.9 to 6.2 times lower
than the values determined from DCP test results using CBRSG-Weak (kcomp-DCP-Weak).
The kcomp-DCP-Weak values do not account for LOS under the pavement in situ, while the kcomp-FWD-Corr values do as the measurement is directly on the pavement. The LOS values back-calculated by comparing the averages (per site) of these values ranged from about 0.7 to 1.7. These LOS values are higher than the values currently suggested in the SUDAS design procedures (1 for natural subgrade and 0 for granular subbase). For sections with granular subbase, the LOS values ranged from 0.7 to 1.3.
On average, the kcomp-FWD-Corr and kcomp-DCP values increased with increasing subbase layer
contributed to LOS and lower kcomp-FWD-Corr values. The W38/Locust Rd. section with 12 in. of granular subbase (3 in. of subbase and 9 in. of macadam subbase) showed the
highest kcomp-FWD-Corr and kcomp-DCP values.
In situ hydraulic conductivity measurements (KCHP) values measured for the seven
different foundation layer support categories did not show improvement in Cd values with
increasing subbase layer thickness and were generally lower than suggested for design in
SUDAS (Cd = 1.0 for natural subgrade and 1.1 when granular subbase is present).
Multi-variate statistical analysis performed on various parameters measured during this
study revealed that improving subgrade strength/stiffness (within about the top 16 in. of the subgrade layer), improving drainage, providing a subbase layer, and reducing variability, can contribute to increasing the PCI value. Subgrade layer properties can be improved by stabilization, drainage can be improved by the presence of a relatively thin drainable subbase layer (note that subbase layer thickness was not statistically
significant), and variability can be reduced by adequate in situ testing. Some
recommendations regarding these aspects are provided in Chapter 8. The PCI prediction model developed from this analysis is based on limited data (16 sites), and must be validated with a larger pool of data.
Recommendations from this study include the following:
The field investigation demonstrates that there can be several factors that affect pavement foundation performance include at least the following:
a. Poor support (due to low stiffness or CBR)
b. Poor drainage
c. Seasonal variations (freeze-thaw and frost-heave)
d. Shrink-swell due to moisture variations
e. Loss of support (due to erosion, non-uniform settlement, curling/warping)
f. Poorly compacted utility trench backfill
g. Differential settlement of foundation layers
h. Overall non-uniformity
Characterization of these problems can be determined from in situ testing. Options for field testing are summarized.
CHAPTER 1: INTRODUCTION
It is common for local street and road pavements to be constructed using Portland Cement Concrete (PCC) directly supported on natural subgrade without considering subgrade treatment or structural support layers such as granular subbase. In order to optimize the performance of concrete pavement, it is critical to understand how the support layers can be designed and
constructed to provide the most economical life cycle cost of the pavement system and minimize public funds expenditures on local roads.
Overview
To improve the understanding between PCC pavement performance and foundation support conditions, 16 different test sites on local city and county roads in Iowa were tested. Natural subgrades, stabilized (with fly ash) subgrades, and granular subbases (with thicknesses varying from about 3.5 in. to 12 in. were tested. Pavement condition, surface deflections, support layer stiffness and support layer drainage were studied at each site. Results from this field testing is documented in this report. These results will be used to develop a companion design guide.
The field test results were used to calculate in situ parameters that are linked to rigid pavement design parameters per SUDAS and AASHTO (1993) design methodologies. The foundation layer design input parameters that are determined from field testing include:
a) Modulus of subgrade reaction (k),
b) Composite modulus of subgrade reaction (if subbase layer is present) (kcomp),
c) Loss of support (LOS), and
d) Coefficient of drainage (Cd).
Parameters (a) to (c) were determined using falling weight deflectometer (FWD) and dynamic cone penetrometer (DCP) tests, and parameter (d) was determined using a newly developed core
hole permeameter (CHP) test device. FWD tests provided a measure of subgrade k values
(hereafter, referred to as kFWD). The kFWD values determined from this study were corrected for
slab size and dynamic effects and reported as Static kFWD-Corr values. DCP tests were used to
empirically estimate the modulus of subgrade and subbase layers, and the graphically determine
the kcomp values (hereafter, referred to as kcomp-DCP), per AASHTO (1993) guidelines. kcomp values
were also determined from Static kFWD-Corr values using subbase layer modulus estimated from
DCP tests and the AASHTO (1993) graphical procedure and are reported as Static kcomp-FWD-Corr.
Loss of support under pavements was evaluated based on FWD testing using the concept of zero
load intercept, and also by comparing the kcomp values determined from FWD and DCP tests. It is
assumed that the FWD tests take into account the loss of support that is existing under pavements at the time of testing, but the DCP tests do not (because only properties of individual layers are
used in the calculation). CHP tests were used to determine in situ hydraulic conductivity (KCHP)
values. The Cd values were determined by estimating the time of drainage using the KCHP values,
Report Organization
This report contains seven chapters. Chapter 2 summarizes key references pertinent to this research project. Chapter 3 provides information regarding the experimental plan developed for field testing, field and laboratory test methods used in this study, and procedures followed to estimate the pavement design input parameters, Chapter 4 provides material properties of the samples collected from the field sties, Chapter 5 provides results from the field test sites, Chapter 6 provides the results of analysis based on results from all field test sites, Chapter 7 provides a summary of key findings from this study, and Chapter 8 provides a summary of
recommendations with a catalogue of options to improve foundation layer support conditions under PCC pavements for local roads. Notes taken during field testing and raw field and laboratory test results are provided in Appendices A to F included at the end of this report.
CHAPTER 2: BACKGROUND
The Iowa Highway Research Board has sponsored several recent studies on pavement foundation layer soil stabilization and characteristics. A few key projects along with other key relevant references are listed below:
Experimental Macadam Stone Base – Des Moines County (HR-175) – Less and Paulson
(1977)
Pavement Surface on Macadam Base – Adair County (HR-209) – Lynam and Jones
(1979)
Low Cost Techniques of Base Stabilization (HR-312) – Jobgen et al. (1994)
Determination of the optimum base characteristics for pavements (TR-482) – White et
al. (2004a)
Soil stabilization of non-uniform subgrade soils (TR-461) – White et al. (2004c,
2005a,b)
Performance evaluation of concrete pavement granular subbase (TR-554) – White et al.
(2008)
Field evaluation of compaction monitoring technology: Phases I and II (TR-495) –
White et al. (2004b, 2005c, 2006)
Utility cut repair techniques – Investigation of improve cut repair techniques to reduce
settlement of repaired areas (TR-503) – Schaefer et al. (2005)
Key findings and conclusions (relevant to this research project) from the projects/references listed above are summarized in the following sections of this chapter.
HR-175 – Experimental Macadam Stone Base
The IHRB HR-175 research project (Less and Paulson 1977) evaluated the feasibility and economics of using macadam subbase material (with different thicknesses) with choke stone under PCC and asphalt pavements. The macadam subbase material used on this project had a typical gradation with 4 in. maximum particle size and 12 to 26% passing the 1 in. sieve. The choke stone had a typical gradation with 1 in. maximum particle size and 6 to 12% passing the No. 200 sieve. The study indicated that the macadam subbase performed well under both PCC and asphalt pavements, but the cost was relatively more. During construction, the finished macadam subbase showed a uniform structure with negligible amount of degradation during compaction. Production rates on placement of the macadam subbase material varied from about 2900 to 5000 tons per day. Lateral subdrain trenches backfilled with porous backfill was used on this project for drainage. This system performed well and minimized effects of frost boils, spring thaw, and other subsurface drainage issues.
HR-209 – Pavement Surface on Macadam Base – Adair County
maximum particle size and < 1% passing the #8 sieve. Field testing was conducted using Road Rater testing and visual crack/distress surveys. Some key findings from this study were as follows:
Road Rater testing indicated that the structural rating of a PCC pavement is improved if
macadam subbase is used under the pavement. However, the improvement structural rating from using 5 in. of macadam subbase is equivalent to about additional ½ or ¾ in. PCC. The macadam subbase served primarily as a drainage layer and therefore could be reduced to 3.5 to 4 in. thickness instead of 5 in. Asphalt treating the macadam stone could be of additional benefit for stability of the base.
2 to 3 in. thick PCC pavements over 5 in. macadam subbase showed poor performance
and low structural rating. It is indicated that a minimum 5.5 in. PCC pavement is required over macadam to obtain 20 year design life.
Macadam served as a good drainage layer and prevented D-cracking on PCC pavements
(within the 5 years of evaluation), which was a common problem in the area with using Class 1 aggregate (which contained fines).
Significant allowance should be made for material overruns when placing either PCC or
asphalt pavement on macadam without chokestone (215 cubic yards per mile for PCC).
The quarry must be in close proximity for the project (within 10 to 20 miles) for
macadam stone base to be economically practical.
HR312 – Low Cost Techniques of Base Stabilization
The IHRB HR-312 research project (Jobgen et al. 1994) evaluated performance of four different stabilization methods for on unsurfaced roads. These stabilization methods included using:
a) high float emulsion (HFE-300) to treat top 3 in. of base stone,
b) a bio-chemical formula called as BIO CAT 300-1 to treat the base stone for different
thicknesses (6 in., 8in., and 10 in.),
c) Consolid System method in the top 10 in. of subgrade soil, wherein when the soil is dry a
combination of two inverted emulsions are used and when the soil is wet a combination of an inverted emulsion and a lime hydrated base powder are used to treat the base stone, and
d) 5 in. of macadam base and 2 in. of choke stone along with fabric under one of the
sections
All test sections were sealed using a double seal coat and performance evaluation was conducted on these sections using Iowa Road Rater, Roughometer, and visual inspection annually from 1989 to 1992. Some key findings from the field testing were as follows:
Test sections stabilized with BIO CAT300-1 and Consolid system showed the highest
Although the BIO CAT 300-1 and Consolid System stabilized sections showed high k-values, they showed poor performance with alligator cracking and rutting under traffic, and continued deterioration every year. It is speculated in the report that these failures could have been due to freeze/thaw cycles in the stabilized layers.
HFE-300 treated test sections showed some deterioration with alligator cracking.
Macadam subbase test sections (with and without fabric) experienced minor rutting and showed the best overall performance than all other sections. The use of fabric did not show noticeable improvement.
Use of macadam base and HFE-300 treatment showed cost effectiveness than other
treatment options evaluated in this study.
TR-482 – Determination of the optimum base characteristics for pavements
The IHRB TR-482 research project (White et al. 2004a) included a wide range of activities to evaluate relationships between stability and permeability of granular base course layers. Those activities included reviewing literature, development of a new in-situ testing device to measure permeability, considerable field testing, analysis, construction observations, development of recommended quality assurance/quality control (QA/QC) protocols, and development of recommendations for improving construction operations and design procedures. Some key findings and conclusions are as follows:
The amount of fines content (passing No. 200 sieve) is a key factor influencing
permeability. Lab and field measurements showed that as fines content increases, the permeability decreases dramatically (Figure 1).
Stability is enhanced by aggregate angularity, particles resistance to degradation, and
having a dense gradation (dense gradation that does not separate large particles). In some cases a dense gradation can enhance stability and reduce permeability. It is important to note that many high density materials can be unstable; therefore, density measurements are likely to be of little use in a base course QA/QC program.
Recycled concrete aggregate samples were found to have lower permeability, lower
strength, and lower resistance to particle degradation compared to limestone and gravel samples tested. It is indicated that the use of this material as a drainable base course under high volume pavements need to be further evaluated.
Drainage is affected by subgrade cross-slope; base thickness; edge drain placement;
material gradation; and the permeability of the material. A computer program (Pavement
Drainage Estimator, PDE) was developed to help designers quickly explore several alternatives for improving base drainage.
In developing a QA/QC specification, it is desirable to set testing limits that will provide
an adequate “factor of safety” between the desired material properties and the average test results. Test protocols and engineering properties that produce more variation should have a larger “factor of safety.”
Permeability measurements exhibited the most variation and therefore need to have the
DCP, Clegg Impact Hammer and GeoGauge were used for assessment of base layer stability. A target CBR of 15% was selected for in-place stability of Iowa DOT granular subbase materials (under high volume roads). To achieve this target a maximum DCP Index of 0.55 in./blow (14 mm/blow), a minimum Clegg Impact Value of 20, and a minimum GeoGauge modulus of 80 MPa, is desired. Of the three methods, it is indicated that the DCP provides the most reliable results but is more labor intensive, and the other two devices will allow the operator to make more tests in a shorter period of time. It is recommended to use Clegg Hammer or GeoGauge to find areas of weaknesses and conduct DCP tests at select locations (approximately every two stations).
An air permeability test device was developed to provide a rapid measure (< 30 sec) of in
situ saturated hydraulic conductivity of granular base materials.
Trimming operations appeared to contribute the most to aggregate segregation and spatial
variation (Figure 2). Aggregate dumping and spread operations are other likely
contributors. The following three construction recommendations were provided to limit aggregate segregation: (a) limit movement of aggregate by primarily transporting aggregate transversely rather than longitudinally, (b) considering using of GPS aided grading equipment as an alternative to trimmers, (c) consider moisture conditioning the aggregate before trimming to reduce fines migration.
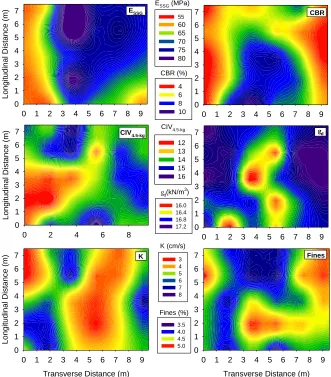
Significant spatial variation was found over a relatively small area (25 ft x 30 ft) on
compacted granular base materials with regard to permeability, density, moisture content, fines content, and stiffness (see Figure 3 for example). Although there is considerable spatial variation in base layer properties, it is not clear if the level of variation found adversely affects pavement performance. Moreover, it is not known what level of spatial uniformity is required for good pavement performance.
Figure 1. Relationship between in-situ saturated hydraulic conductivity (from air permeability tests) and percent passing no. 200 sieve (from Vennapusa et al. 2006)
Percent Passing No. 200 Sieve, 75m (%)
0 2 4 6 8 10 12 14 16
k
(cm
/s)
0.1 1 10
Project No. 3 Project No. 2 Project No. 5
Figure 2. Visual indication of aggregate segregation following trimming and compaction operations on a recycled PCC material on I35 in Hamilton County, Iowa
Figure 3. Kriged contour plots of in-situ test measurements from a site on US151 near Cedar Rapids, Iowa (reproduced from White et al. 2004a)
0 2 4 6 8
Longit udinal Di st ance (m) 0 1 2 3 4 5 6 7 12 13 14 15 16
0 1 2 3 4 5 6 7 8 9
Longit udinal Di st ance (m) 0 1 2 3 4 5 6 7 55 60 65 70 75 80
0 1 2 3 4 5 6 7 8 9
0 1 2 3 4 5 6 7 4 6 8 10
0 1 2 3 4 5 6 7 8 9
0 1 2 3 4 5 6 7 16.0 16.4 16.8 17.2
Transverse Distance (m)
0 1 2 3 4 5 6 7 8 9
Longit udinal Di st ance (m) 0 1 2 3 4 5 6 7 3 4 5 6 7 8
Transverse Distance (m)
0 1 2 3 4 5 6 7 8 9
0 1 2 3 4 5 6 7 3.5 4.0 4.5 5.0 ESSG (MPa)
CBR (%)
CIV4.5-kg
gd(kN/m3)
K (cm/s)
Fines (%)
Fines K
gd
ESSG CBR
TR-461 – Soil stabilization of non-uniform subgrade soils
The IHRB TR-461 research project included field and laboratory evaluation of fly ash
stabilization of subgrade soils. To develop a broader understanding of the engineering properties of fly ash, mixtures of five different soil types, ranging from ML to CH, and several different fly ash sources (including hydrated and conditioned fly ashes) were evaluated. Results showed that soil compaction characteristics, compressive strength, wet/dry durability, freeze/thaw durability, hydration characteristics, rate of strength gain, and plasticity characteristics are all affected by the addition of fly ash. Specimens for strength and durability testing were prepared and subjected to freeze/thaw and wet/dry curing environments to simulate Iowa field conditions. Some
specimens were cured for up to 2.5 years. The morphology of soil fly ash mixtures and the soil clay mineralogy were also studied using x-ray diffraction and scanning electron microscopy techniques. Some of the key findings are as follows (White et al. 2005a):
Iowa self-cementing fly ashes at addition rates of 10% to 20% (by dry weight of soil) are
effective at stabilizing fine-grained Iowa soils for earthwork and paving operations.
Fly ash increases the compacted dry density and reduces the optimum moisture content.
Strength gain in soil-fly ash mixtures is dependent on cure time and temperature,
compaction energy, and compaction delay. To develop a mix design, soaked laboratory samples before compressive strength testing is recommended for evaluating samples in a saturated condition.
Sulfur contents can cause formation of expansive minerals in soil-fly ash mixtures, which
severely reduces the long-term strength and durability. Tests should be performed to determine the sulfur contents of the fly ash, soil, and mix water.
Fly ash increases the CBR of fine-grained soils, and in the case of 20% fly ash addition,
the CBR can be increased up to values similar to compacted gravel (~75%).
Fly ash effectively dries wet soils and provides an initial rapid strength gain, which is
useful during construction in wet, unstable ground conditions.
Fly ash decreases swell potential of expansive soils.
Soil-fly ash mixtures cured below freezing temperatures and then soaked in water are
highly susceptible to slaking and strength loss.
Soil stabilized with fly ash exhibits increased freeze-thaw durability.
Strength of soil can be increased by adding hydrated fly ash (HFA) and conditioned fly
ash (CFA), but at higher quantities and not as effectively as self-cementing fly ash.
subbases exhibit lower variability than natural subgrade soils. This was determined by
calculating and comparing the coefficient of variation (COV) for the stiffness of natural subgrade (COV up to 71 percent), fly ash-stabilized subgrade (COV about 22 percent), reclaimed HFA (COV about 20 percent), and granular subbase (COV about 16 percent)
The influence of the spatial variability of subgrade/subbase on pavement performance was evaluated by modeling the elastic properties of the pavement structure and the pavement foundation using the ISLAB2000 finite element model. Results showed that non-uniform subgrade/subbase support increases localized deflections and causes stress concentrations in the pavement, which can lead to premature failures, fatigue cracking, faulting, pumping, rutting, and other types of pavement distresses for rigid and flexible pavement systems. Results indicated that when pavement foundations are modeled using a uniform subgrade, the maximum principal stresses and deflections are reduced in the pavement structure and thus the fatigue life is increased by about 1.7 times (Figure 4). It is recommended that pavement subgrade/subbase construction in the future should consider uniformity as one of the key issues for long-term pavement performance.
Figure 4. Contour plots of principal stresses and deflections under uniform and non-uniform subgrade conditions (from White et al. 2005b)
TR-554 – Performance evaluation of concrete pavement granular subbase
The IHRB TR-554 research project (White et al. 2008) evaluated the relationships between stability, pavement distress, and recycled PCC (RPCC) subbase materials. Laboratory and field tests and distress surveys were conducted at 26 sites in Iowa. Some key finidngs from this study are as follows:
Specific gravities of RPCC are lower than those of virgin crushed limestone.
RPCC aggregate material varied from either poorly or well-graded sand to gravel.
A modified Micro-Deval test procedure was created to conduct tests on virgin and RPCC
Micro-Deval abrasion loss of RPCC aggregate materials was much higher than those of virgin materials exceeding 30% loss.
Modulus of elasticity of RPCC subbase materials was generally high, but variable from
one project to another. RPCC subbase layers normally showed low permeability.
The current pavement surface condition of RPCC subbase sections is comparable to that
of virgin aggregate subbase sections in terms of the Pavement Condition Index (PCI) and the International Roughness Index (IRI).
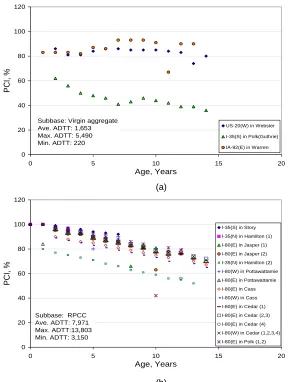
The pavement surface condition history of RPCC subbase sections is not much different
from that of virgin aggregate subbase sections (Figure 5).
Few longitudinal and transverse cracks were observed on all test sections. The featured
distresses on RPCC are the lane-to-shoulder separation and lane-to-shoulder drop off, which are consistent with the findings reported by previous researchers.
No correlation was observed between the pavement surface condition indices and the
[image:36.612.163.451.283.665.2]RPCC subbase layer thickness.
Figure 5. Variations in PCI with age on PCC pavement sections with (a) virgin aggregate subbase, and (b) RPCC subbase
0 20 40 60 80 100 120
0 5 10 15 20
Age, Years
PCI,
%
US-20(W) in Webster
I-35(S) in Polk(Guthrie)
IA-92(E) in Warren
Subbase: Virgin aggregate Ave. ADTT: 1,653 Max. ADTT: 5,490 Min. ADTT: 220
0 20 40 60 80 100 120
0 5 10 15 20
Age, Years
PCI,
%
I-35(S) in Story I-35(N) in Hamilton (1) I-80(E) in Jasper (1) I-80(E) in Jasper (2) I-35(N) in Hamilton (2) I-80(W) in Pottawattamie I-80(E) in Pottawattamie I-80(E) in Cass I-80(W) in Cass I-80(E) in Cedar (1) I-80(E) in Cedar (2,3) I-80(E) in Cedar (4) I-80(W) in Cedar (1,2,3,4) I-80(E) in Polk (1,2)
Subbase: RPCC Ave. ADTT: 7,971 Max. ADTT:13,803 Min. ADTT: 3,150
TR-495 – Field evaluation of compaction monitoring technology
The IHRB TR-495 research project (White et al. 2004b, 2006) describes field evaluation of a compaction monitoring technology develop by Caterpillar, Inc. (Figure 6), for use as a QC/QA tool during earthwork construction operations (e.g., pavement subgrade and subbase layer construction), which has the advantage of 100% coverage of compacted areas. The compaction monitoring technology evaluated was based on machine drive power (see White et al. 2005c) for more details), which works in both static and vibratory modes. Results from this study indicated that the compaction monitoring technology identified “wet” and “soft” sports that were
artificially incorporated into test areas. The results indicated that single in situ test point does not provide a high level of confidence in representing the average soil engineering property values over a given area as variation always exists and several samples must be tested to determine soil properties with any confidence. Correlations between in situ tests and machine drive power measurements indicated that the machine drive power measurements can be related to dry unit weight, DCP index, elastic modulus, Clegg impact values, but stronger correlations were found with soil stiffness values (i.e., Clegg impact values, DCP index, and elastic modulus). As a result, it is recommended that new acceptance criteria must be developed to define quality in terms of compaction monitoring output. This effort, which is a leap from density-based quality criteria to strength/stiffness-based quality criteria, may take considerable time to identify target values, especially for cohesive soils where stiffness is highly dependent on moisture content. It is emphasized that compaction monitoring technology currently does not eliminate the need for soil moisture control during earthwork construction.
Figure 6. CAT compaction monitoring system components (White et al. 2004b) TR-503 Utility cut repair techniques
and designing, constructing, testing a few trial trenches for evaluation. Some significant results from this study are as follows:
Data provided by the city of Ames indicated that January and December are the prominent months for water main breaks. This trend may be a result of frost loading, which could substantially increase vertical loads (i.e., up to twice the original load) on buried pipes.
Each city surveyed (Ames, Cedar Rapids, Davenport, Des Moines, Dubuque, Waterloo, and Burlington) indicated that the current method of utility cut construction resulted in
satisfactory results and there was virtually no problem. However, these cuts were estimated to last less than two years, which is a relatively short period. The life of an undisturbed pavement can be approximately ten times this length. This may be a result of minimal documentation kept on utility cut maintenance and repairs, as well as a personal opinion of the definition of a poorly performing utility cut.
Construction requirements varied between each city. The material selection is based on regional availability. Burlington experienced problems with using sand backfill, and was the only city at the time of survey that consistently used flowable fill for utility cuts. Other cities in Iowa have used flowable fill under specific circumstances.
All surveyed cities used granular backfill materials with a requirement of a minimum 90% to 95% standard Proctor density in the specifications. QC was found to be minimal. Dubuque and Waterloo used nuclear density gauge to monitor compaction. In some cases, however, an inspection program consisted of only visual inspection.
Lift thicknesses generally ranged from 2 to 4 feet, with compaction done sporadically throughout the fill using a vibrating plate on the end of a backhoe. In most cases, the method of obtaining compaction was based on experience. Backfill materials were compacted using large compaction equipment sometimes very close to the edge of the cut. This resulted in damage to pavement surfaces along the perimeter of the excavation.
It was often observed that saturated native materials were added to the excavation in an attempt to clean the utility cut area. Because of this, the potential to formation of voids increased and thus leading to potential settlement in the future. This is an undesirable practice because saturated material is very weak, has low compaction properties, and achieving its original density is extremely difficult after its disturbed (specifically in clay-type native materials). The use of native materials in an excavation also requires monitoring of the moisture content for optimum performance.
Field relative density values in utility backfills tested varied from very loose to very dense state on different projects.
DCP results indicated that CBR values were higher near the center of the excavated areas when compared to CBR values near the edge of the trench. It is recommended to use smaller compaction equipment to achieve uniform compaction throughout the trench so that confined areas can be reached and compacted properly. DCP profiles indicated zones of low
compaction with depth due to thicker lifts (> 12 inches).
The backfill material used in most of the sites had fines contents (percentage passing sieve No. 200) greater than the maximum limit allowed by Iowa DOT (i.e., 10%) for backfill material gradation. Most of these materials were placed at or near the bulking moisture content, which increases the settlement (collapse) potential.