133
Chapter 9: Wireless Network for Irrigation Valve Control
, University of California .
Patrick Brown ,
Delwiche .
Michael J ,
Coates .
Robert W
Department of Biological & Agricultural Engineering, Davis, CA 95616 USA.
email: [email protected]
ABSTRACT
Precision management of irrigation and fertigation in orchards, nurseries, and
landscapes is difficult with traditional sprinkler and drip systems, which are designed
for uniform water and nutrient delivery and ignore the reality that demand varies
across fields and between individual plants. We are developing a wireless valve
network capable of controlled application of water, fertilizer, and agricultural
chemicals through each valve. Mesh networking will be used to pass information
from one node to any other node by routing the message through intermediary nodes. Each valve controller will operate autonomously from a battery and solar
panel. Individual schedules will be adjusted to match differing water and fertilizer
requirements. Pressure sensors will be used to improve application accuracy over
that of fixed-duration irrigation and to automatically detect line breaks and emitter
clogging. Other environmental sensors (e.g., soil moisture) may also be used to
control irrigation and fertigation. Our early prototype for microsprinklers was
designed using commercial demonstration boards and latching solenoid valves. We
are currently designing the second generation system using smaller, lower-power
wireless modules designed specifically for sensor networks. Testing confirmed that
each node properly responded to commands to open or close its valve. Radio
transmission range under visual line-of-sight conditions was about 50 m using the
134
about 20 µA. Current consumption during radio transmission and receiving was
about 20 mA. The solar panel produced 52 to 81 mA-h in full sun and 6 to 10 mA-h
in shade. We will soon begin testing the network in orchards, nurseries, and
landscape applications.
Introduction
Site specific irrigation and fertilization have proven to be useful tools for crop management. Existing technology generally limits the scale at which site management can take place since fields are divided into management units which contain many sprinklers or emitters. This problem is evident in orchards, landscapes, nurseries, and greenhouses. The needs of individual trees in an orchard may vary due to such things as soil condition, elevation changes, or localized pest infestations. When applied uniformly, water and fertilizer may leach in light textured soils and pool in heavy soils. For trees planted on steep slopes, maintaining irrigation uniformity is difficult. Insecticide application is usually not needed in an entire orchard since infestations often occur in small regions. Nurseries and greenhouses contain many different varieties of ornamental plants in close proximity to one another and must deal with continually changing inventory and strict environmental regulations. A single valve usually controls water flow to many emitters, and if there are plants of differing size or water requirements, some will receive too much water, while others will receive too little. Irrigation control in landscapes is also important since a significant amount of water in California is used for turf-grass and ornamentals. Studies have shown that optimizing water delivery can conserve water and prevent run-off. Many commercial controllers have been developed in order to optimize water delivery by using reference evapotranspiration, but they only address the scheduling aspect of irrigation management and do not help with problems such as varying soil types, elevation, and diverse water requirements for plants in a single landscape. By dividing a field into smaller management units, overall efficiency could be increased. To achieve this goal, an easy-to-use network of many valves is needed.
135
schedules will be different in order to match differing water and fertilizer requirements and could be changed to accommodate replants, disease, growth, or seasonal changes. This could improve profitability by increasing overall plant quality, while reducing water and fertilizer waste. Environmental benefits such as reduced leaching and runoff are also expected. Using feedback from pressure sensors, it will be possible to improve water and fertilizer application accuracy over that of fixed-duration irrigation. An added benefit is that these sensors will provide information to automatically detect line breaks, emitter clogging, and similar problems.
Objectives
The objectives of this research are to
(1) design an intelligent valve controller capable of low-power, wireless communication,
(2) design an energy management system to allow stand-alone operation of each valve controller,
(3) develop a communication network to link the valve controllers with a central field controller, and
(4) devise control strategies for applying water and fertilizer.
Previous Research
Reduced environmental damage and increased profitability are documented benefits of spatially variable irrigation and fertilization. Matching nitrogen delivery with plant needs has increased fertilizer use efficiency and net returns in some field crops (Beckie et al., 1997) and reduced nitrate leaching in potato crop simulations (Verhagen, 1997). Variable rate application of granular fertilizer based on individual tree size in citrus reduced overall nitrogen application by 38-40% compared to conventional treatment (Zaman et al., 2005). It seems logical that the benefits of variable rate granular fertilization would be seen for variable rate fertigation as well. Spatially variable management has also been shown to increase profits from corn (Koch et al., 2004; Wang et al., 2003) and improve yield in potatoes (King et al., 2002) and grain sorghum (Yang et al., 2001).
136
row, which were grouped based on size (large and small trees). In another development, microcontrollers responded to soil moisture feedback by controlling water flow to individual laterals for potted plants (Rodrigues de Miranda, 2003). Spatially variable irrigation has also been tested in center-pivot and linear-move systems for field crops (Camp et al., 1998; King et al., 1999; King and Kincaid, 2004). We recently developed a precision microsprinkler system for orchards, using wires for power and communication. The microsprinkler system was designed to provide spatially variable delivery of water and fertilizer, and a prototype was installed in a small nectarine block (Coates et al., 2006a; Coates et al., 2006b). Individually addressable microsprinkler nodes, each containing control circuitry and a valve, were located at 50 trees. A drip line controller stored the irrigation schedule and issued commands to each node. Pressure sensors connected to some of the nodes provided lateral line pressure feedback. The system was programmed to irrigate individual trees for specific durations, to apply a specific volume of water at each tree, or to irrigate in response to soil water demand. Fault detection was used to check for damaged drip lines and clogged or damaged emitters. This system could be improved by using radio-frequency (RF) communication and solar power to eliminate the use of wires. This will improve ease of installation and reduce problems associated with long-range wired communication and damage from animals and machinery.
Methods and Materials
System Design
137 Personal Computer Wireless
Modem Wireless
Modem
Field Controller
2
Irrigation Line
Valve Controller Node
Irrigation Line
Fertilizer Injection
3
4
5
n 6
1
[image:5.595.91.320.71.216.2]optional
Figure 1. Layout of mesh network for wireless valve control.
Our first generation prototype for a wireless microsprinkler was designed using commercially-available demonstration boards (Figure 2) (Microchip Technology Inc., Chandler, Arizona, USA). The network communication protocol was handled by the company's implementation of the Zigbee wireless networking standard (http://www.zigbee.org). A latching solenoid valve was used to control water flow through the emitter since it required only a brief pulse of energy to open or close. It was operated by N-channel metal-oxide-semiconductor field-effect transistors (MOSFET) controlled by digital outputs on the microcontroller. A piezoelectric buzzer was connected to the microcontroller for audible feedback during node operation. The nodes were powered with 9 V alkaline batteries, with the intention of moving to rechargeable batteries and a solar panel mounted on the stake.
[image:5.595.90.236.491.714.2]138
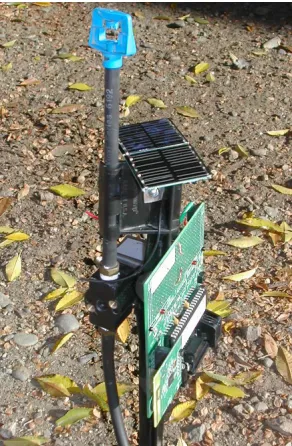
[image:6.595.91.307.374.514.2] [image:6.595.89.299.575.748.2]After initial testing, we realized that the Zigbee communication protocol did not support the battery-powered routing feature needed for a truly low-power wireless network. For the second generation design, we selected smaller, low-power wireless modules (Moteiv Corporation, San Francisco, CA, USA) and housed the components in a polycarbonate enclosure (Figure 3). The modules are designed specifically for battery-powered mesh networking and are programmed using TinyOS, an open-source operating system written for wireless sensor networks (http://www.tinyos.net). A 7.2 V nickel-cadmium battery and 200 mW (13.4 V, 15 mA) solar panel were selected to provide continuous operation without battery replacement each season. The modules have been used to operate 1-inch and 1/8-inch latching valves (Figure 4). One wireless module (base node) was connected by serial port to an embedded controller which acted as the field controller for the network of remote nodes (Figure 5). The field controller contained a keypad to allow entry of schedules and manual operation of the remote valves, and a liquid crystal display (LCD) for viewing status information.
139
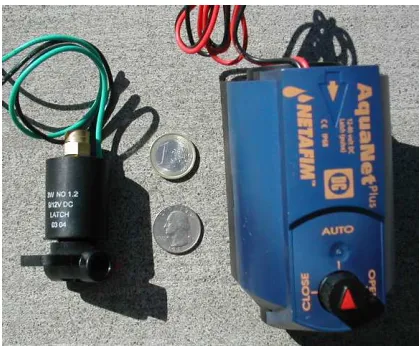
[image:7.595.89.309.128.331.2]Figure 4. Latching solenoid valves with 1/8" or 1" ports for irrigation/fertigation control.
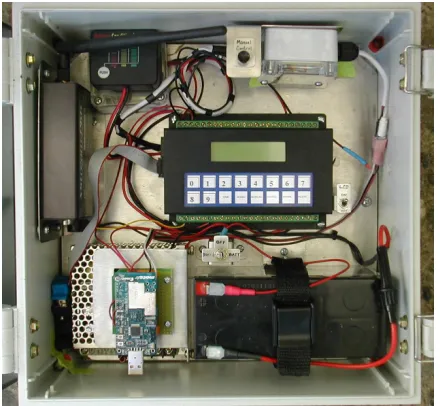
Figure 5. Field controller with embedded controller and wireless module (base node).
Results and Discussion
Mesh Network
Communication between the field controller and four remote nodes was tested under outdoor, visual line-of-sight conditions. Commands (i.e., open or close valve) entered on the field controller keypad were transmitted by serial port to the base node and then by radio to the remote nodes. The radio message included the source and destination node addresses, and the entered command. The base node used Drip, a broadcast protocol available for TinyOS. Drip is designed to disseminate messages throughout a network by repeated rebroadcast. When a node receives a message, it stores a copy of the message to process and then rebroadcasts it to all neighboring nodes. The rate of rebroadcast is initially high to increase network performance, but quickly drops to a very low base rate. Continued rebroadcast at a low rate is designed to improve network reliability by ensuring that all nodes eventually receive the message. This is typically more important in ad-hoc networks where nodes join and leave the network frequently.
140
battery (2 A peak current). The acknowledgement message was transmitted using the MultihopLQI routing protocol in TinyOS. All messages from remote nodes to the base node use this protocol since it is more efficient than the broadcast mechanism. The MultihopLQI protocol does not support base-to-remote routing. Instead of disseminating the message throughout the entire network, only certain nodes are involved in its routing. The base node sends out routing beacons which propagate through the network. Each remote node creates a routing table that includes an entry for each neighboring node. Associated with each neighbor is a routing cost metric, based on the shortest path and link quality indicators from the routing beacons, for the best route when sending a message to the base node. A node routes messages to the neighbor with the lowest cost. If a transmission fails, the message is re-routed to the node with the next lowest cost. This occurs until the message reaches the base. Routing beacons are transmitted every 30 seconds to ensure routing tables in each node are updated as network conditions change, reducing the likelihood that impromptu re-routing due to failures will be necessary. In our tests, acknowledgements received by the base node were transmitted to the field controller and a confirmation message was displayed on the LCD. Maximum one-hop radio range under visual line-of-sight conditions was about 50 m using the printed antennas on the wireless modules. Improved range could be achieved by using a wire antenna.
Energy Management
Node current consumption of the first generation design was about 100 µA at 9 V (Table 1) during periods of sleep (radio turned off). Of this, 65 µA was lost as ground current from the voltage regulator on the demonstration board. Total current
consumption could be lowered to about 40 µA if a more efficient voltage regulator was used. Current consumption of the second generation design was about 20 µA at 7.2 V during sleep. Both designs consumed 20 mA during radio transmission and reception.
141
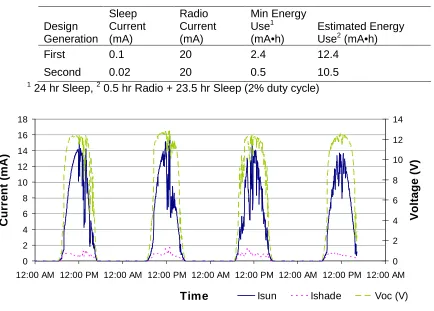
and is still being evaluated. The nodes spend most time in sleep-mode and synchronously wake to pass messages for about 40 ms every 2 s (2% duty cycle). Solar panel performance was tested in full sunlight and full shade conditions. A datalogger recorded open-circuit voltage in full sunlight and output current from the panel through a 10 Ω load resistor for 19 days (Figure 6). Peak voltage was 12.7 V and peak current was about 15 mA in full sun and 1.5 mA in shade. Integration of current over time yielded a daily production of 52 to 81 mA-h in full sun and 6 to 10 mA-h in shade. Operation in shaded conditions produced much less energy and would require careful monitoring of radio use to not use more energy than was produced by the panel.
Energy management will be critical to ensure continuous node operation. Charge current into the battery will be monitored as voltage drop across a precision 10 Ω
[image:9.595.63.497.407.718.2]resistor and switched on and off through a MOSFET. The microcontroller will monitor circuit and radio energy use and balance this by ensuring adequate charging of the battery, without excessive overcharge that might degrade battery lifetime.
Table 1. Comparison of energy use of first and second generation wireless nodes.
Design Generation Sleep Current (mA) Radio Current (mA) Min Energy Use1 (mA•h) Estimated Energy Use2 (mA•h)
First 0.1 20 2.4 12.4
Second 0.02 20 0.5 10.5
1 24 hr Sleep, 2 0.5 hr Radio + 23.5 hr Sleep (2% duty cycle)
0 2 4 6 8 10 12 14 16 18
12:00 AM 12:00 PM 12:00 AM 12:00 PM 12:00 AM 12:00 PM 12:00 AM 12:00 PM 12:00 AM
Time C u rr e n t (m A ) 0 2 4 6 8 10 12 14 V o lt a g e ( V )
Isun Ishade Voc (V)
142 Future Research
Solar recharge of the NiCd battery and low-power operation are being evaluated to determine long term performance. Sensors will be connected to the nodes for monitoring water pressure or soil moisture level. Nodes will be deployed in the field and used to develop strategies for controlled application of water and fertilizer, and automated fault detection. Since this system has potential applications in orchards, nurseries, greenhouses, and landscapes, the wireless controllers will be designed to operate large valves that could control flow to multiple sprinklers or drip emitters (e.g., laterals), and small valves that control flow to individual trees (e.g., each microsprinkler).
Acknowledgements
This research is supported by the California Department of Food and Agriculture -
Fertilizer Research and Education Program, the California Association of Nurseries and Garden Centers, and the Slosson Endowment for Ornamental Horticulture.
References
Beckie, H.J., A.P. Moulin, D.J. Pennock. 1997. Strategies for variable rate nitrogen fertilization in hummocky terrain. Canadian Journal of Soil Science 77: 589-595.
Camp, C.R., E.J. Sadler, D.E. Evans, L.J. Usrey, M. Omary. 1998. Modified center pivot system for precision management of water and nutrients. Applied
Engineering in Agriculture 14(1): 23-31.
Coates, R.W., M.J. Delwiche, P.H. Brown. 2006a. Control of individual microsprinklers and fault detection strategies. Precision Agriculture 7: 85-99.
Coates, R.W., M.J. Delwiche, P.H. Brown. 2006b. Design of a system for individual microsprinkler control. Transactions of the ASABE 49(6): 1963-1970.
143
King, B.A., R.E. Reeder, R.W. Wall, J.C. Stark. 2002. Comparison of site-specific and conventional uniform irrigation management for potatoes. ASAE Paper No. 022175. St. Joseph, Mich.: ASABE.
King, B.A., D.C. Kincaid. 2004. A variable flow rate sprinkler for site-specific irrigation management. Applied Engineering in Agriculture 20(6): 765-770.
Koch, B., R. Khosla, W.M. Frasier, D.G. Westfall, D. Inman. 2004. Economic feasibility of variable-rate nitrogen application utilizing site-specific management zones. Agronomy Journal 96: 1572-1580.
Rodrigues de Miranda, F. 2003. A site-specific irrigation control system. ASAE Paper No. 031129. St. Joseph, Mich.: ASABE.
Torre-Neto, A., J.K. Schueller, D.Z. Haman. 2000. Networked sensing and valve actuation for spatially-variable microsprinkler irrigation. ASAE Paper No.
001158. St. Joseph, Mich.: ASABE.
Verhagen, J. 1997. Site specific fertiliser application for potato production and effects on N-leaching using dynamic simulation modelling. Agriculture,
Ecosystems, and Environment 66(2): 165-175.
Wang, D., T. Prato, Z. Qiu, N.R. Kitchen, K.A. Sudduth. 2003. Economic and environmental evaluation of variable rate nitrogen and lime application for claypan soil fields. Precision Agriculture 4(1): 35-52.
Yang, C., J.H. Everitt, J.M. Bradford. 2001. Comparisons of uniform and variable rate nitrogen and phosphorus fertilizer applications for grain sorghum.
Transactions of the ASAE 44(2): 201-209.
Zaman, Q.U., A.W. Schumann, W.M. Miller. 2005. Variable rate nitrogen application in Florida citrus based on ultrasonically-sensed tree size. Applied
145
146
Potentials of Wireless Sensors Network in Precision Agriculture and
Environmental Monitoring
Authors: Ning Wang, Naiqian Zhang, Maohua Wang
Abstract
147
Integrated Thermal and Visible Imaging
for Crop Water Stress Assessment in a Wine-Grape Vineyard
Victor Alchanatis1, Markus Moller2, Yafit Cohen1, Shabtai Cohen1, Moshe Meron3, Josef Tsipris3, Amos Naor3, and Ziv Harit4
1Agricultural Engineering, and 2lnstitutes of Soil, Water and Environmental Sciences ARO.
Volcani Center, P. 0. Box 6, Bet Dagan 50250, Israel
3Migal Galilee Research Center and Northern R&D, Kiryat Shmona, Israel 4Netafim Irrigation Systems, extension office, Yiftah, Israel
ABSTRACT
Achieving high quality wine grapes depends on our ability to maintain mild to moderate stress in the crop during the growing season. This involves tightly controlled irrigation management. In addition, natural geographical variability can lead to variable stress levels in different parts of the vineyard resulting in variability in grape quality at harvest. This can be prevented by precision irrigation at the vine level. For both of these reasons the ability to monitor stress levels at the plant and plot scale can increase orchard profitability by facilitating the production of a uniform crop of high quality grapes. The current research is part of an ongoing investigation of the use of thermal imaging for monitoring crop water stress.
Experiments were done in a wine-grape (vitis vinifera cv. Merlot) vineyard in northern Israel. Three irrigation treatments were applied from the beginning of the season in order to obtain no, mild and severe stress conditions. Measurements were made on four days in June, July and August. Thermal and visible (RGB) images of the crop were taken during mid-day hours with a FLIR thermal imaging system (model SC2000) and a Sony digital camera (model DSC717), respectively, both mounted on a truck-crane in the orchard. The imaging systems were positioned approximately 15m above the vines, and aluminum crosses were used to geo-registervisible and thermal images. An artificial wet surface was also placed in the pictures.
148
speed.
Computations of crop water stress index (CWSI) were made using standard equations,but with a variety of leaf, canopy, and reference temperatures determined from thethermal images and climate data. The overlay of RGB and thermal images allowedselection of sunlit leaf temperatures.
149
Bacterial Population Change as a Potential Sensor of Changes in Soil
Conditions
1 Kautsky . and L , 3 Jurkevitch . E , ,3 1 Farkash . T , 2 Shaviv . A , ,2 1 Oved . T , 1 Minz . D
1 Institute of Soil, Water and Environmental Sciences, Agriculture Research
Organization, The Volcani Center, P.O. Box 6, Bet-Dagan, 50-250
2Civil and Environmental Engineering- Technion
3 Department of Microbiology and Plant Pathology, Faculty of Agricultural, Food and
Environmental Quality Sciences, The Hebrew University of Jerusalem, Rehovot
ABSTRACT
Agricultural irrigation with wastewater effluent is a common practice in arid and semi-arid regions, and is used as a readily available and inexpensive option to freshwater. However, irrigation with effluents, which contain high levels of nitrogen, minerals, dissolved organic carbon (DOC), detergents, microorganisms and toxic metals, may alter the microbial populations in soil, and thus affect soil fertility.
We have studied number of microbial activities and biomass parameters in soils, affected by irrigation with wastewater. In addition, we followed the effect irrigation with wastewater has on community composition of several important microbial groups in soil.
We observed a change in several microbial activities in soils during irrigation with wastewater, changes that were dependent on the length of the irrigation period. One important group of organisms that may be affected by wastewater is the chemolithotrophic ammonia oxidizing bacteria (AOB). These bacteria are responsible for the first, rate-limiting step in nitrification in which ammonia (NH3) is transformed to
nitrate (NO3-) via nitrite (NO2-). Analyses were conducted on the effluents used for
150
dominant in effluent- irrigated soils. Although Nitrosomonas-like sequences were dominant also in the effluents used for irrigation, they were different from those dominating the effluent-irrigated soils. This phenomenon was obvious in all depths of all soils to different degrees.
Another group of important bacteria we studied are the nitrogen-fixing rhizobia. We have followed shifts in their community in nodules of legumes irrigated with
wastewater. Here, too, we monitored a shift in community composition, resulting from wastewater irrigation, but between isolates of the same species. This shift was accompanied by a change in nitrogen fixing and in plant parameters.
151
Crop Stress Mapping for Precision Irrigation by Thermal Sensing
and Artificial Reference Surfaces
M. Meron, J. Tsipris V. Alchanati, Y. Cohen, S. Cohen, M. M. Moller and E.
Sela.
ABSTRACT
Plants maintain their inner water potential by controlling stomatal apertures to regulate transpiration, thus in adverse condition, when soil water availability is short of atmospheric water demand, leaves reduce capability to cool themselves. For practical application of stress assessment from crop canopy temperatures in irrigation, proper measurement of canopy temperature and normalization of the measured temperature to prevailing atmospheric conditions must be addressed. Infra red (IR) sensors measure radiative skin temperatures of the surface. Canopy temperatures are mixed in the scene with soil and other irrelevant background heat radiation. Imaging radiometers with spatial resolution matching the size of the smallest leaf element were used, and a simple pixel histogram based algorithm has been applied, to rapidly identify and differentiate relevant canopy temperatures from the background noise.
Crop water stress index (CWSI) defined as the canopy temperature relative to the span between a minimum and a maximum value under ambient condition is the current applied method to normalization of IR surface temperatures to ambient conditions. Heat balance theory defines the upper and lower values, but some of the necessary parameters are immeasurable directly, and others need the operation of a full scale digital meteo-station. Empirical methods may tie effectively upper limits to air temperatures, as a single input, but determination of the coldest temperature in ambient conditions remains a challenge. Well watered canopy temperatures, represent the natural empiric low temperature reference, but difficult to maintain. Artificial reference surfaces (ARS) can be manufactured to reproducible standards, however commonly found materials have dissimilar heat balance parameters to natural vegetation. Spraying the crop surface with water may represent unlimited transpiration of the canopy.
Upper and lower CWSI limits derived from artificial, natural, and sprayed canopy reference surfaces and their relation to crop water stress indicators were tested on differentially irrigated cotton canopies. The dependence of those limits on climatic
152
Use of Thermal Imaging for Estimating and Mapping Crop Water
Stress in Cotton
E. Sela1,2, Y. Cohen1, V. Alhanatis1, Y. Saranga2, S. Cohen3, M. Möller3, M. Meron4, A. Bosak5, J. Tsipris4 and V. Ostrovsky4.
1 Agricultural Research Organization, the Volcani Center, Institute of Agricultural
Engineering, Bet Dagan, Israel.
2 The Robert H. Smith Institute of Plant Sciences and Genetics in Agriculture,
The Faculty of Agricultural, Food and Environmental Quality Sciences. Hebrew University of Jerusalem, Rehovot, Israel.
3 Agricultural Research Organization, the Volcani Center, Institute of Soil, Water and
Environmental Sciences, Bet Dagan, Israel.
4 Crop Ecology Laboratory, MIGAL Kiryat Shmona, Israel. 5 Southern Growers Organisation, Israel.
Water status of crop plants is a major factor determining both quantity and quality of yield. Farmers control crop water status through irrigation scheduling and quantifying, which is conventionally based on pre-determined recommendations and/or a few measurements of plant physiological parameters. Moreover, irrigation is usually applied uniformly, disregarding the natural variability within field plots.
Leaf water potential (LWP) is the most commonly used parameter for irrigation scheduling in cotton. However, the time-consuming procedure limits its application to large areas. Canopy temperature has long been recognized as a good indicator for crop water status and as a potential tool for irrigation scheduling. Thermal infra-red (TIR) images provide a synoptic view of crop temperature over wide areas. This study aims to develop a model-based method for estimating and mapping LWP in cotton fields based on fusion of TIR and RGB images.
Three to five irrigation regimes were implemented in cotton fields at three locations in 2003 and 2005. This study is based on measurements made on 9 days. On each day, simultaneous TIR and RGB images were taken from 20 m height. An artificial wet reference surface (AWRS) was placed within each image to simulate a fully transpiring leaf. LWP was measured in plants within the image area and 1 minute meteorological data were collected during measuring time.
153
air temperature plus 5 degrees were used for minimum and maximum temperatures, respectively. The CWSI values were then utilized to establish a prediction model of LWP.
An initial LWP prediction model was developed based on data from all 9 days. This model showed an overall good correlation (r2=0.86; n=42) and a RMSEV (root mean square error of validation) of 0.173 MPa. Regression models were also developed dividing the days of measurements into vegetative and reproductive stages. The relationship between CWSI and LWP were different for each stage. In the reproductive stage it was improved (r2=0.93; n=22) and the RMSEV was reduced to 0.139 MPa. as compared to the model based on 9 days. The error scale is slightly higher than the range usually obtained with direct LWP measurements, i.e. 0.1 MPa. Moreover, while the direct measurements of LWP are based on few leaves, a single TIR image covers the top canopy of around 20 plants. In comparison, the relationship between CWSI and LWP in the vegetative stage was worse (r2=0.70) and the RMSEV increased (0.194 MPa). This result is less encouraging since the error is twice as much as the variability range of direct LWP measurements.
Validation of the reproductive model with data from the vegetative stage revealed RMSEV of 0.214. This suggests that the relationship between CWSI and LWP changes over the two different growing stages. All three models will be re-validated in the near future using TIR imagery data already collected during the summer of 2006. These models were further used for producing LWP maps. The distribution of LWP in the maps enhanced the differentiation between irrigation treatments in comparison to direct LWP measurements. The maps also revealed the existence of spatial variability within each treatment.
154
Monitoring Methods: An Overview
Israel Schechter
Schulich Faculty of Chemistry and Grand Water Research Institute Technion – Israel Institute of Technology
ABSTRACT
Monitoring nutrients and water availability to plants is needed in order to maximize the rate of growth and yield of crops, as well as their nutritional value. Traditionally, people attempted to monitor the water contents and the concentration of nutrients in soil. This has been carried out using analytical technologies, including a variety of chemical methods. When off-line data is acceptable, soil samples are transported to laboratories for precise analysis using heavy instrumentation. When on-line information is needed, chemical sensors and detectors are applied. Most sensors suffer of the so called “matrix effects”, and require individual and frequent calibrations. Another widely used technique is remote sensing, based on spectral and hyper-spectral imaging.
155
An Intelligent Irrigation Control System with Feedback
Benjamin Zur
ABSTRACT
The objective of the developed system is to control the time to start and stop irrigation automatically. The algorithms to start and stop irrigation are based on input information in real time concerning the changes in the soil water content of discrete soil layers. This information is obtained by frequently scanning a dedicated probe made up of simple sensors capable of following accurately the changes in water content of the surrounding soil as a result of irrigation, drainage and water uptake by roots. Using appropriate algorithms the system can track the position of the wetting front during irrigation and the drainage front during redistribution to field capacity. Dedicated algorithms were developed to locate the soil depth of maximal root activity as well as the location of the bottom of the active root zone. Irrigation is started when the water content of the most active layer had changed by a predetermined percentage. Irrigation is stopped when the wetting front had reached a depth that, at the end of the redistribution process, allows the drainage front to reach the bottom of the active root zone. A learning feedback loop is activated during that time in order to update the decision when to stop irrigation.
156
Plant Activated Threshold Tension Autonomous Irrigation (TTAI)
Using A New Irrigation Controller and Approach Prevents Drainage
and Improves Irrigation and Water Use Efficiency.
Isaac Klein
Institute of Plant Sciences,
The Volcani Center, Bet Dagan 50250, Israel
ABSTRACT
157
Basing a Decision Support System for Improving Wheat Quality on
Multi or Hyperspectral Images
David J. Bonfil1*, Agustin Pimstein12, Yafit Cohen3, Israel Mufradi1, Silvia Asido1, Arnon Karnieli2
1- Field Crops and Natural Resources Department, The Institute of Plant Sciences, Agricultural Research Organization, Gilat Research Center, 85280 MP Negev 2,
Israel 2- The Remote Sensing Laboratory, Jacob Blaustein Institute for Desert Research, Ben Gurion University of the Negev, Sede-Boker Campus 84990, Israel
3- Agricultural Engineering Institute, Agricultural Research Organization, The Volcani Center, PoB 6 Bet-Dagan 50250, Israel
*corresponding author il . gov . agri . volcani @ bonfil : Email ; 9926485 -8 -972 + Fax ; 9928654 -8 -972 + Tel ; ABSTRACT
158
Prominent Wavelengths for Monitoring Nitrogen Status of Wheat
Crops from Remotely Sensed Data
A. Pimsteinab, A. Karnielia, D.J. Bonfilb,
a
The Remote Sensing Laboratory, Jacob Blaustein Institute for Desert Research, Ben Gurion University of the Negev, Sede-Boker Campus 84990, Israel
b
Field Crops and Natural Resources Department, Agricultural Research Organization, Gilat Research Center, 85280 MP Negev 2, Israel
ABSTRACT
159
Advanced
15N-Based Techniques to Trace Nitrogen Transformations
in Soils and Environmental Systems
Avi Shaviv, Master, Y. and Shavit, U.
Faculty of Civil and Environmental Engineering, Technion, Israel.
ABSTRACT
The soil application of substances rich in OM and NH4 +
is a common and important practice for increasing soil fertility. Yet, these are also likely to result in elevated N2
and N2O emissions and with nitrite formation during initial stages. Irrigation with
recalimed wastewater (RW), which became a necessity in arid and semi-arid regions, poses similar problems. Nitrification and denitrification are the two major processes responsible for N2O production and nitrite formation in such systems. Little
information is available regarding the N2 and N2O evolution from Mediterranean soils
and the pathways of their formation as affected by RW irrigation or high loading of OM. Fluxes of N2, N2O and NO2- and the processes affecting their evolution can be
studied using 15N labeled ammonium or nitrate to RW or OM amended soils.
There is much evidence that the formation of N2O in sediments of aquatic systems
polluted with high nutrient and organic loads is significant. This is particularly so in regions with water shortage where streams are often affected by wastewater spills or poorly RW inputs and agricultural return flows. The main processes responsible for N2O production in such systems is nitrification of NH4+ and denitrification of NO3, the
two taking place in the oxic and anoxic layers of the sediment, respectively.
This presentation demonstrates the use of labeled 15N-NH4 and 15N-NO3 for
investigating and quantifying N-transformations in Mediterranean soils and in sediments of polluted streams. The work is mainly based on determination of isotopic dilution of N-ionic species and determination of fluxes of N2 and N2O isotopes
utilizing IRMS (Isotope ration Mass Spectrometry). Such an approach allows determination of the "gross" rates of nitrification and mineralization – namely to account for the whole amount nitrified or mineralized and not only for the "net" (sometimes denoted – apparent) amount formed in a natural system. It also enables determination of the fluxes of N2O and makes it possible to quantify the contribution
160
A newly developed approach (Master et. Al., 2005, Master, 2007) to investigate and quantify N-transformation and N2O formation in sediments of polluted streams –
MIPT (Modified Isotope Pairing Technique) is briefly presented. Emphasis is put in its
contribution to better understanding N pathways and quantification of the contribution of nitrification and de-nitrification to N2O emissions.
Improved understanding of N pathways in soils and sediments and quantification of fluxes and rates of major processes affecting pollution and nitrogen use efficiency (NUE) are essential for better management of N in agricultural land or agro-ecosystems.
References
Master, Y.; Laughlin, R. J.; Stevens, R. J.; Shaviv, A.. 2004. Nitrite formation and nitrous oxide emissions as affected by reclaimed effluent application. Journal of Environmental Quality 33(3), 852-860
Master, Y.; Shavit, U.; Shaviv, A.. 2005. Modified Isotope Pairing Technique to Study N Transformations in Polluted Aquatic Systems: Theory. Environmental Science and Technology 39(6), 1749-1756
161
Monitoring Water Stress in Plants Using Hyper-Spectral Camera
Maxim Shoshany and Ronit Rud
Environmental Hyper-Spectral Laboratory,
Faculty of Civil & Environmental Engineering, Technion
ABSTRACT
Hyper-spectral imagery provides cost efficient means for monitoring vegetation growth and status, which are adequate for implementation in Precision Agriculture. Existing spectral data regarding spectral signatures of specific species and spectral indicators for water stress are acquired mainly in 'ideal' conditions: in controlled environment within laboratory or by spectro-radiometers measuring the reflectance from individual leafs using artificial light source. The comparison between such measurements with data obtained by imaging sensors at natural sun light is most problematic due to limitations on conducting radiometric calibration at the leaf level. The flux density on the surface of a leaf is influenced by the sun angle of incidence relative to the normal to the surface. Currently there is no data available for the position and orientation of individual leafs, information which is crucial for conducting accurate radiometric calibration. The use of imagery data as is for detecting water stress or using signatures from measurements in controlled environments will not provide reliable results.
162
APPENDIX I: Symposium Participants
Participants List
Dr. Achilea Oded, Haifa Chemicals Ltd., P.O.Box 10809, Haifa Bay 26120 Israel,
Dr. Alchantis Victor, Agricultural Research Organization, Volcani Center, P.O.Box 6, Bet Dagan 50250, Israel, [email protected]
Ankorion Yosef, Rotem Amfert Negev, 26 Har Sinai, Raanana, Israel,
Mr Aycicegi C N, Hohit 17, Kfar Vradim 25147, Israel, [email protected]
Mr. Azenkot Asher, 7 Talmit st. P.O.Box 2102 Ramat Yishai 30095 Israel,
Dr. Barak Eran, Haifa Chemicals Ltd. P.O.Box 10809, Haifa Bay 26120, Israel,
Dr. Bar-Tal Asher, Agricultural Research Organization, Volcani Center, P.O.Box 6, Bet Dagan 50250 Israel, [email protected]
Dr. Bonfil David J., Agricultural Research Organization, Gilat Center 85280, MP Negev 2 Israel, [email protected]
Mr. Carmi Ofir, Haifa Chemicals Ltd. P.O.Box 10809, Haifa Bay 26120 Israel Ms. Cohen Anat, Fertilizers and Chemicals Ltd., P.O.Box 1428, Haifa 31013, Israel,
Dr. Cohen Yafit, Agricultural Research Organization, Volcani Center, P.O.Box 6, Bet Dagan 50250, Israel, [email protected]
Mr. Danilov Yuri, Commonsensor Ltd., Nir Banim D.N Lachish 79525, Israel,
Mr. Dayan Shahar, Haifa Chemicals Ltd., P.O.Box 10809, Haifa Bay 26120, Israel
Prof. Delwiche Michael, Dept. of Biological and Agricultural Engineering, University of California, 2030B Bainer/3048 Bainer Hall Davis, CA 95616 USA,
163
Prof. Dilek Anac, Ege University, Ziraat Fakultesi 35100 Bornov , Izmir Turkey,
Mr. Eisenstadt Yoram,18 Martin Bover st. Haifa 34861, Israel
Prof. Eryuce Nevin Ege, University Ziraat Fakultesi35100, Bornov , Izmir Turkey,
Mr. Golan Raphael, Agro-Tech. Dep., Manager Plastro, Kibbutz Gvat, Israel,[email protected]
Mrs. Govrin Ifat , Netafim Kibutz Magal, D.N Heffer 38845, Israel,
Mr C K Greidinger, Dahlia Greidinger Fertilizer Research, Fund P.O.Box 4388,
Haifa 31043, Israel
Prof. Hagin Josef, Grand Water Research Institute Technion – I.I.T Haifa 32000 Israel,
Prof. Hongwei Tan, 174 Da Xue Road Soil and Fertilizer Institute ,Guangxi Academy of Agricultural Sciences Nanning City, Guangxi, P.R China, [email protected]
Dr. Imas Partricia, ICL Fertilizers Potash House, P.O.Box 75, Beer Sheva 84100, Israel,
Prof. Kafkafi Uzi, Faculty of Agriculture, Hebrew University, P.O.Box 12,
Rehovot 76100, Israel, [email protected]
Mr. Kalyan Gershon, Fertilizers and Chemicals Ltd., P.O.Box 1428, Haifa 31013, Israel,
Mr. Katina Yaron, Netafim, Kibutz Magal, D.N Heffer 38845, Israel,
Prof Katkat Vahap, Dep. Of Soil Science, Faculty of Agriculture, Uludag University, 16384 Gorukle, Bursa.Turkey, [email protected]
Dr. Klein Isaac, Agricultural Research Organization, Volcani Center, P.O.Box 6,
164
Prof. Linker Raphael, Faculty of Civil and Environmental Engineering, Technion – I.I.T Haifa 32000, Israel, [email protected],
Mrs. Lowengart Anat , P.O.Box 1197, Kfar Vradim 25147, Israel,
Mr. Menashe Yosi, Ministry of Agriculture, Extension, Mountain & Plain Region, P.O.Box 30, Bet Dagan 50250, Israel, [email protected]
Dr. Meron Moshe, Migal-Galilee Technology Center, P.O.Box 831,
Kiryat Shmona 11016, Israel, [email protected]
Prof. Miller Tony, CPI Division, Rothamsted Research Harpenden Hertfordshire AL5 5HH United Kingdom, tony.miller@ bbsrc.ac.uk
Dr. Minz Dror, Agricultural Research Organization, Volcani Center, P.O.Box 6,
Bet Dagan 50250, Israel, [email protected]
Mr. Mossak Isaias, 37/35 Kadesh St., Ashkelon 78501, Israel
Mr. Mufradi Israel, Agricultural Research Organization, Gilat Center 85280,
MP Negev 2, Israel, [email protected]
Mr. Nathan Roberto, Ministry of Agriculture Extension, Mountain & Plain Region, P.O.Box 30, Bet Dagan 50250, Israel, [email protected]
Prof. Neumann Peter, Faculty of Civil and Environmental Engineering, Technion – I.I.T, Haifa 32000, Israel, [email protected],
Mr. Pimstein Agustin, Blaustein Institute for Desert Research, Ben Gurion Univ. of the Negev, Beer Sheva 84990, Israel, [email protected]
Dr. Plaut Zvi, Agricultural Research Organization, Volcani Center P.O.box 6,
Bet Dagan 50250, Israel, [email protected]
Dr. Polak Ami, Haifa Chemicals Ltd. P.O.Box 10809 Haifa Bay 26120 Israel
Prof. Porterfield D. Marshall, Department of Agricultural & Biological Engineering, Purdue University, 225 South University St., West Lafayette, In 47907-2093, USA,
165
Mr. Raber Dubi, Ministry of Agriculture ,Extension, Mountain & Plain Region, P.O.Box 30,Bet Dagan 50250, Israel, [email protected]
Mr. Redel Alon, Fertilizers and Chemicals Ltd., P.O.Box 1428, Haifa 31013, Israel,
Mr. Ronen Eyal, Haifa Chemicals Ltd., P.O.Box 10809, Haifa Bay 26120, Israel Dr. Sacks Mollie Ministry of Agriculture Extension, Mountain & Plain Region, P.O.Box 30, Bet Dagan 50250, Israel, [email protected]
Prof. Schechter Israel, Faculty of Chemistry, Technion – I.I.T, Haifa 32000, Israel,
Prof. Schnug Ewald, Federal Agricultural Research Centre Institute of Plant Nutrition and Soil Science, FAL Bundesallee 50 38116 Braunschweig, Germany,
Prof. Schoenau Jeff ,. Dept. of Soil Science College of Agriculture and Bioresources, Univ. of Saskatchewan 51, Campus Drive Saskatoon, SK S7N 5A8 Canada,
Mr. Schweitzer Avi, Netafim, Kibutz Magal, D.N Heffer 38845, Israel
Mr. Sela Eitan, Agricultural Research Organization, Volcani Center, P.O.box 6,
Bet Dagan 50250, Israel, [email protected]
Mr. Segev Dekel, Netafim, Kibutz Magal, D.N Heffer 38845, Israel
Mrs. Semiat Rina , Technion, 2 Shazar St., Haifa 34861, Israel, [email protected]
Prof. Shaviv Avi, Faculty of Civil and Environmental Engineering, Technion- I.I.T, Haifa 32000, Israel, [email protected],
Prof. Shoshani Maxim, Faculty of Civil and Environmental Engineering, Technion – I.I.T Haifa 32000, Israel, [email protected]
Mr. Speiler Gideon, P.O.Box 285, Modiin, Israel, [email protected]
Mr. Tzori Moshe, Commonsensor Ltd., Nir Banim, D.N Lachish 79525, Israel,
166
Prof. Van Es Harold, Dept. of Crop and Soil Sciences, Cornell University,
1005 Bradfield Hall, Ithaca, New York, USA, [email protected]
Prof. Wang Ning, Biosystems and Agricultural Engineering, Division of Agricultural, Sciences and Natural Resources, 111 Ag Hall | Stillwater , OK 7407, U.S.A
Prof. Naiqian Zhang, Dept. of Biological and Agricultural Engineering, Kansas State, University Manhattan, Kansas 66506, U.S.A.,[email protected]
Prof. Zur Benjamin, Faculty of Civil and Environmental Engineering, Technion – I.I.T Haifa 32000, Israel, [email protected]