DEPARTMENT OF INFORMATION ENGINEERING AND COMPUTER SCIENCE
ICT International Doctoral School
A Data Analytics Framework for
Physiological Signals from
Wearable Devices
Andrea Bizzego
Advisor
Dr. Cesare Furlanello
Universit`a degli Studi di Trento
Disclaimer
The work presented in this PhD thesis has been funded by a
Abstract
Wearable devices have emerged as the most innovative opportunity to en-able acquisition and quantification of physiological signals in real-world in-door or outin-door contexts. However, their use in research should be based on a reproducible analytics process, ensuring that all the critical steps in data collection and processing are managed in a reliable experimental setup. The aim of this thesis is to investigate the actual value and technical lim-itations of wearable devices for their use in a research context, such as physiological monitoring of sleep and crying states in infants, of parenting of typical or atypical children, synchrony in educational contexts, and of fa-tigue patterns in outdoor sport activity, e.g. skiing. The thesis describes an approach and solutions that aim to compensate the effects of such technical limits. Besides providing a set of appropriate signal processing algorithms, a real-life sensing architecture is designed and implemented enabling syn-chronized acquisition from multiple subjects and multiple sensors, including cardiac signals, electrodermal activity and inertial data streams. The sig-nal processing pipeline and the real-life sensing architecture are merged in a unique data analytics framework (Physiolitix). The framework is validated on a fairly wide range of sensors, including medical quality multi-sensor smartwatches and smart textile garments applied in diverse research con-texts. In particular, a calibration dataset is developed to compare wearable and clinical devices in an affective computing task. We found that wear-ables can be employed as a valid substitute for medical quality devices with the help of adequate signal processing and machine learning solutions. Keywords
wearable devices, physiological signal processing, affective computing,
Contents
1 Introduction 1
2 Physiolitix 5
2.1 Wearable Devices for research . . . 6
2.1.1 Physiological signals and sensors . . . 8
2.1.2 Technical aspects . . . 13
2.1.3 Issues intrinsic to WD usage . . . 17
2.1.4 Existing platforms . . . 20
2.2 Result: Physiolitix . . . 21
2.2.1 PhysioREC: real-life sensing . . . 22
2.2.2 PhysioBackend . . . 28
2.3 Discussion . . . 30
3 pyPhysio 33 3.1 Physiological Signal Processing . . . 34
3.2 Structure of pyPhysio . . . 36
3.2.1 class Signal . . . 36
3.2.2 class Algorithm . . . 38
3.3 Physiological signals . . . 39
3.3.1 Cardiac signals . . . 41
3.3.2 Electrodermal Activity . . . 41
3.4 Discussion . . . 42
4 WCS dataset 45 4.1 Devices and architecture . . . 46
4.1.1 Selection of WDs . . . 46
4.1.2 The baseline: Thought Technology FlexComp . . . 48
4.1.3 Empatica E4 . . . 49
4.1.4 ComfTech HeartBand . . . 50
4.1.5 PhysioREC . . . 51
4.2 Synchronization . . . 52
4.3 Experimental phases . . . 53
4.3.1 Baseline and moving . . . 53
4.3.2 Stimulation . . . 54
4.4 Results . . . 56
4.5 Discussion . . . 57
5 Reproducibility 59 5.1 Modeling and validation . . . 62
5.1.1 Definition of problem . . . 63
5.1.2 Signal processing pipelines . . . 63
5.1.3 Machine Learning pipeline . . . 65
5.1.4 Classification performances . . . 67
5.2 Results . . . 69
5.2.1 Comparison with background studies . . . 69
5.2.2 Performances on WCS-Medical . . . 72
5.2.3 Performances on WCS-WDs . . . 72
5.3 Discussion . . . 73
6.1.1 Aim of the study . . . 78
6.1.2 Materials and methods . . . 79
6.1.3 Results . . . 80
6.1.4 Conclusions . . . 81
6.2 Fatigue in skiers . . . 82
6.2.1 Aim of the study . . . 82
6.2.2 Materials and methods . . . 83
6.2.3 Results . . . 86
6.2.4 Conclusions . . . 87
6.3 Response to infant crying . . . 89
6.3.1 Aim of the study . . . 90
6.3.2 Materials and methods . . . 90
6.3.3 Results . . . 91
6.3.4 Conclusions . . . 92
6.4 Synchrony in music-therapy . . . 93
6.4.1 Materials and methods . . . 93
6.4.2 Initial and expected results . . . 94
7 Conclusions 97 Bibliography 101 A DBD Algorithm 121 A.1 Beat detection pipeline . . . 124
A.1.1 Oversampling . . . 124
A.1.2 Energy estimation . . . 124
A.1.3 The DBD algorithm . . . 126
A.1.4 The RCO algorithm . . . 127
A.2 Materials and methods . . . 130
A.3 Results . . . 132
A.3.1 Results on Fantasia dataset . . . 133
A.3.2 Results on WCS dataset . . . 133
A.4 Discussion . . . 136
B Phasic estimation 139 B.0.1 Notation . . . 141
B.1 Loss function . . . 142
B.1.1 Stage 1: Identification of peaks . . . 144
B.1.2 Stage 2: Detrending . . . 145
B.1.3 Stage 3: Computation of energy . . . 146
B.2 Estimation of PSR component . . . 146
B.2.1 Stage 1: Identification of candidate peaks . . . 147
B.2.2 Stage 2: Identification of onset and termination in-stants . . . 147
B.2.3 Stage 3: Interpolation . . . 147
B.3 Materials and Methods . . . 147
B.3.1 Metrics . . . 148
B.3.2 Processing procedure . . . 148
B.4 Results . . . 150
B.5 Discussion . . . 152
C Wearable Devices 155 C.1 Empatica E4 . . . 155
C.2 Mio Alpha 2/Link . . . 156
C.3 ComfTech smart garments . . . 157
C.4 Interaxon Muse . . . 157
C.5 Emotiv Epoc/+ . . . 158
D pyPhysio tutorial 159
D.1 Signals in pyPhysio . . . 159
D.1.1 EvenlySignal . . . 160
D.1.2 UnevenlySignal . . . 163
D.1.3 Segmentation of signals . . . 165
D.2 Algorithms in pyPhysio . . . 166
D.2.1 Filters . . . 167
D.2.2 Estimators . . . 168
D.2.3 Indicators . . . 169
D.2.4 Tools . . . 170
D.3 Pipelines in pyPhysio . . . 171
D.3.1 ECG processing pipeline . . . 173
List of Tables
3.1 Main physiological indicators provided by default in pyPhysio 40
3.2 Algorithms provided in pyPhysio, grouped by type of signal 40
4.1 Sessions of the experiment to create the WCS dataset. . . 53
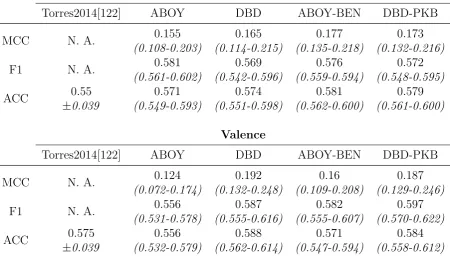
5.1 Summary of main state-of-art accuracies for the recognition
of arousal and valence based on the DEAP dataset. BVP:
Blood volume pulse; EDA: Electrodermal activity; RESP:
Respiration; ST: Skin temperature; EMG: Electromyogram,
EMGz: EMG of the Zygomaticus muscle, EMGt: EMG of
the Trapezius muscle; EEG: Electroencephalogram; HMM:
Hidden Markov Model . . . 61
5.2 Source datasets, physiological signals and processing
pipe-line applied: ABOY [1], DBD (see Appendix A), BEN [13],
PKB (see Appendix B), APK: adaptaive peak detection . . 65
5.3 Classification performances achieved on the DEAP dataset
with LOO CV scheme according to different pipelines. . . . 70
5.4 Classification performances achieved on the DEAP dataset
with 10x5 CV scheme according to different pipelines. . . . 71
5.5 Classification performances of four different pipelines for the
5.6 Classification performances achieved on the WCS-E4 and
WCS-HB subsets with 10x5 CV scheme according to
differ-ent pipelines. . . 73
6.1 Confusion matrix from internal Out-Of-Bag of
RandomFor-est classification of infant behavioural states. . . 81
6.2 Summary of input data for the detection of fatigued states
from inertial signals. . . 85
6.3 Number of samples for each subject and class. . . 85
6.4 Summary of input data for the detection of fatigued states
from inertial signals. . . 87
B.1 Symbols used to indicate the main signals or signal
compo-nents computed in the pipeline. . . 142
B.2 Values of estimated Bateman parameters for the subjects in
the DEAP dataset, according to different pipelines . . . 151
B.3 Values of estimated Bateman parameters for the subjects in
List of Figures
2.1 Representation of a Body Sensor Network within a
multi-modal experiment setting with three wearable devices and
two subjects. In general, a wearable device embeds multiple
sensors to acquire diverse physiological signals. The
smart-phone, which also embeds additional sensors, serves as Body
Central Unit thanks to functionalities provided by a specific
app (PhysioREC logo is shown here). . . 7
2.2 Effects of sampling frequency on the estimated IBI series
(top row), a frequency domain HRV indicator (normalized
HF, middle row) and a time domain HRV indicator (RMSSD,
bottom row). On the left: absolute values from the
origi-nal sigorigi-nal (blue) and from its down-sampled version (128
Hz, red); on the right: relative differences between the two
signals (note the different scale on the top plot) . . . 14
2.3 Overview of Physiolitix architecture . . . 21
2.4 Overview of PhysioREC User Interface. From left to right:
login screen with authentication, activation of input and
output modules, acquisition screen , real-time plots of signals. 23
2.5 Integrayion of WDs into PhysioREC . . . 26
2.6 Web-interface showing a list of sessions for a single
3.1 Three steps of physiological signal processing (top) and an
example on a Blood Volume Pulse signal (bottom):
origi-nal sigorigi-nal (left), after preprocessing (middle left), result of
beat detection (middle right) and computed physiological
indicators of Heart Rate Variability (right). . . 34
3.2 Representation of a generic algorithm characterized by the
computational function F and its parameters p. . . 38
4.1 Illustration showing the devices used for the acquisition of
physiological signals. A: Thought Technology FlexComp
(picture from www.thoughttechnology.com) with four wired
sensors: a) Electrodermal activity, b) Blood Volume Pulse,
c) Electrocardiogram, d) Respiration; B: Empatica E4
(pic-ture from www.empatica.com); C: ComfTech HeartBand. . 51
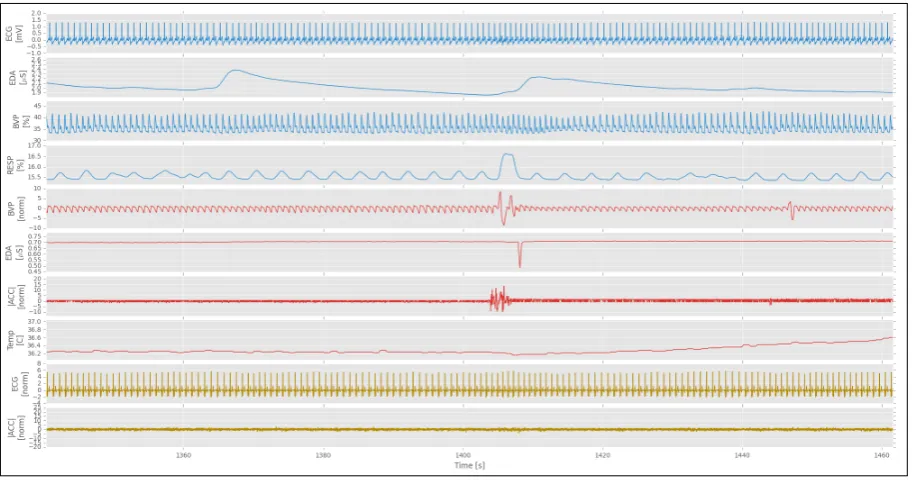
4.2 A 120 seconds length segment of WCS signals. Blue: signals
collected with medical-grade device (FlexComp); Red:
sig-nals collected with Empatica E4; Yellow: sigsig-nals collected
with ComfTech HeartBand. Note effects of body movements
on the BVP signal of Empatica E4 due to a sudden chest
movement (probably a cough) observable in the central part
of the plot (respiration signal) and on the module of
5.1 The ML pipeline for unbiased classification proposed within
the SEQC/MAQC-III consortium [110]. In (a) the input
dataset is split into 5 subsets (folds), maintaining the class
stratification. A fold is kept for test, the remaining are used
to train the model in the following steps. In b) a first
pre-dictor is used to optimize the parameters of the model by
grid-search. An internal CV (e.g. 10x2-CV) is used to avoid
overfitting. The tuned classifier is used to estimate the
fea-ture ranking (c). A second predictive model is defined (d),
taking in input a reduced set of features (selected by
pre-vious ranking). Its performance is evaluated on the test
set (e). The step is iterated considering an increasing
num-ber of features. The whole procedure is performed over all
the folds and repeated 10 times to evaluate the overall
per-formance of the model (e.g. MCC, Accuracy), the overall
feature ranking and its stability over the iterations. . . 68
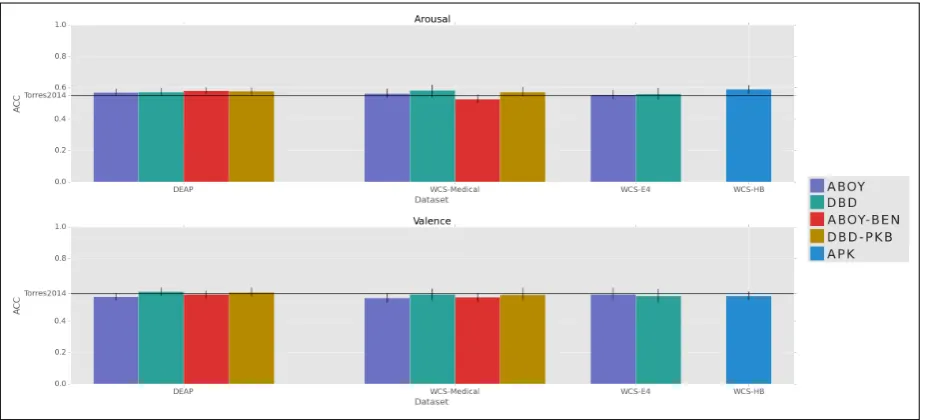
5.2 Overall accuracy on all datasets. 95% Confidence intervals
computed by Student’s bootstrapping. . . 70
6.1 An HRV analysis pipeline available through the Physiolyze
web interface. Three processing steps (preprocessing, HRV
index extraction, predictive modeling) are linked together
to form the workflow in the central panel. Panel on the
right allows setting module parameters: parameters for HRV
index extraction are shown here. . . 80
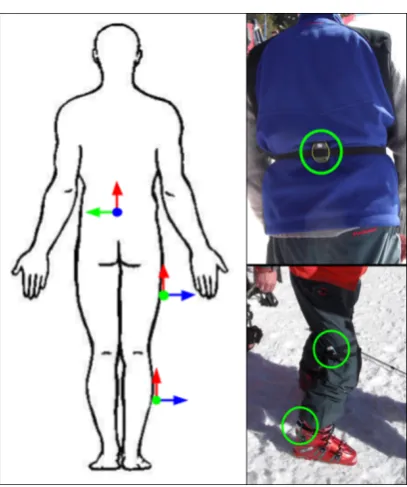
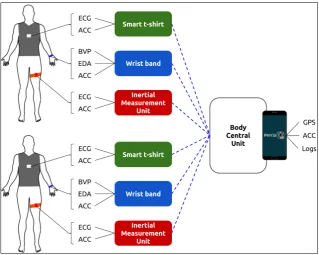
6.2 Setup of the Body Sensor Network composed of 3 Inertial
Measurement Units: on the back, right thigh and right leg.
Left: orientation of sensors; right: positioning during a pilot
6.3 Differences in IBImean between types of parents. . . 92
6.4 A frame of the video of the music-therapy session, showing
two children with ASD (left and right) and the therapist
(middle) while playing drums. Graphs on the left-bottom
of the figure show the average IBI (RR mean) for each
sub-ject: therapist (blue), child on the right (green) and child on
the left (red) during the entire session. The instant
corre-sponding to the showed frame is identified by the vertical red
line. Vertical bars on the bottom-right show current levels
of synchrony: between Therapist and Child1 (left), between
Therapist and Child2 (middle) and between the two
chil-dren (right). Here an high level of physiological synchrony
is found between the two children who are coordinated in
playing drums together. . . 95
A.1 Overview of the DBD algorithm with the four processing
stages. . . 126
A.2 Steps of stage 3 to identify t0i. From top to bottom: a)
identification of the maximum tpi and tpi −0.25 on the
fil-tered signal xf(t) ; b) identification of the maximum of the
derivative of the signalxn−xn−1 in the intervaltpi−0.25, tpi;
c) identification of the local minimum of|ds(t)/dt| in the
in-terval [tmi, tpi], corresponding to t0i, the percussion peak in
the original signal (d). . . 128
A.3 Performances of IBI detection on the Fantasia dataset. . . 133
A.4 BA ratio of HRV indicators on the Fantasia dataset. . . 134
A.5 Performances of IBI detection on the BVP from the
Flex-Comp (left) and E4 (right) during baseline (top) and move
A.6 BA ratio of HRV indicators on the BVP from the FlexComp
(left) and E4 (right) during baseline (top) and move
(bot-tom) portions. Vertical scale is limited to the interval [0,2]
for clarity. . . 135
B.1 Flow charts of the two novel algorithms introduced in this paper: A) peak based loss function and B) derivative-based phasic estimation. . . 141
B.2 Effects of wrong estimates ofτ1 andτ2 on the recovery part of the resulting deconvolved signal. Top row: effects of smaller (left) and greater (right) values of τ1; bottom row: effects of smaller (left) and greater (right) values of τ2. Signals have been normalized to have a maximum amplitude of 1. . . . 144
B.3 Detrending in case of non overlapping (A) and overlapping (B) peaks. . . 146
B.4 Performances of the three pipeline on the DEAP dataset. By subject (left) and overall distribution (right). . . 150
B.5 Performances of the three pipelines on the WCS dataset. By subject (left) and overall distribution (right). . . 150
C.1 Wearable devices tested in this work. . . 156
D.1 Plot of the EvenlySignal created in Listing D.2 . . . 161
D.2 Plot resulting from Listing D.3. Note the different starting time of the two signals. . . 163
D.3 Plot resulting from Listing D.5 . . . 166
D.4 Plot resulting from Listing D.8 . . . 168
D.5 Plot resulting from Listing D.9 . . . 169
D.6 Plot resulting from Listing D.11 . . . 171
D.7 Plot resulting from Listing D.15 . . . 175
D.9 Plot resulting from Listing D.17 . . . 177
D.10 Plot resulting from Listing D.21 . . . 179
List of abbreviations
ACC Acceleration
ANS Autonomic Nervous System
ASD Autism Spectrum Disorders
BCU Body Central Unit
BLE Bluetooth Low Energy
BSN Body Sensor Network
BVP Blood Volume Pulse
CV Cross Validation
DSP Data Streaming Protocol
DBD Derivative Based Detection
EDA Electrodermal Activity
ECG Electrocardiogram
EEG Electroencephalogram
GPS Global Positioning System
HRV Heart Rate Variability
HF High Frequencies
IBI Inter Beat Interval
IMU Inertial Measurement Unit
LOO Leave One Out
LF Low Frequencies
MCC Matthew Correlation Coefficient
MEMS Micro-Electromechanical Systems
ML Machine Learning
PPG Photoplethysmography
RCO Reverse Combinatorial Optimization
RMSSD Root Mean Square of Successive Differences
SDK Software Development Kit
SNR Signal-Noise Ratio
SVM Support Vector Machine
TSR Tonic Skin Response
Chapter 1
Introduction
Physiological signals allow clinicians to diagnose or to monitor the health
status of patients, but they also provide an effective insight into the
psycho-physiological regulatory mechanisms that allow an individual to adapt to
environmental changes and to react to external stimuli [68, 70]. Born as
a tool-set belonging to medical sciences to screen the vital signs, thanks
to the development of wearable technologies [85, 25], the acquisition and
quantification of physiological signals is nowadays affordable in a much
wider range of contexts, from personal uses to industrial and scientific
research.
Indeed, wearable technologies represent a great opportunity for the
sci-entific community to deepen the study of human physiology and behavioral
responses by paving the way for a new generation of experiments in which
long-term monitoring and real-life ecological acquisitions are a key aspect.
In particular, a decrease in obtrusiveness on subject’s behavior and daily
activities is expected by adopting wearable technologies instead of clinical
devices [41].
A trade-off between the two options is however undeniable. Wearable
solutions have a lower cost and higher portability than medical-grade
CHAPTER 1. INTRODUCTION
contrast, the data quality that can be achieved is lower, subject to artifacts
due to body movements and data losses [129].
Several attempts have been performed to adopt wearable sensing devices
for research, with substantial differences in the type of technical solution.
For instance, a number of studies is focused on creating and validating
novel ad-hoc device [8, 53, 27], others adopt medical-grade devices [40] or
sensor platforms [26, 99]. Although these solutions can be considered
wear-able, as the sensing unit is a miniaturized, battery-supplied board, they
still require an experimenter for setup (e.g. placement of electrodes, start
of acquisition). Further, only recent devices allow real-time streaming of
collected data. In addition, they require the presence of a supporting
sys-tem such as: a workstation with software available for download, decode
and export the data to files, software to set sensor parameters (e.g.
sam-pling frequency, full scale range), hardware components (e.g. electrodes,
sensors), communication module and protocol (e.g. Bluetooth).
There-fore, they are portable but limited to specific in-lab experiments and they
are not suitable for daily life applications. Instead, in this work we focus
on off-the-shelf devices designed for autonomous, continuous and real-life
monitoring of physiological signals which could be setup and activated by
the subject itself.
In contrast to growing market availability, broad adoption of these types
of wearable devices (WDs) in research [97, 108] is still limited as prevented
by two main facts:
1. Existence of different solutions: many manufacturers provide diverse
products which differs in terms of both technological specifications
and protocols to control the device and access the data. Lack of a
common standard and fragmentation of supporting tools represent
an issue to researchers who look for a unified framework where to
CHAPTER 1. INTRODUCTION
2. Unvalidated reproducibility: quality of acquired data is usually
ver-ified by the manufactures but seldom validation data is provided or
signals compared to medical-grade device. Thus, it often remains
un-verified whether WD are able to reproduce scientific studies based on
medical-grade devices;
The main aim of this work is to enable usage of WDs in research by
addressing such key limitations. Two objectives are pursued: first is to
develop a unified framework to support the acquisition and processing of
signals from Body Sensor networks (BSNs), second is to assess the
repro-ducibility of studies based on WDs, focusing in particular on an affective
computing task.
To deal with existence of different devices and protocols, we developed
a real-life sensing platform, composed of a software architecture to enable
and control Body Sensor Networks (Physiolitix) and a Python package for
signal processing (pyPhysio). By the use of these tools we were able to
col-lect the Wearable and Clinical Signals (WCS) dataset which can be used to
compare and to assess reproducibility of algorithms on signals from WDs.
The experiment reproduced the DEAP dataset [67] designed for emotion
recognition based on physiological signals. Based on the WCS dataset and
the processing pipelines appositely developed we were able to assess, in
a condition of limited movements, that WDs allow the reproducibility of
state-of-art results [67, 122].
Many scientific fields can benefit from the output of this work: for
in-stance, psycho-physiology and affective computing researchers can expand
the fields of application to real-life contexts and with increasing number of
participants. Clinicians and medical researcher also can rely on WDs to
re-lease home health care solutions with continuous monitoring protocols and
remote assistance. We applied this framework to heterogeneous studies
detec-CHAPTER 1. INTRODUCTION
tion of fatigue in skiers by inertial data, analysis of physiological response
of parents to infant crying and physiological synchrony between therapist
and patient affected by Autism Spectrum Disorders (ASD) during a
music-therapy session.
In the following chapters we describe the technological and scientific
re-search we conducted to develop a unified framework for acquisition,
analy-sis and validation of signals from WDs. In particular, Chapter 2 is devoted
to give the technological and scientific background about real-life
sens-ing and describe the Physiolitix platform. In Chapter 3 we introduce the
Python package pyPhysio, developed for processing heterogeneous types
of physiological signals with both general purpose (e.g. filters) as well as
signal-specific algorithms (e.g. estimators for beat detection). The
exper-imental settings and design to create the WCS dataset are presented in
Chapter 4. Chapter 5 presents the methodological approach adopted to
validate WDs as able to reproduce a standard affective computing task
with results. In Chapter 6 we describe four case studies in which the
pro-posed framework has been adopted and in Chapter 7 we summarize and
Chapter 2
Introducing Physiolitix: a platform
for real-life acquisition of
physiological streams
from wearable devices
In a general sense, Wearable Devices (WDs) are portable, non-invasive
de-vices that allow the acquisition of physiological signals during daily life,
with no need of external equipment [11, 85]. It is interesting to note that
the application of WDs is boosted by their improved portability
(increas-ing miniaturization and battery life) [27], as well as on new materials and
layouts that improve the portability (e.g.: epidermal tattoos [8]) and
de-crease the invasiveness (e.g. wireless ring pulse oximeter [55]). Such new
design solutions support the concept of Body Sensor Network (BSN) and
the more general concept of “Body Computing” [2, 52]. The current
im-plementation of a BSN is that of a set of sensors, which send data to a
central device that manages data acquisition, synchronization and storing
[130, 83, 41] on a local file-system or on a cloud service.
Beside several advantages, WDs present also technical limitations which
2.1. WEARABLE DEVICES FOR RESEARCH CHAPTER 2. PHYSIOLITIX
based on WDs. In this chapter we thoroughly describe and discuss main
technological aspects associated to WDs (see Section 2.1). We first present
a list of physiological signals of interest and associated sensing
technol-ogy currently embedded in commercial devices; then we analyze technical
limitations and consequent issues related to signal collection. Finally, in
Section 2.2 we present Physiolitix: the proposed solution to enable real-life
sensing from multiple WDs.
In this thesis, we adopt the following standard terms:
• Wearable device (WD): the technological support embedding one
sen-sor or more and meant to be worn (e.g. t-shirt, band, smartwatch);
• Sensor: the technological component that measures a physical
quan-tity and is embedded in a WD. When referring to an implementation
into a wearable device, this is indicated as Wearable Sensor (WS), to
distinguish from the general technological component (sensor);
• Multi-sensor WD: WD that embeds multiple sensors (e.g. a
smart-watch);
• Sensing architecture: the chain of components involved in the data
acquisition process, composed of: sensor, embedding support,
trans-mission/storage, control unit and cloud.
• Sensor network: a set of wearable devices used in the same data
acqui-sition. We will focus on the concept of Body Sensor Network (BSN),
to develop the main notions.
2.1
Wearable Devices for research
In this section we illustrate the key concepts needed to understand and
physio-CHAPTER 2. PHYSIOLITIX 2.1. WEARABLE DEVICES FOR RESEARCH
Figure 2.1: Representation of a Body Sensor Network within a multi-modal experiment setting with three wearable devices and two subjects. In general, a wearable device embeds multiple sensors to acquire diverse physiological signals. The smartphone, which also embeds additional sensors, serves as Body Central Unit thanks to functionalities provided by a specific app (PhysioREC logo is shown here).
logical phenomena that are measured (Subsection 2.1.1) to introduce more
technical aspects associated to the sensing part (Subsection 2.1.2) and the
issues that are addressed in this work 2.1.3.
When multiple WDs are used simultaneously, they form a BSN (see
Figure 2.1). The standard BSN structure is a star network topology where
the star tips nodes are represented by the WDs, the central node, called
the Body Central Unit (BCU), is the device that works as a data gateway.
The edges between the tips and the hub are the connections which are
usually based on Bluetooth technology.
The BCU controls the nodes and receives sensor stream through the
con-nection, ensuring that data is consistently persisted and all WDs are
work-ing correctly. This coordination capacity is provided by the app present
2.1. WEARABLE DEVICES FOR RESEARCH CHAPTER 2. PHYSIOLITIX
being able to collect more than one signal. Eventually this configuration
can be replicated on multiple subjects, thus creating the more complex
and more general case of BSN with multi-modal (i.e. multiple signals) and
multi-subject configuration (see Figure 2.1).
2.1.1 Physiological signals and sensors
In this subsection we introduce the main physiological phenomena of
in-terest for this work. For each physiological phenomenon we give a brief
description of measured signal and main sensing solutions. For each signal
we also provide a list of recent scientific works to illustrate the main fields
of application.
Cardiac Activity
The cardiac muscular cells are controlled both by the branches of the
Auto-nomic Nervous System (ANS) the parasympathetic and by the sympathetic
systems. The first acts to decrease the Heart Rate (HR) and is the
princi-pal actor in resting and quiet conditions. In contrast, the complementary
sympathetic system increases the HR and acts to prepare the body to face
threatening situations. Heart Rate Variability (HRV) analysis is the study
of the variations of the Heart Rate (HR) [76]: due to the conjunct influence
of the parasympathetic and sympathetic systems, the analysis of HRV
indi-cators is then used to investigate human emotions from a physiological
per-spective [68]. Two sensing technologies are currently available to acquire a
cardiac signal with WDs: Electrocardiography-based (ECG-based) sensors
and Photoplethysmography-based (PPG-based) sensors. ECG-based
sen-sors detect the electrical potential generated during the contraction of the
cardiac muscular cells. The signal acquired with a ECG-based sensor is
called Electrocardiogram (ECG). This is a mature technology, but it lacks
CHAPTER 2. PHYSIOLITIX 2.1. WEARABLE DEVICES FOR RESEARCH
the clothes. To overcome these problems, PPG-based sensors have been
recently introduced as embedded in wrist-band devices or smart watches.
These devices are equipped with pairs of Light Emitting Diodes (LEDs)
and photo-diodes to detect the variation of blood volume in vessels through
variations in absorbed light. As the blood volume varies due to heart
con-traction, it is possible to observe the heart activity. Wearing these devices
is much more comfortable than chest bands, but the acquired signal can
be more sensitive to moving artifacts [129]. The signal acquired with the
PPG-based sensor is called Blood Volume Pulse (BVP).
Several studies used HRV analysis to investigate autonomic response, for
instance to detect stress [30] and cognitive workload in different conditions
[78, 123]. Esposito et al. [40] studied the calming effects induced in infants
by being carried or held by the mother. Parasympathetic-related HRV
indicators were significantly higher during carrying than during holding,
suggesting that infants are more relaxed in the first condition. Joosen et
al. [60] analyzed how the HRV of adults is influenced by the crying of
infants showing that effectiveness of this influence is related to maternal
sensitivity.
Electrodermal Activity
The Electrodermal Activity (EDA) is the variation of skin conductance.
It depends on the activity of the sweat glands which are under the
con-trol of the Sympathetic Nervous System (SNS). During stressful situations
the SNS elicits the sweating activity which in turn increases the skin
con-ductance that originates the measured signal [14, 104]. EDA comprises
two components: the Tonic Skin Response (TSR) and the Phasic Skin
Re-sponse (PSR). The TSR component reflects the physiological changes in
the secretory activity of the sweat glands. The PSR component is
2.1. WEARABLE DEVICES FOR RESEARCH CHAPTER 2. PHYSIOLITIX
waveform presents a peak due to the sweat gland activation, which overlaps
with the TSR component. The main signal processing approach to
inves-tigate EDA in association to ANS activation is possible by decomposing
the TSR and PSR components [13, 6, 4]. EDA is measured by applying
an electric potential between two electrodes which are in contact with the
skin. The measurement is highly sensitive to body movements, because a
subtle drift in the placement of sensors could expose a new area of the skin
to the contact with electrodes. The new skin can be considerably dryer
as it has not been previously in contact with electrodes. This could affect
the measurement of the EDA introducing sudden changes in the baseline
level. EDA sensors embedded in wristbands can be sensitive to this type
of noise. Clinical sensors use straps or other solutions to fix electrodes to
the fingers to be able to reduce sensor movements.
Being related to the sympathetic branch of the ANS, EDA has been
extensively used to investigate the psycho-physiological response to
ex-ternal stimuli. Hernandez at al. [54] used EDA analysis to investigate
the engagement of children during interactive playing session with adults.
Ruiz-Robledillo et al. [106] showed that caregivers of relatives with Autism
Spectrum Disorders (ASD) present lower EDA levels in response to
stress-ful events, suggesting the existence of an adaptation mechanism that allows
caregivers to habituate to stress. Also, EDA-derived features have been
ex-tracted and used to detect fatigue during driving [20] and to discriminate
stress from cognitive load in an office work related environment [111]. By
analyzing the EDA, Sano et al. were able to predict the onset of epileptic
seizures [89].
Brain activity
Brain activity is measured by detecting the electrical potential generated by
Electroencephalo-CHAPTER 2. PHYSIOLITIX 2.1. WEARABLE DEVICES FOR RESEARCH
gram (EEG) and typically multiple electrodes are placed in different points
of the scalp to observe activation of specific areas of brain cortex. Each
electrode is referred to a specific brain area which is associated to a
par-ticular brain function, allowing the analysis of brain activity and response
under different stimuli and tasks. The EEG signal is processed to extract
features able to measure the brain activity, for instance power in the brain
wave bands, fractal measures and Event Related Potentials (ERPs). The
complexity of the sensing equipment needed to acquire good quality
sig-nals limits the number of possible scenarios in which the EEG can be used.
However, new portable EEG devices with limited number of electrodes are
being introduced and allow raw measurements of EEG in daily life [102, 7].
The analysis of the brain activity has been used to identify and classify
emotions. Frantzidis and colleagues [43] extracted the spectral components
of EEG and amplitude and delay of detected ERPs to classify four
emo-tional states elicited by different visual stimuli. A similar approach has
been used by Jiang et al. [59], which integrated also the acquisition of eye
activity and facial expressions. Liu et al. [74] used Fractal Dimension of
EEG to define a subject-specific framework to classify emotions in
real-time. Results of the emotion recognition from EEG data have supported
the use of EEG as a potential communication channel to interact with
machines and communicate emotions [45].
Physical activity
Activity monitors acquire inertial (acceleration) and spatial (rotation,
po-sition) signals to measure body movements and human physical activity,
and are called inertial monitoring units (IMUs). The sensing component
is based on microelectromechanical systems (MEMS) sensors, which
pro-vide highly miniaturized solutions with relatively low energy requirements.
2.1. WEARABLE DEVICES FOR RESEARCH CHAPTER 2. PHYSIOLITIX
many other powered devices. IMUs have been extensively adopted in
scien-tific studies, in particular to analyze movement and the ambulatory process
[23]. They are also systematically considered to track the physical activity
of subjects in order to reach and maintain an active lifestyle [15].
Stereo-typed motor movements [92] are investigated to provide an index of severity
of Autism Spectrum Disorders.
Other physiological phenomena
Those listed in the previous subsections are the main physiological
phe-nomena commonly measured by WDs. However, other phephe-nomena of
in-terest can be measured, either by specific WDs or by applying appropriate
algorithms to derive new measurements from the collected signals. For
in-stance, advanced PPG sensors do also provide measurement of hemoglobin
saturation [55]. Breathing activity can be measured by acoustic sensors or
extracted with appropriate algorithms from the chest movements measured
by an IMU [69] or from cardiac signals, such as the BVP [75]. As
respi-ration patterns influence the cardiac activity and frequency of the heart
rate, adding the information regarding the breathing activity to the study
of HRV allows for a better insight into the autonomic regulation. For
in-stance, Valenza and colleagues [124] were able to improve the performance
of an emotion recognition quadratic discriminant classifier by embedding
cardio-respiratory coupling into the set of input features. WDs have also
been proposed to measure the muscular activity by Electromyographic
(EMG) sensors, for instance to recognize emotions from facial expression
[67] or hand gestures [62]. Further, recent trends in sensor technology and
research aim at integrating measurements of bio-chemical components on
CHAPTER 2. PHYSIOLITIX 2.1. WEARABLE DEVICES FOR RESEARCH
2.1.2 Technical aspects
Current technological research aims at increasing both miniaturization and
portability of sensors. On one side this enables easy-to-wear devices, signal
acquisition in ecological conditions and decreases obtrusiveness. As a major
drawback, miniaturization is a compromise in terms of signal efficiency,
thus of signal quality (signal noise ratio). In this subsection we consider
the main technical characteristics and constraints of WDs for physiological
signals and analyze their effects on the quality of the collected data.
Sampling frequency
All WDs are battery supplied. To increase autonomy, performances of
some sensor components are reduced to decrease battery consumption.
In particular, the sampling frequency is kept lower than medical-grade
devices, usually below 256 Hz. Also, performances of other components
are reduced, for instance LEDs light intensity in optical sensors and gain
of amplifiers.
The sampling frequency (fsamp) determines the maximal frequency
com-ponent that can be observed in the signal (also known as Nyquist
fre-quency). Further it also defines the minimum temporal resolution ∆t =
1/fsamp to discriminate events. For instance, for HRV analysis it is
recom-mended [76] to measure the distances between subsequent beats (or Inter
Beat Intervals, IBIs) with a resolution of milliseconds, hence requiring a
minimal sampling frequency of 1000 Hz, far more than what usual
wear-able sensors can provide. In some cases this limitation can be overcome
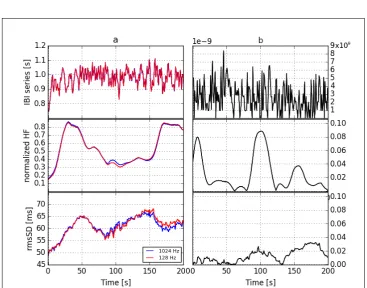
by over-sampling the signal at the processing stage. Figure 2.2 shows the
effect of lower sampling frequency on the computed IBI signal and HRV
2.1. WEARABLE DEVICES FOR RESEARCH CHAPTER 2. PHYSIOLITIX
Figure 2.2: Effects of sampling frequency on the estimated IBI series (top row), a frequency domain HRV indicator (normalized HF, middle row) and a time domain HRV indicator (RMSSD, bottom row). On the left: absolute values from the original signal (blue) and from its down-sampled version (128 Hz, red); on the right: relative differences between the two signals (note the different scale on the top plot)
CHAPTER 2. PHYSIOLITIX 2.1. WEARABLE DEVICES FOR RESEARCH
Embedding and sensor positioning
In order to favor wearability, some technical constraints are imposed, thus
WDs generate signals which have lower signal-noise ratio (SNR) than their
medical-grade counterpart. First, usually in WDs no aids are used to fix
the sensors to the body (e.g. adhesive ECG electrodes); instead they are
kept on position only by the elastic properties of the embedding support
(e.g. tissue of T-shirts, rubber band of bracelets).
However, minimal shifts of the sensors due to body movements that
can introduce noise on the acquired signal such as drops or sudden value
changes. Signal quality can also be influenced by a non optimal positioning
of the sensor: although some anatomical loci are more appropriate than
others for measuring the signal, the need of embedding the sensor in a
wearable and comfortable support might constrain the positioning to a
non-optimal locus where the signal magnitude might be lower, such as
the wrist instead of hand palm in the case of EDA [125]. Artifacts might
be generated by high or low dynamic body movements. High dynamic
movements (sudden movements and/or with high amplitude) may cause
the displacement of the sensors that are not strictly fixed to skin surface.
Artifacts appear as impulsive changes in the signal value that might cause
saturation or loss of signal In the case of low dynamic movements there is
no displacement of the sensor but the physiological measure is influenced
by inertial effects of body movements; in particular physiological blood
fluid dynamic is particularly sensitive to limb movements and changes in
body positions [87, 129, 126].
Autonomy
Capacity of internal memory should not affect the performances of a WD:
2.1. WEARABLE DEVICES FOR RESEARCH CHAPTER 2. PHYSIOLITIX
stored. However, some devices can also store data as a backup, thus would
need a large capacity for prolonged and high sampling frequency
acquisi-tions. More in general, lower energy requirements and battery capacity
directly affects the autonomy of the device and, consequently the
dura-tion of the acquisidura-tion. High capacity and rechargeable batteries would
represent the ideal solution, however their size is bigger and together with
recharging circuits they might increase substantially the dimension of the
WD. The choice of the streaming technology (e.g. by wireless connection)
determines further constraints to autonomy of the sensing architecture.
Bluetooth is the most common technology for WDs; only Bluetooth Low
Energy (BLE) allows significant reduction of battery consumption and
ex-tended the range. However, BLE is a quite recent technology and is not
extensively supported.
Signal quality characteristics
Technical characteristics account only partially in the evaluation of WDs.
Indeed, it is important to consider also the quality profile of signals
ac-quired with WDs. A first quality indicator is the signal stability, which
can be used as an overall estimate of the WD reliability. Several technical
causes (e.g. sensor disconnection, errors in the streaming protocol) can
contribute to affect the acquisition, which results in missing or incomplete
data. Second, it is fundamental to consider the sensitivity of the WD to
body movements and other causes that might reduce the SNR. A complete
evaluation of a WD should include testing for SNR in a typical
experi-ment. In summary, there are no general indicators for signal stability and
sensitivity able to quantify and compare performances of different WDs.
Instead, this evaluation should consider the specific needs of operating the
CHAPTER 2. PHYSIOLITIX 2.1. WEARABLE DEVICES FOR RESEARCH
2.1.3 Issues intrinsic to WD usage
Technical constraints described in the previous subsection (2.1.2) are
in-trinsic to physiological sensing based on WDs. Consequences of these
lim-itations can be partially addressed only by specific signal processing
tech-niques or adequate design and execution of the experiment. Further, in
this subsection we discuss three limiting factors that pertain to the usage
of WDs, independently of the type of sensor or technical characteristics:
1. Integration of different Data Streaming Protocols;
2. Signal synchronization;
3. Privacy and security.
Addressing and solving these three issues is the aim of the Physiolitix
platform proposed in Section 2.2.
Middle-/software characteristics
WDs are integrated in BSNs, up to fairly complex architectures, needed
when experiments involve multiple devices or more than one subject.
Typ-ically, each WD adopts a specific method to interface with the BCU or
other devices. We call this method Data Streaming Protocol (DSP) and
we intend the set of specifications that allow the BCU to communicate
with the WDs and interpret received messages.
The DSP can take different forms depending on the manufacturers of the
WDs, but in general it is often provided to allow researchers and developers
to build personalized software to be installed on the BCU to control the
WD. Alternatively, a proprietary app is usually provided with minimal
functions.
Depending on the commercial strategies the DSP is made available as
2.1. WEARABLE DEVICES FOR RESEARCH CHAPTER 2. PHYSIOLITIX
a set of tools for (i) development of software with a documented library to
manage the communication with the WD and (ii) development of a custom
interface to control the data acquisition. The protocol documentation,
instead, is the set of codes adopted in the streaming messages with the
corresponding meanings. It is provided to allow the development of
middle-layer software to correctly interpret the stream. Since every manufacturer
adopts different methods of delivering the data, a specific software solution
must be implemented for every protocol and SDK.
In summary, while on one side the DSP should facilitate access to sensor
data and control of acquisition, on the other side, the existence of numerous
solutions complicates the integration of the DSP, which is one of the major
issues for the development of a working sensing architecture for research
use.
Synchronization
Signals acquired simultaneously by the same BSN are likely going to be
analyzed together in order to contribute to the investigation of the same
phenomenon. This approach is usually called Data Fusion: for instance
accelerometer data are often used to improve the BVP signal quality by
canceling the noise caused by body movements [47, 119]. Results from
Data Fusion techniques might be dramatically affected by temporal
mis-alignment and it is thus fundamental that all acquired signals are
time-synchronized before any processing step. We call synchronization the
pro-cess of assigning to each sample in a signal a temporal reference called
’timestamp’. Hence, samples from different signals with the same
times-tamp can be assumes as they were generated simultaneously [16].
Again, the solution of the synchronization problem is complicated by
the existence of different technological implementations. Three main cases
CHAPTER 2. PHYSIOLITIX 2.1. WEARABLE DEVICES FOR RESEARCH
1. The WD embeds an internal clock which is used to provide an absolute
time reference and the clock can be set manually;
2. The WD embeds an internal clock which is used to provide an absolute
time reference but the manual set is not available;
3. No clock is embedded and the timestamp, if given, is represented by
a counter of generated samples, thus providing only a relative time
reference.
Except the third case, the synchronization would be possible by
esti-mating the time offset between each device. The time-offset between two
WDs might not be constant due to minimal variation in the clock pace; the
ratio between the pace of two clocks is called time-drift [112]. However, in
the case of short acquisitions this effect can be negligible and the time-drift
can be considered equal to 1.
A third technical element that prevents the correct synchronization is
the latency between the generation of the sample and the assignment of
the timestamp. Latency is affected by delays due to the initialization of
the sensor, to the communication mean or to the processing of the message
(both on the WD and BCU sides). Worst-case scenario is when the WD
does not embed a clock and the assignment of the timestamp takes place
on the BCU, as in such case all the causes contribute to increase latency.
Privacy and security
Physiological signals are sensitive personal data that require a specific
treatment in terms of data management and control of access. The use
of commercial applications provided by WD manufacturers represents a
serious threat to personal privacy as they allow no control on who has
access to the data. In particular, it is quite common that the acquired
2.1. WEARABLE DEVICES FOR RESEARCH CHAPTER 2. PHYSIOLITIX
they are stored and no control is left to the researcher who often is only
able to download the data. At the same time there is no control on the
procedure of data encryption. This aspect poses a significant obstacle to
the use of WDs for research as the experimenter is not able to guarantee
the protection of personal data and security.
2.1.4 Existing platforms
Notwithstanding the importance of WDs for research, a clear solution to
integrate physiological devices into a unique platform is still missing.
Cur-rently, the research is focusing on the general problem of integrating
mul-tiple sources of data connected to the internet, which compose of what is
known as the Internet-of-Things (IoT). One of the main goals is to
seam-lessly connect the many resources to a cloud service, in order to allow
real-time data analytics to generate new valuable information. Hence, is
then used as a feedback or a decision trigger [96]; however, the lack of a
standard protocol for communication and the existence of diverse
techno-logical solutions is still a major issue [35, 79, 18].
The solutions currently available are mainly represented by commercial
products. Although different in terms of features and scopes, they all
share the same key strategy of providing API1 for each specific device
while exposing a common interface to the developer.
In the medical and health-care field, current state-of-art is still focusing
on the identification of optimal architectures or paradigms regarding
im-plementation, but a working solution is still missing [103, 50]. In [28] Chen
and colleagues define various guidelines for the next generation of WDs,
which is projected to be based mainly on smart garments. In particular,
they propose to structure the architecture into three layers: (a) the
front-end or User Interface, to monitor the acquisition and provide feedback, (b)
1see, for instance:
CHAPTER 2. PHYSIOLITIX 2.2. RESULT: PHYSIOLITIX
the communication mean, centred on a smartphone and (c) the backend
represented by the cloud solution.
These three layers are exactly the three blocks that compose Physiolitix,
our solution for the integration of multiple WDs for research. Physiolitix
set out to represent one of the first working open-source platforms that aim
at solving the issues intrinsic to the WDs usage presented in the previous
section.
2.2
Result: Physiolitix
Physiolitix is a cloud-based framework to acquire, store and manage
phys-iological signals from WDs. Its main characteristic is flexibility in terms of
input sensors and application.
The Physiolitix architecture is composed of two main sections (see
Fig-ure 2.3):
1. PhysioREC: Android app for real life data acquisition;
2. PhysioBackend: cloud resource for the storage, processing and
web-access of experimental metadata and sensor data.
Figure 2.3: Overview of Physiolitix architecture
The PhysioREC data acquisition section is organized as BCU to which
Bluetooth-enabled devices can send data. The generic BCU device can
2.2. RESULT: PHYSIOLITIX CHAPTER 2. PHYSIOLITIX
manages the sensor data collection, synchronization and stream. It also
takes care of encrypting, compressing and sending data through a Wi-Fi or
3G/4G data connection to PhysioBackend. There, customizable pipelines
can be applied in real-time to data for downstream analysis, in particular
for extraction of physiological metrics and indicators. In the following
subsections we describe in detail the two components.
2.2.1 PhysioREC: real-life sensing
The PhysioREC Android app is the first element of Physiolitix architecture.
Its main goal is to provide a unified platform for sensor data acquisition
in multi-device experimental settings where two main issues arise: (a) the
existence of different data streaming protocols and (b) the synchronization
of signals from different sources. It also addresses the collateral problem
of (c) privacy of personal data and security of the data transmission.
Key components of PhysioREC are:
1. Input and output modules;
2. User interface;
3. A Core Flows-Management function.
Implemented Input and Output module
The Input and Output modules operate as interfaces to the variety of
ex-isting DSPs and WDs. An Input module is specifically developed for each
WD based on the existing method (SDK, protocol documentation)
pro-vided by the manufacturer to allow the connection between smartphone
and WD and the control of the data acquisition. The Input module
trans-lates the proprietary method into a set of predefined functions that are
CHAPTER 2. PHYSIOLITIX 2.2. RESULT: PHYSIOLITIX
Figure 2.4: Overview of PhysioREC User Interface. From left to right: login screen with authentication, activation of input and output modules, acquisition screen , real-time plots of signals.
allow the stream of the acquired data to different destinations, such as a
database or a real-time processing cloud service.
The Input modules developed so far include:
• AndroidDevice: to record logs, performance data and inertial signals
from sensors embedded on the smartphone;
• EmpalinkDevice: allows the management of the Empatica E4
(con-nection, interaction, setup and data collection). It is based on the
Empatica SDK Empalink v2.0;
• ComfTechDevice: allows the management of the ComfTech
smart-garments series, such as the HeartBand or the CozyBaby. It is based
on the documentation of the hexadecimal communication code
pro-vided by the manufacturer (ComfTech);
• ExlsDevice: allows the management of the IMU EXEL Exls3 board,
based on the documentation of the hexadecimal code provided by the
producer (EXEL);
• InteraxonMuseDevice: allows the management of the wearable EEG
2.2. RESULT: PHYSIOLITIX CHAPTER 2. PHYSIOLITIX
• NTPserver: to connect to an external server providing a time reference
signal through Network Time Protocol.
Available Output modules currently implemented are:
• PhysiolitixOutput: to connect and stream data to the Physiolitix
backend which is the main output of PhysioREC. This module
imple-ment methods for data chunking, compression and local caching. The
policies to regulate the data preprocessing and streaming are
auto-matically defined to optimize the battery consumption and utilization
of data connection.
• CSVOutput: allows saving the acquired data locally in human
read-able comma separated values (.csv) files.
User Interface
The PhysioREC User Interface (UI) is composed of three parts (see Figure
2.4):
1. Login screen to allow the user authentication and the selection of the
experiment associates to the acquired data;
2. Experimental setup: shows the list of Input and Output modules that
can be activated and allows the insertion of experimental metadata;
3. Acquisition progress: shows information during the acquisition (such
as: connection status, amount of data, errors). It also allows the
annotation of the sessions through a marker and the inspection of the
quality of the signals.
Core Flows Management
The Core Flows Management is the basic component of PhysioREC and it
CHAPTER 2. PHYSIOLITIX 2.2. RESULT: PHYSIOLITIX
signal preprocessing and the management of the acquisition. It is built on
top of SensorFlow [12], a Java Library for the advanced management of
data streams.
Through the Input modules, the Core Flows Management activates the
connection with the WDs and manages the start and stop of the acquisition
session. Collected data are synchronized by assignment of a unique time
reference, provided by an external source or by the smartphone clock; then
the preprocessed data are sent to the Output modules. A key feature of
the Core Flows Management is the persistence of the collected data: a
local database is used to temporary store the data which are deleted only
upon confirmation from all the Output modules that transmission to their
destinations is complete. In this way, PhysioREC is robust to loss of data
connection or errors due to sensor disconnections.
Advantages of PhysioREC
PhysioREC provides a solution to (a)(b)(c) issues identifies in multi-device
experiments with WDs. The existence of specific data streaming protocols
for each WD prevents the adoption of settings where different WDs are
used simultaneously, as this would require to run the proprietary app of
each device and separately control the acquisition. On the other hand, it
would not be feasible to develop a specific app for each experiment setup.
Due to the speed at which new WDs are released or the protocols updated,
this scenario would require a continuous effort to keep the pace with the
technological progress.
Instead, the modularity of PhysioREC in terms of inputs and outputs
allows high flexibility in supporting different types of WDs while
main-taining reliability and robustness of the basic functions of the Core Flows
Management. In fact, the workflow to integrate a new device is essentially
2.2. RESULT: PHYSIOLITIX CHAPTER 2. PHYSIOLITIX
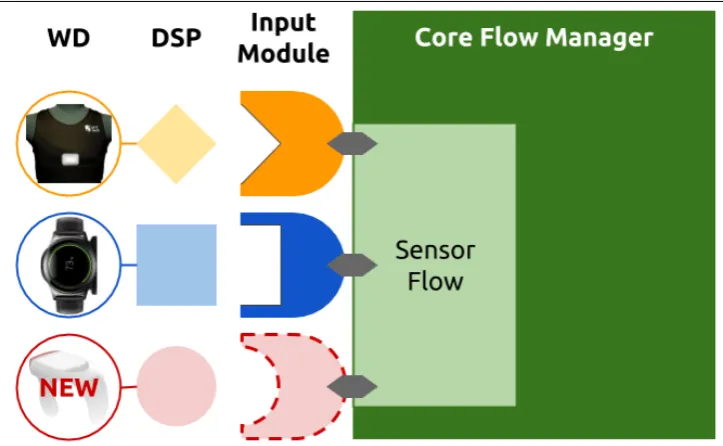
Figure 2.5: Integration of WDs into PhysioREC. From left to right: each WD which pro-vides a Data Streaming Protocol (DSP) can be integrated by developing the appropriate Input module. The Input module works as an interface between the specific DSP and SensorFlow by embedding the DSP into a set of defined functions, which can be used by the Core Flow Manager to communicate with the WD through SensorFlow. Therefore, when a new device is available, only its Input module needs to be developed to fully exploit the other features and characteristics of the Core Flows Management.
(see Figure 2.5)aims at developing a middle-ware layer that translates the
functions provided by the DSP of the new device into the general functions
of SensorFlow, to allow the Core Flows Management to access the device
and collect its data.
In addition, the use of PhysioREC is not limited to the physiological
WDs considered in this analysis: it would indeed be possible to use
Phys-ioREC to acquire data from other sources in the Internet of Things (IoT),
for instance from environmental sensors. Similarly, with appropriate
Out-put modules the data can also be used to stream the data to a third-party
service, for instance for health monitoring.
Also, issues associated to the synchronization of the data flows are
CHAPTER 2. PHYSIOLITIX 2.2. RESULT: PHYSIOLITIX
Management works as unique data gathering hub and therefore it is
pos-sible to assign a unique time reference to each sample, corresponding to
when the sample is received. However, this solution is still ineffective in
dealing with errors due to latency and time drift. These problems cannot
be solved runtime and the optimal synchronization is performed during
signal processing.
PhysioREC affronts key concerns associated to the privacy of personal
data and security. In particular, we focused on the following issues to grant
the security of data streaming:
a Control of the data storage: data are not sent to third-party servers
(as it usually happens when using proprietary apps) but only to the
selected destination server or they are stored locally;
b Security of the data streaming: thehttps protocol2 is used to send the data to the Physiolitix backend. In addition, on-going development
aims at enabling the encryption of the data before the streaming;
c Control of the access: authentication to the Physiolitix Backend for
data uploading and downloading is based on the OAuth2 standard3.
Regarding privacy, as the requirements depend on the type of subjects
and experimental design, the definition of rules and procedures for each
specific use-case is left to the researcher. As a general rule, to prevent the
identification of the user, the personal data are never stored by PhysioREC.
Additional features are currently being developed to further improve data
anonymization: the automatic removal of absolute timestamps from the
data and the random assignment of subject identifiers.
It is worth noting that the described restrictions and procedures have
been defined to enable an environment for research purposes: in case of
2
https://en.wikipedia.org/wiki/HTTPS
3
2.2. RESULT: PHYSIOLITIX CHAPTER 2. PHYSIOLITIX
commercial applications additional requirements should be met and specific
solutions should be implemented, for instance allowing users to control own
personal data.
2.2.2 PhysioBackend
While PhysioREC is the Physiolitix front-end, created to be used
on-the-field to collect the physiological signals, PhysioBackend is its server-side
(actually cloud) platform, responsible for the management of the
experi-ments and downstream analysis of the collected data. PhysioBackend has
been developed with the following aims: (i) having a centralized place
where data can be stored and accessed; (ii) granting security and privacy
by controlling the access to the data
The key elements to meet the two goals are:
1. Data indexing and web interface;
2. Authentication and user-based access control.
The implementation of PhysioBackend is currently based on standard
back-end platform composed of a PostgreSQL4 server as database
manage-ment system and Django5 for the web-interface and the control of
auto-matic data preprocessing routines.
Data indexing and web-interface
The data streams from the active PhysioREC instances are first
tempo-rally stacked in a transition table, then indexed and correctly stored by a
Django routine. The transition table is currently part of the PostgreSQL
server, but it could better be implemented in a non relational database
to improve scalability. Data are indexed in sessions and experiments: a
CHAPTER 2. PHYSIOLITIX 2.2. RESULT: PHYSIOLITIX
session is the set of data acquired during a single acquisition event, while
an experiment is associated to the study or aim for which the data are used
and is composed of multiple sessions. Each experiment is associated to a
list of users that are enabled to create new acquisition sessions.
A web interface based on Django allows accessing to the data (see
Fig-ure 2.6). Upon authentication, the web-interface shows the list of owned
experiments that can be downloaded or further inspected to see the list of
sessions belonging to the experiment. Each session can then be downloaded
separately, or further inspected to download the single signal. Metadata
information, such as the name of the user, date and time of the acquisition
start, type of signals acquired, is also shown and can be used to order and
search the list of the results. The method adopted to store and index the
data and the web-interface provide a direct and centralized access to the
experimental data, overcoming the need of collecting the data from the
different devices (local memory) or third-party web-services.
Authentication and user-based access control
Only authenticated users can access and stream data on PhysioBackend.
Authentication is provided through the PhysioREC Login interface or
through the web-interface and is based on a OAuth26 authentication server. Two different types of users are conceived: the ’researcher’ and the
’exper-imenter’; the ’researcher’ user can create new experiments and
’experi-menter’ users, define specific owned users for the data acquisition for an
experiment and access its data. The ’experimenter’ can use PhysioREC
to collect the data: they will be able to authenticate onto PhysioBackend
to get a list of experiments for which they have been enabled and stream
new data from those experiments, but they will be unable to access the
collected data. With this hierarchical structure it is therefore possible to
2.3. DISCUSSION CHAPTER 2. PHYSIOLITIX
Figure 2.6: Web-interface showing a list of sessions for a single experiment (Drowsiness Detection)
grant security and privacy while allowing the use of Physiolitix to multiple
researchers and different studies.
2.3
Discussion
WDs represent an opportunity for research as they enable the collection
of physiological signals in real-life context, thus facilitating the
investiga-tion of phenomena that hardly can be reproduced with laboratory settings.
However, before an extensive use for scientific purposes can be achieved,
some technical aspects need to be addressed and solved, in particular
ap-propriate technological platforms need to be created.
In this chapter we introduced the Physiolitix platform. The objective
of Physiolitix is to enable the adoption of reliable and robust multi-device
experimental settings in real-life contexts. PhysioREC, the front-end
com-ponent of Physiolitix, allows the synchronized acquisition of data from
multiple WDs. Input and Output modules mask the heterogeneity of data
streaming protocols and the Core Flows Management provides features
CHAPTER 2. PHYSIOLITIX 2.3. DISCUSSION
PhysioBackend is built to centralize the streams and manage the
acqui-sitions, while exposing to researchers essential functions to plan the
exper-iments, download data and control the access to sensitive information.
Although being stable and already used in international research
proj-ects, Physiolitix can be improved. Further development is needed to
in-crease the number of compatible WDs and more functionalities are
re-quired, such as the remote creation of experimental settings and diagnostic
tools to inspect the signal quality. To this aim the source code of
Physioli-tix is made available to contributors upon request.
Assessing the technical feasibility and enabling the real-life sensing with
multiple signals is however not sufficient to grant adoption of WDs in
re-search. Signals acquired by WDs have specific characteristics associated
to technical limitations and constraints which need to be addressed with
appropriate signal processing techniques. In addition, WDs allow the
si-multaneous observation of different physiological phenomena: for instance,
Heart Rate Variability, Electrodermal Activity and Respiration. As for the
upstream part, also the downstream analysis requires a unified framework
for the extraction of information of interest from the collected signals. The
solution proposed in this work is the Python package pyPhysio, which is
Chapter 3
pyPhysio: Physiological signal
processing with Python
The importance of physiological signals to decode the psychophysiological
state [68], combined with the emergence of wearable technologies which
ease the acquisition of physiological signals in real-life, are the main reasons
to require for new software resources to process heterogeneous physiological
signals. In general, available resources, both commercial and open-source,
focus only on a single type of signal, such as pyEEG [9] for
electroen-cephalographic (EEG) signals, pyHRV [17], gHRV [100] and KUBIOS [120]
for Heart Rate Variability (HRV) analysis; Ledalab [13], SCRalyze [5] and
cvxEDA [51] for electrodermal activity (EDA). A collection of available
functions for physiological signal processing is also provided by the
Phy-sioNet [49] website. Such fragmentation of solutions in multiple software
tools is one hurdle for reproducibility and comparison between studies, as
researchers usually have to develop custom code to include in a unique
study different types of signals. Such code is also of critical importance for
reproducibility.
Further, due to partial availability of open-source tools for
physiologi-cal signal processing, usually psycho-physiology researchers rely on
3.1. PHYSIOLOGICAL SIGNAL PROCESSING CHAPTER 3. PYPHYSIO
Figure 3.1: Three steps of physiological signal processing (top) and an example on a Blood Volume Pulse signal (bottom): original signal (left), after preprocessing (middle left), result of beat detection (middle right) and computed physiological indicators of Heart Rate Variability (right).
comparisons and reproducibility.
In this chapter we introduce pyPhysio, a python library to process
phys-iological signals, targeting multi-modal experimental settings and
psycho-physiological analysis. The remaining part of this chapter is organized as
follows: Section 3.1 presents few theoretical concepts about physiological
signal processing, Se

![Table 5.2: Source datasets, physiological signals and processing pipe-line applied: ABOY [1], DBD (see Appendix A), BEN [13], PKB (seeAppendix B), APK: adaptaive peak detection](https://thumb-us.123doks.com/thumbv2/123dok_us/523933.2052181/87.595.144.489.103.312/source-datasets-physiological-processing-appendix-seeappendix-adaptaive-detection.webp)