BIBECHANA
A Multidisciplinary Journal of Science, Technology and Mathematics ISSN 2091-0762 (Print), 2382-5340 (0nline)
Journal homepage:http://nepjol.info/index.php/BIBECHANA
Publisher: Research Council of Science and Technology, Biratnagar, Nepal
Variability of the atmospheric ozone over Kathmandu using
ground-based measurements
Narayan P. Chapagain
Department of Physics, Patan Multiple Campus, Tribhuvan University, Lalitpur, Nepal E-mail:[email protected]
Article history: Received 21 July, 2015; Accepted 30 August, 2015 DOI:http://dx.doi.org/10.3126/bibechana.v13i0.13311
Abstract
Measurement of the atmospheric total ozone over Kathmandu (27.670N, 85.290E) was carried out with a Brewer Spectrophotometer from February 2001 through February 2002. The total ozone data obtained from Brewer instrument are analyzed to study the daily variations of total ozone over Kathmandu on different seasons. The results reveal that day-to-day variations of the total ozone over Kathmandu are seasonal dependent. Total ozone values are relatively high in summer and spring seasons (up to 327 DU) and low (~213 DU) during the winter season. The low ozone concentration would be due to chemical and dynamic destruction processes related to the low temperature and less active photochemical reaction as less intense solar radiations are received during winter season.
©RCOST: All rights reserved.
Keywords: Brewer spectrophotometer; Dobson unit; Ozone depletion; Stratosphere; Total ozone.
1. Introduction
A useful general measure of ozone in the atmosphere is the column ozone or total ozone. The total ozone
is defined as being equal to the amount of ozone contained in a vertical column with a base of 1 cm2. A convenient measure of total ozone is the Dobson unit (DU). It is the thickness of the total ozone layer in
milli atmosphere centimeter if all the ozone molecules are brought to surface at normal pressure and
temperature. One DU represents an average atmospheric concentration of approximately one part per
billion by volume (ppbv) of O3. The ozone is not distributed uniformly over the globe. Typical amount of
ozone vary 230 to 480 DU with a world average of about 300 DU [1]. A level of 260 DU or below this is
considered critical and if measurements decline below this, ozone depletion is considered serious at high
latitudes.
Stratospheric ozone depletion in the atmosphere, particularly in the Polar Regions, has wide spread
has been well documented for the regions inside and outside of Antarctica after the detection of the
Antarctica ozone hole by Ferman and Shanklin [6]. Here total ozone signifies the columnar ozone
measurements from surface of the Earth to the top of the stratospheric region. The decrease of total ozone
in mid–latitudes in both the southern and northern hemispheres over most of the globe has been detected
from the ground- and satellite-based observations [7, 8, 9, 10]. Several studies were carried out for the
comparison of ground- and satellite- based observations of total ozone [e.g., 11, 12; 13].
The ground-based ozone measurements can be used to determine the climatological characteristics of the
ozone distribution. The variability in the total ozone over Thumba India (80N, 760E), was measured with Brewer Spectrophotometer [14] and they have presented the climatological study of atmospheric total
ozone. Similarly, Zou has reported the seasonal trends of TOMS ozone over Tibet, China, using the
log-term data during 1979–1991 [15].
In Nepal a few studies have been carried out during the past years using the ground- and space-based
observations and have first reported the variability of atmospheric total ozone over Kathmandu using
ground-based measurement by a Brewer Spectrophotometer and space-based observations by Total
Ozone Mapping Spectrometer (TOMS) satellite [16, 17]. The results reported that the total atmospheric
ozone over Kathmandu occurred low in winter and large in summer and spring seasons. In this paper, we
present the daily total ozone variations over Kathmandu measured by the Brewer Spectrophotometer on
different seasons during one-year period from February 2001 to February 2002.
2.
MethodologyThe ozone data used in this study were obtained by using Brewer Spectrophotometer. The Brewer
Spectrophotometer, MKII # 176 has been operating since January 2000 at the Central Department of
Physics, Tribhuvan University, Kirtipur, Kathmandu, Nepal (27.670N, 83.290E). The Brewer instrument is an improved optical scheme for observations of total ozone. Kerr and MCElory [11] reported operating
systems and about the automation of Brewer Spectrophotometer. It has also the ability to perform spectral
scans to quantify the UV radiation that passes through the atmosphere [18, 19]. There are six exit slits.
One is used for wavelength calibration against the 302 nm groups of mercury lines. The other five are for
intensity measurements and are normally set at 306.3, 310.1, 313.5, 316.7, and 320.1 nm. The band pass
of each is 0.6 nm [20]. These spectral intensity measurements are used to determine atmospheric total
ozone column and SO2. The accuracy of ozone measurements is estimated to be 1% [16]. The data
recorded by Brewer instrument are direct sun (DS) ozone measurements and zenith sky (ZS) ozone
minutes. In this study, we use the daily average value of ozone data measured by the Brewer instrument.
Ozone data are averaged from data collected symmetrically around the daytime.
3. Results and Discussion
Total ozone variations associated with solar radiation have been observed using Brewer data. Daily
averages of total ozone over Kathmandu have been plotted in Figures 1 to 4 for different seasons. The
vertical error bars in the plot indicate the standard deviation of the daily ozone mean.
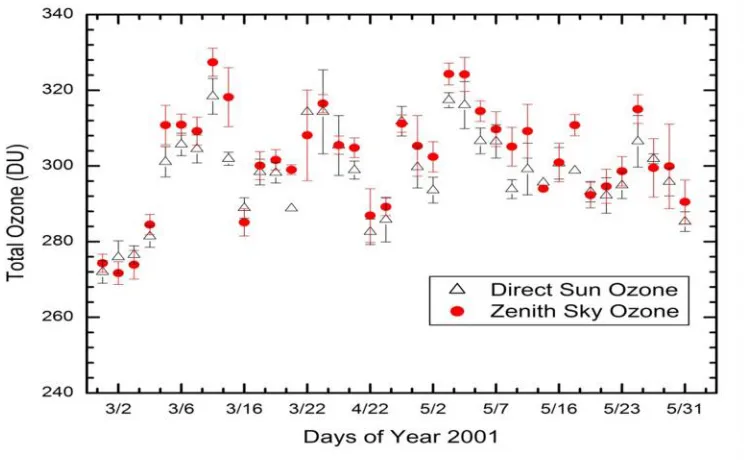
Fig. 1: Daily variations of average value of total ozone over Kathmandu during spring season (March-May).
Figure 1 shows the daily averages of Brewer ozone in the spring season (March–May, 2001). In the plot,
X-axis represents the days (month/day) of the year, while Y-axis represent total ozone measurements in
the Dobson Unit (DU). The data are direct sun (DS) and zenith sky (ZS) measurements. The gap in plot
shows the data are missing due to either improper operation of instruments or due to bad weather
conditions (cloudy sky or rainy days). The result clearly shows that there is a significant day-to-day
variation of total ozone over Kathmandu. The ozone value is minimum (~270 DU) in early March and
increases up to 327 DU in middle of March and early May. We do not have much data available during
the month of April. The amplitude of oscillation of ozone data is asymmetric and becomes large in the
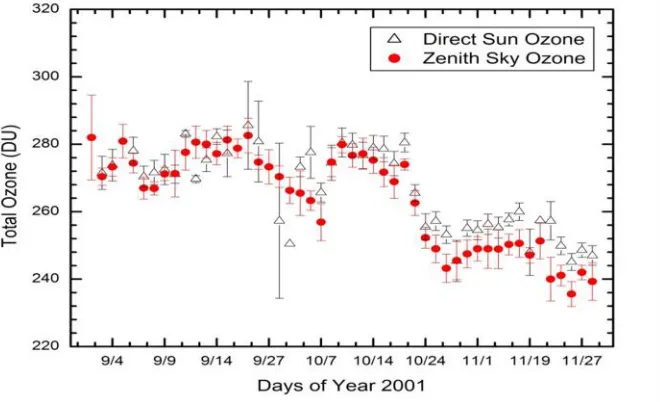
Figures 2, 3 and 4 are the plot of daily averages of total ozone data in summer (June –August), autumn
(September–November) and winter (December–February) seasons respectively. Figure 2 shows that
ozone value is large (up to 300 DU) in first week of June and then slightly decreases during July and
August. However, the ozone values are almost remaining same during July and August (~270-290 DU).
Similarly, Figure 3 plots the daily variations of ozone over Kathmandu during the autumn season, which
shows the maximum value up to 290 DU and particularly, high ozone concentration during September
and October that decrease at the end of October. During this season, ozone value becomes minimum on
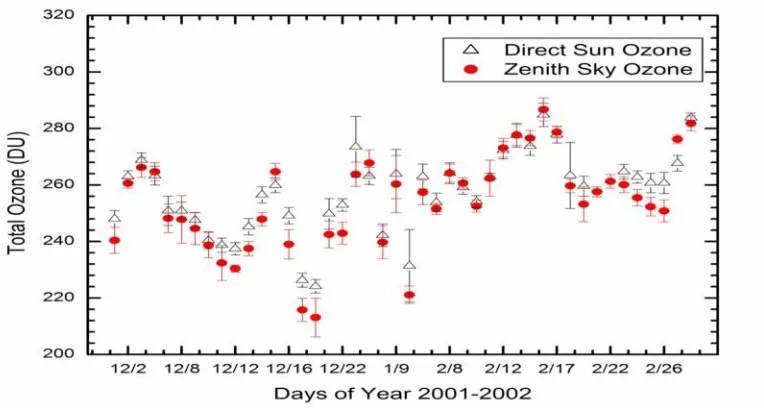
November (230 DU). Moreover, the ozone data plotted during the winter season (in Figure 4) shows the
low value of ozone data with the range of ~213-275 DU with lowest values on December and January.
To summarize one-year period of measurements, all data of daily mean total ozone is plotted in Figure 5.
The plot illustrates the seasonal variations of total ozone over Kathmandu from February 2001 to
February 2002. Figure illustrates the expected trend of total ozone variations. Ozone measurements are
low in early February and steeply rise in March and become maxima in spring season. Then ozone value
gradually decreases at the end of the summer through autumn and becomes minimum in winter. The
highest value of total ozone recorded by the Brewer Spectrophotometer is 327 DU on March 8 and the
lowest value is 213 DU on December 20. It can be inferred from the figure that the total ozone over
Kathmandu decreases faster during November, December and January than that during other months.
The Figure for minima and maxima agree to expectations for atmospheric total ozone levels in the change
of seasons. The expected anomalies in the monsoon did not show in the measurements. From the plots, it
is evident that the ozone level mostly decline after the first week of May. In the figures, the steep jumps at
the beginning of March and the end of April indicate how total ozone level in spring soared. In the
beginning of monsoon in mid June, the total ozone value rises slightly. The pattern of the variation of
ozone is similar to either side of the peak. The average total ozone of entire period is 273 DU, which is
sufficient higher compared to the critical value of atmospheric ozone required to filter the UV radiation,
which is considered to be 220 DU. However, the total ozone over Kathmandu in a few days is recorded
below the critical value. It clearly illustrates the importance of consistent measurements and study
atmospheric ozone over this region.
Figure 6 illustrates the variation of monthly average values of TOMS total ozone and Brewer total ozone
over Kathmandu for the period of February 2001 through February 2002. The minimum value of monthly
average of TOMS total ozone is 243 DU and 244 DU in November and December, respectively, while the
absolute units and 22% in terms of the percentage of the mean. The minimum value of monthly average
Brewer total ozone is 244 DU in December 2001 and the maximum value is 302 DU in May 2001. The
amplitude of variation of total ozone is 58 DU in absolute units and 21 % in terms of percentage of the
mean. The average of entire period is 271 DU for the TOMS ozone, 274 DU for the Brewer ozone. The
results show that the variations of TOMS total ozone and Brewer total ozone are symmetric. Hence, from
the Figure 6 illustrating the monthly trends, it can be seen that the total ozone over Kathmandu decreases
faster during November, December and January than that during other months.
Fig. 2: Daily variations of average values of total ozone over Kathmandu during summer (June-August) season.
Fig. 4: Daily variations of average values of total ozone over Kathmandu during winter season
(December–February).
Fig. 5: Daily average values of total ozone measured over Kathmandu during February 2001 – February
2002.
The monthly or seasonal variation of total ozone over Kathmandu is similar to those in other studies [21,
22]. For instance, seasonal variation of total ozone over Tibet [15] varies between 273 DU and 315 DU
minimum in winter (December-January) and maximum in spring (April–May) [23]. In tropical region, the
total ozone value is higher in summer and smaller in winter.
The low ozone concentrations over Kathmandu, particularly during winter season, would be caused by
chemical dynamic destruction processes related to the low temperature and less active photochemical
reaction due to less intense solar radiation. More research is needed to delineate the relative contributions
of dynamic, chemical and catalytic processes that cause ozone decrease. It is important to determine how
clouds and other climate factors affect the measurements of ozone.
Fig. 6: Monthly averages of total ozone over Kathmandu measured by Brewer Spectrophotometer and TOMS satellite observations during February 2001 - February 2002.
4. Conclusions
In this study, we report the atmospheric total ozone over Kathmandu measured with a Brewer
spectrophotometer during one-year period from February 2001 to February 2002. The result reveals a
significant day-to-day variation of total ozone over Kathmandu. The variation of total ozone is also the
functions of seasons, meteorological condition, clouds and solar zenith sky angle. The result illustrates that
seasonal variations of atmospheric ozone are significant with maximum in spring (up to 327 DU) and
minimum (go down to 213 DU) in winter season. This implies that ozone values in sunny days or cloud
free days are large as the photochemical reaction is predominant for the ozone formation. While total
ozone values are low on days having less solar intensity or cloudy days. The low ozone perturbations are
insight into the changes in ozone taking place in this region. The study of seasonal variation of ozone
levels can be backed by using the long-term ground- and satellite-based measurements.
Acknowledgement
Author would like to thank Prof. Dr. Shekhar Gurung, Central Department of Physics, Tribhuvan University, Nepal for providing the ozone data over Kathmandu measured by Brewer spectrophotometer.
References
[1] World Meteorological Organization (WMO)/United Nations Environment Programme (UNEP): Scientific Assessment of Ozone Depletion: 2006, World Meteorological Organization, Global Ozone Research and Monitoring Project, Report N 50 (Geneva, 2007).
[2] A.P. Alshuller, FAPCA, 37, 12 (1987) 1409–1417.
[3] A. Jayaraman, S. Lal, B.H. Subbaraya, Ozone in the Atmosphere, Proc. Quadrennial Ozone Symposium, 1988.
[4] F. Li Stolarski, R. S., and P. A. Newman, Atmos. Chem. Phys. 9, 16 (2009) 2207–2213.
[5] D. W. Waugh, L. Oman, S. R. Kawa, R. S. Stolarski, S. Pawson, A. R. Douglass, P. A. Newman and J. E. Nielsen, Geophys. Rev. Lett. 36 (2009) L03805.
[6] J. G. Ferman and J. D. Shanklin, Nature, 315(1985) 207–210.
[7] C.E. Jung, Tellux XIV, 4, (1962) 336-337.
[8] R. D. Bojkov, V. E. Fioletov and S. B. Diaz, Geophysical Research Letters, 22, 10 (1995) 1249–1252.
[9] P. M. Banks and G. Kockerts, Aeronomy, Part A, Academic Press New York London, 1973.
[10] R. S. Solarski, Science, 256 (1992) 342–349.
[11] J. B. Kerr and C. T. MCElory, The Automated Brewer Spectrophotometer, Atmospheric Ozone, Proceedings of Quadrennial Ozone Symposium, Greece, International Ozone Commission, 1984, p. 396.
[12] U. Kohler, U.R. Hartmanns Gruber, and W. Attmanspacher, Atmospheric Ozone Proceedings of Quadrennial Ozone Symposium, International Ozone Commission (IAMAP),1984, 402.
[13] M. A. Bondarenko, O. E. Bazhenov, and M. V. Grishaev, Atmos. Ocean. Opt. 19, 9 (2006) 699–702.
[14] B. H. Subbaraya and S. Lal, Journal of atmospheric and Terrestrial Physics, 56, 12 (1999a) 1557–1561.
[15] H. Zou, J. Geophys, Res. 90, 10 (1996) 463.
[16] N. P. Chapagain, Total Ozone Measurements Over Kathmandu Using Brewer Spectrophotometer, Thesis, Master of Technology, Andhra University, India, 2003.
[17]N. P.Chapagain,Quest-Journal of Kathmandu Bernhardt College, 1, 1 (2013) 1-6
[18] S. Bairs, Geophysical Research letters, 23, 8(1994) 833–836.
[19] W. A. Mathews, Atmospheric Ozone: Natural and Manmade Variations, Ozone Depletion, edited by Mohammed Ilyas and Published by University of Science of Malayasia and UNEP, 1991.
[20] WMO, Report of the International Ozone Trends Panel, Global Ozone Research Monitoring Project Report No. 18, Published NASA, NOAA, FAA and UNEP, 1988.
[22] O. E. Bazhenov, Atmospheric and Oceanic Optics, 25, 2 (2012)142-146.