T
T
R
R
A
A
N
N
S
S
P
P
O
O
R
R
T
T
L
L
O
O
C
C
A
A
T
T
I
I
O
O
N
N
I
I
N
N
F
F
E
E
R
R
E
E
N
N
C
C
E
E
D
D
R
R
A
A
W
W
I
I
N
N
G
G
U
U
S
S
I
I
N
N
G
G
G
G
L
L
O
O
B
B
A
A
L
L
P
P
O
O
S
S
I
I
T
T
I
I
O
O
N
N
I
I
N
N
G
G
S
S
Y
Y
S
S
T
T
E
E
M
M
K
K.
.
S
Sr
re
ee
ek
ka
al
la
a
,
,
K.
K
.
S
Sa
ai
i
J
Je
ee
ev
va
an
n
R
Re
ed
dd
dy
y
MGIT, Hyderabad, TS, India
Corresponding Author: Srikala Keshetti, [email protected]
ABSTRACT: The Main Objective of Transport Location Inference Drawing Using Global Positioning System is to help the passengers to track the location of their respective vehicle. Nowadays, it became difficult for passengers to know the exact location of the vehicle for which they are waiting. This application helps the passenger in tracking the vehicle and reach to the boarding point on time. Passengers can greatly use this application since Android mobiles have become common and affordable to all. This will also enhance security since the movement of the vehicles is always available. It is a real-time system as the current location of the bus is updated every moment in the form of latitude and longitude which is received by the passengers through their application on Google maps.
KEYWORDS: Transport, GPS, User, Administrator, Driver/Rider, Location, Tracking and Android.
1. INTRODUCTION
The mobile phone industry is one of the fastest, most dynamic and ongoing business across the world today. The need to communicate effectively and instantaneously has a greater need as people are busy with their fixed schedule. A mobile phone made our life easy. Communications being always a part of daily life millions of people are using smart phones across the world. We can do everything by using a smart phone. The invention of the Smart phone has made a big revolution in making the people reach everything and it’s a tremendous help to lead our lives easy. These days, it became difficult for students and employees to know the exact location of the vehicle. Thus, this Transport Location Inference Drawing Using Global Positioning System helps the user in tracking the vehicle and reaching to the boarding point on time. Students and employees greatly use this application since Android mobiles have become common and affordable to all of them. Besides, this will also enhance security since the movement of the buses is always available to the organizations where the employees are working or educational institutes where the students are studying.
Some strategies for transport location inference drawing are proposed in the literature. Karan
Punjabi et al [P+15] investigated that Bus locator via SMS using android application can tell the approximate location of the bus to the students. But it is a tedious process where the details of all the students are to be kept and updated time to time. The main disadvantages of this system are frequent overloading of the server and giving approximate location of the bus. Gunjal Sunil et al [G+14] discussed that Dynamic bus time table using GPS will display the approximate time at which the bus arrives to the waiting point. This application does not provide the real time location of the bus. Dr. Saylee Gharge et al [G+12] investigated that Real time bus monitoring using GPS provides real time location of the bus at the waiting point. But it is observed that there is a high cost involved in this due to the installation of transmitter and receiver in the bus and waiting point respectively. These are the some of the observations that brought new challenges while developing Transport location inference drawing using Global positioning system. Transport location inference drawing using global positioning system address all these issues. The rest of the paper is organized as follows.
We describe the related work in section 2. In Section 3 we present the Transport location drawing using global positioning system architecture and modules. Section 4 explains the design of the Transport location drawing using global positioning system. The Algorithm is discussed in section 5. Finally we conclude the paper in section 6.
2. RELATED WORK
location inference drawing using global positioning system”. The Main Objective of Transport location inference drawing using global positioning system is to help the students and employees to track the location of their respective organization’s transport vehicle like bus. It is a real-time system which uses the current location of the bus and updated every moment in the form of latitude and longitude to the database which is received by the students and employees through their application on Google maps. This application uses a method which get the location latitude and longitude from driver mobile and send to the database and when the user request for location, the database will then send the latitude and longitude points to the user.
3. TRANSPORT LOCATION INFERENCE DRAWING USING GLOBAL POSITIONING SYSTEM
3.1. Architecture
Transport location inference drawing using global positioning system uses a method [Z+13] which gets the location latitude and longitude from driver mobile and sends to the database and when the user request for location, the database will send the latitude and longitude points to the user as shown in the Architecture in Figure 3.1. The main reason for this selection is its smooth applicability and reliability issues.
Figure 3.1: Location inference
Drawing System Architecture
The process of location sharing starts as soon as the Driver log onto the application using their respective credentials and pressing the start button. This process of location sharing continues until the driver presses the stop button or logs out of the application.
3.2. Modules of Transport location inference drawing using Global positioning system
As shown in the Figure 3.2, the Transport location inference drawing using Global positioning system mainly consists of three Modules namely
Figure 3.2: Modules of Transport location inference drawing using GPS
Vehicle Tracking System Administrator:
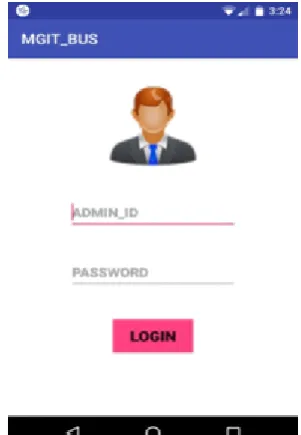
Vehicle Tracking System Administrator can log onto the admin account after authentication and authorization. He will be able to add vehicle details to the database and create a unique ID and password to it. He also has the option to modify or remove vehicle details from the database. When Administrator enters into the Administration module, the screen same as Figure 3.3 will be shown, asking administrator to enter login credentials. After successfully login to admin page, the Administrator will be able to see four buttons as shown in Figure 3.4, namely Add, Delete, Details and Logout.
Upon Clicking the Add Button, the Administrator would be able to add/create new Bus detail by providing the required information like bus number and password to be set to the application. Figure 3.4 represents the screens which appear during the bus creation.
Figure 3.4: Admin Home Page
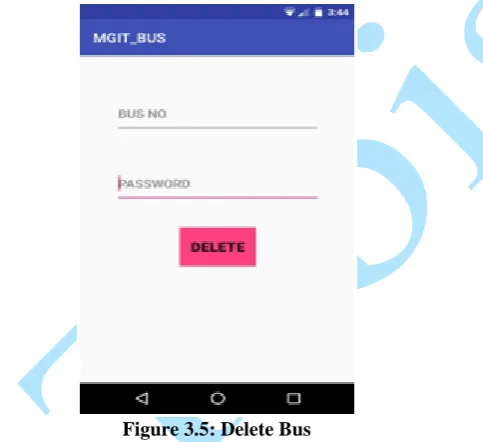
Upon pressing the delete button, the Administrator can be able to delete any existing bus details from the database. As shown in Figure 3.5, the application would ask the administrator to enter the Bus number and password of the particular bus which he wants to delete.
Figure 3.5: Delete Bus
Vehicle Tracking System Driver:
Transport Tracking System Driver is provided with their unique login credentials. They need to log in and then have to start their location service before driving. The current location of the bus will be updated from the driver's mobile to the server every moment in the form of latitude and longitude. The location of the bus is visible in Google Maps when asked for. As the driver logs out, the GPS tracking will stop updating the location coordinates to the database.
When Driver enters into his module, the screen same as Figure 3.6 will be shown, asking the Driver to enter the login credentials.
Figure 3.6: Driver Login Page
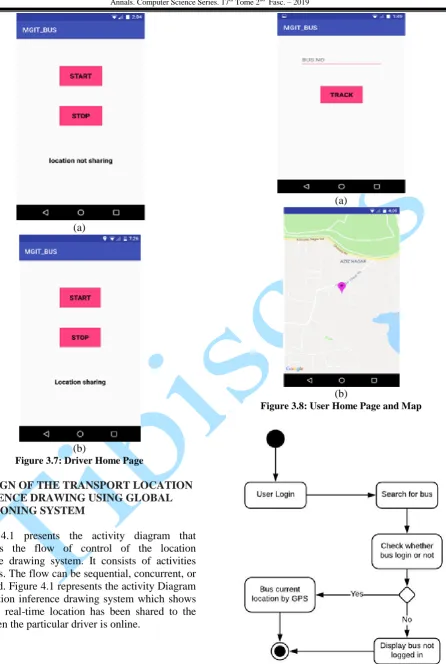
Upon successfully login into the driver page, the driver can see a screen similar to Figure 3.7 which shows two buttons ( Start and Stop) and a text field (which represents whether the location is sharing or not). In order to start sharing the location the driver has to press the Start button. To stop sharing and log out from the application the driver has to press the Stop button.
As we can see in the below Figure 3.7, that when the driver presses the start button the text “Location not Sharing” has been changed to “Location Sharing”. Vehicle Tracking System User:
(a)
(b)
Figure 3.7: Driver Home Page
4. DESIGN OF THE TRANSPORT LOCATION INFERENCE DRAWING USING GLOBAL POSITIONING SYSTEM
Figure 4.1 presents the activity diagram that describes the flow of control of the location inference drawing system. It consists of activities and links. The flow can be sequential, concurrent, or branched. Figure 4.1 represents the activity Diagram of Location inference drawing system which shows how the real-time location has been shared to the user when the particular driver is online.
(a)
(b)
Figure 3.8: User Home Page and Map
Figure 4.1: Activity Diagram
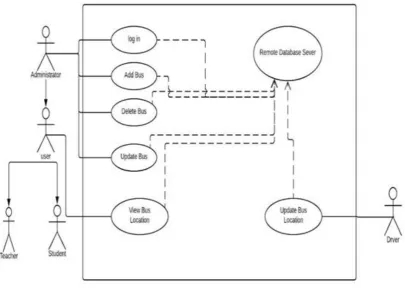
system. Use case diagrams model the functionality of a system using actors and use cases. Figure 4.2 represents a Use Case Diagram of Transport location inference drawing System where there are three main actors namely Administrator, User, and Driver. The Administrator can perform certain actions like Adding, Deleting, and updating particular vehicle details. The Driver is responsible for sending/sharing the location whereas the User can view the bus location.
Figure 4.3 is the class diagram that models the static structure of Location inference drawing system. It shows relationships between classes, objects, attributes, and operations. Figure 4.3 represents the Class Diagram of Location inference drawing System. We have used five classes in developing this application namely Client Application, Server, Bus Application, Bus, and Database. we can observe from the figure that the Client Application and Bus Application class has a many-one relationship with the Server class.
Figure 4.2: Use Case Diagram of Location inference drawing system
5. ALGORITHM OF LOCATION INFERENCE DRAWING SYSTEM
First the Admin has to enter the login credentials to login to the Admin page. The Driver enters into his module by entering the login credentials. When the driver presses the start button the location sharing will be started. This information gets updated in the database after every moment. The users can retrieve this data from the database. The following is the sequence of steps that are involved while working with the application.
1. Administrator login to the database using credentials.
2. Administrator can add/delete/update any vehicle information.
3. Driver also login to update a vehicle location by using GPS.
4. Updated information by administrator or driver is stored in the database.
5. User can retrieve the data stored in the database to draw the location inference of vehicle
Figure 5.1: Algorithm of location inference drawing using GPS
6. CONCLUSION
With the implementation of the Transport location inference drawing using Global positioning system, a complete track of the vehicle can be recorded. This display at the user end acts as a time saver. Due to this, an ideal system of vehicle transport is established by any organization. By implementing our system, a student or employee can plan their journey more efficiently before time as the waiting time at the bus stops is reduced. This system also throws light on the frequency of the buses on the same route. The main features of this system are the efficient usage of time, real-time information on the availability of buses, traffic acknowledgment, and user satisfaction. A general question arises in mind that is if the vehicle is stuck in traffic or it broke down somewhere in the middle how our system will inform the traveler. The answer to this problem is that when a user will query the central server, the server will show the same location and Estimated Time Arrival of the vehicle so by this method, it is self-explanatory that the bus must have got stuck in traffic or there might be an unknown problem with it. Thus in this system, we have shown that transit information collected in real time can be shown on the server for tracking and monitoring. Internet-enabled mobile phones can receive real-time transit information and will help the passenger to monitor
their time more effectively and precisely by planning and boarding the vehicle on time.
REFERENCES
[GBG11] R. Grgurina, G. Brestovac, T. Galinac Grbac - Development Environment for Android Application Development: an Experience Report, MIPRO 2011, May 23-27, 2011.
[G+12] S. Gharge, M. Chhaya, G. Chheda, J. Deshpande - Real time bus monitoring system using GPS, An International Journal of Engineering Science and Technology, Vol. 2, Issue 3, June 2012.
[G+14] N. Gunjal Sunil, V. Joshi Ajinkya, C. Gosavi Swapnil, B. Kshirsagar Vyanktesh - Dynamic Bus Timetable Using GPS, International Journal of Advanced Research in Computer Engineering & Technology (IJARCET), ISSN :2278-1323, Volume 3, Issue 3, March 2014.
[P+15] K. Punjabi, P. Bolaj, P. Mantur, S. Wali – Bus Locator via SMS Using Android Application, International Journal of Computer Science and Information Technologies (IJCSIT) , ISSN :0975-9646, Volume 5(2), 2015.
[T+11] A. Thiagarajan, L. S. Ravindranath, H. Balakrishnan, S. Madden, L. Girod - Accurate, Low-Energy
Trajectory Mapping for Mobile
Devices, 8th USENIX NSDI, Boston, MA, March 2011.
[Z+13] J. Zhu, K.-H. Kim, P. Mohapatra, P. Congdon - An Adaptive
Privacy-Preserving Scheme for Location