University of New Orleans University of New Orleans
ScholarWorks@UNO
ScholarWorks@UNO
University of New Orleans Theses and
Dissertations Dissertations and Theses
8-6-2009
Vehicle detection and tracking using wireless sensors and video
Vehicle detection and tracking using wireless sensors and video
cameras
cameras
Sowmya Bandarupalli University of New Orleans
Follow this and additional works at: https://scholarworks.uno.edu/td
Recommended Citation Recommended Citation
Bandarupalli, Sowmya, "Vehicle detection and tracking using wireless sensors and video cameras" (2009). University of New Orleans Theses and Dissertations. 989.
https://scholarworks.uno.edu/td/989
This Thesis is protected by copyright and/or related rights. It has been brought to you by ScholarWorks@UNO with permission from the rights-holder(s). You are free to use this Thesis in any way that is permitted by the copyright and related rights legislation that applies to your use. For other uses you need to obtain permission from the rights-holder(s) directly, unless additional rights are indicated by a Creative Commons license in the record and/or on the work itself.
Vehicle detection and tracking using wireless sensors and video cameras
A Thesis
Submitted to the Graduate Faculty of the University of New Orleans In partial fulfillment of the Requirements for the degree of
Master of Science in
Engineering
by
Sowmya Bandarupalli
ii
Acknowledgments
I would like to take this opportunity to thank Dr. X. Rong Li for taking me as his graduate
student and for his patience and support, when I took way longer than expected to finish. I would
also like to thank Dr. Huimin Chen for his advice, support and guidance. This work would not
have been possible without his help and direction. I would like to thank Dr. Dimitrios
Charalampidis for accepting to serve on my thesis committee. I would also like to thank Dr.
Vesselin Jilkov and Dr. Rasheed Azzam for their support and guidance.
I would like to thank all the members of the Information and Systems Laboratory for sharing
their knowledge and research experiences during the weekly seminars. It is very encouraging to
be a part of such a motivated and hardworking group. I would like to thank Ashwini Amara for
her time and valuable inputs. This research is supported in part by the Army Research Office and
Department of Defense.
I thank my husband, Naveen who stood beside me and encouraged me constantly. Thank you for
supporting me and taking care of everything. And my thanks go to my lovely daughter, Sanjana
for her cooperation. I would like to thank my parents and in-laws who have supported me always.
Above all, I would like to thank my Master, my spiritual guide for his blessings.
iii
Table of Contents
Table of Figures ... v
Abstract ... vii
Chapter 1 – Introduction ... 1
1.1 Introduction to Target Surveillance... 1
1.2 Outline of the thesis... 5
Chapter 2 – Overview of the Surveillance Testbed ... 7
2.1 Introduction to the Surveillance Testbed ... 7
2.2 Components of the Testbed ... 10
2.3 Overview of Vehicle detection and tracking ... 11
Chapter 3 – Vehicle detection using wireless sensors ... 13
3.1 Overview of wireless sensor networks ... 13
3.2 Applications of Wireless Sensor Networks ... 13
3.3 Vehicle detection using wireless sensors ... 15
3.3.1 Micaz Mote – Kit 2400 ... 15
3.3.2 MIB510 Programming board ... 17
3.3.3 Functionality of the acoustic and light Sensors ... 17
3.3.4 Supporting hardware and software ... 18
3.4 Hardware setup ... 19
3.4.1 Hardware Installation ... 19
3.4.2 Preparing the motes ... 20
3.4.3 Installing TinyOS applications onto a mote ... 20
3.4.4 Testing the motes ... 21
3.5 Data logging ... 24
3.5.1 Mote-View ... 24
3.5.2 PostgreSQL 8.0 ... 25
3.5.3 SerialForwarder GUI ... 25
3.5.4 Xlisten ... 26
iv
3.7 Sensor data retrieval ... 29
3.7.1 Using PostgreSQL and SQL commands ... 29
3.7.2 Using Xlisten and Matlab ... 30
3.8 Assumptions and limitations of data collection using wireless sensors ... 30
3.9 Sensor data processing for vehicle detection ... 31
3.10 Observations ... 35
Chapter 4 –Video based Vehicle Tracking ... 37
4.1 Background Information ... 37
4.2 Camera model ... 39
4.3 Overview of Camera calibration ... 41
4.3.1 Camera calibration matrix / Internal parameters matrix ... 42
4.3.2 External parameters matrix` ... 42
4.4 Different methods of estimating camera parameters... 43
4.5 Preprocessing techniques ... 44
4.5.1 Processing of video files in Matlab ... 44
4.5.2 Vehicle extraction from images ... 45
4.5.3 Calculation of vehicle centroid ... 46
Chapter 5 –Experimental Study ... 50
5.1 Experimental setup ... 50
5.2 2-D to 3-D mapping ... 50
5. 3 Self calibration procedure ... 51
5.4 Calculation of 3-D world coordinates ... 57
5.5 Camera calibration using non-linear minimization techniques (fminsearch) ... 59
5.6 Some of the challenges during the experimental study ... 62
5. 7 Vehicle trajectory from multi-cameras ... 63
5. 8 Vehicle trajectory using wireless sensors... 65
5. 9 Integration of vehicle detection and tracking ... 66
5. 10 Types of errors in a typical surveillance system ... 68
Chapter 6 - Conclusions and future work ... 71
Bibliography ... 74
v
Table of Figures
Figure 1: Testbed setup for Vehicle detection and tracking ... 9
Figure 2: Overview of vehicle detection and tracking ... 11
Figure 3: Micaz mote ... 16
Figure 4: MTS310CA multipurpose sensor board ... 16
Figure 5: MIB510 programming board... 17
Figure 6: Micaz plugged to MIB510 ... 21
Figure 7: Serial Forwarder GUI ... 26
Figure 8: Mote-View window illustrating the charts feature ... 28
Figure 9: Light sensor measurements ... 33
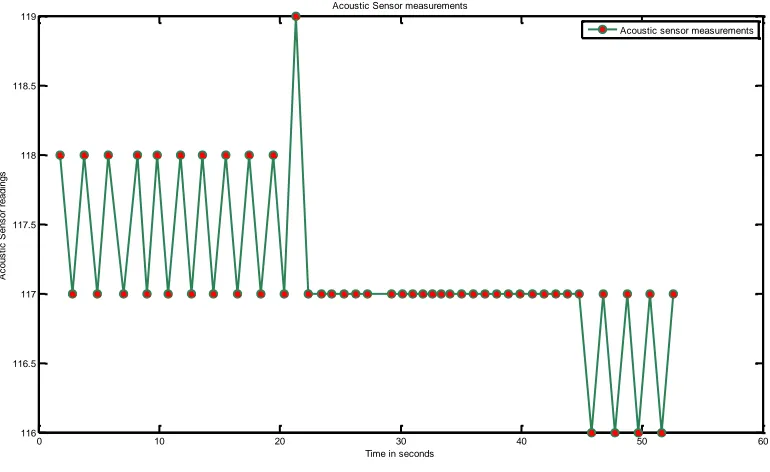
Figure 10: Acoustic sensor measurements ... 34
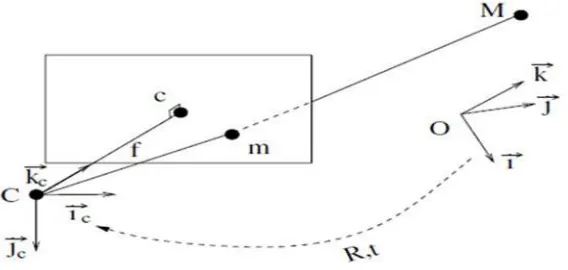
Figure 11: Camera perspective model ... 40
Figure 12: Extraction of an object from the background ... 48
Figure 13: Plots of vehicle centroid from camera 1 ... 53
Figure 14: Plots of vehicle centroid from camera 2 ... 53
Figure 15: Plot of vehicle centroids from camera 3 ... 53
Figure 16: Vehicle trajectory from 3 cameras in the world coordinates - onward direction ... 61
Figure 17: Vehicle trajectory from 3 cameras in the world coordinates - return direction ... 62
Figure 18: 2-D average vehicle trajectory from video cameras ... 64
Figure 19: 1-D average vehicle trajectory from video cameras ... 64
Figure 20: Vehicle trajectory using wireless sensors ... 66
Figure 21: Vehicle trajectory using sensors and cameras ... 67
vi
vii
Abstract
This thesis presents the development of a surveillance testbed using wireless sensors and
video cameras for vehicle detection and tracking. The experimental study includes testbed design
and discusses some of the implementation issues in using wireless sensors and video cameras for
a practical application. A group of sensor devices equipped with light sensors are used to detect
and localize the position of moving vehicle. Background subtraction method is used to detect the
moving vehicle from the video sequences. Vehicle centroid is calculated in each frame. A
non-linear minimization method is used to estimate the perspective transformation which project 3D
points to 2D image points. Vehicle location estimates from three cameras are fused to form a
single trajectory representing the vehicle motion. Experimental results using both sensors and
cameras are presented. Average error between vehicle location estimates from the cameras and
the wireless sensors is around 0.5ft.
Keywords: Surveillance testbed, vehicle detection and tracking, camera calibration, perspective
projection model, wireless sensor measurements, Micaz, MoteView. Nonlinear minimization,
1
Chapter 1 – Introduction
1.1Introduction to Target Surveillance
Surveillance is the monitoring of behavior or watching-over of people or objects of
interest. In recent years, we have witnessed a rapid growth in the research and development of
various surveillance methods using multimodal sensors, including video, audio, thermal,
vibration, and various kinds of other sensors, in both civilian and military applications [1]. The
objective of a surveillance system is to detect, classify, track, recognize and interpret behavior
of objects of interest in the designated area. Surveillance systems can be categorized based on
the type of devices it uses. Some representative surveillance applications include:
Environmental, patient and habitat monitoring: Wireless sensors are popularly used due
to the ease of deployment and monitoring. For applications such as habitat and
environmental monitoring, deploying a large number of wireless sensors in a given
coverage area seems to be effective due to the low cost and flexibility of data collection.
On the other hand, a large amount of sensory data requires a complex data processing
algorithm to achieve the surveillance objective.
Conventional radar and camera based surveillance systems are generally built using
wired devices with relatively high sensing accuracy and a durable power supply.
However, due to the high cost and physical/geometric restrictions on the deployment,
these sensing devices have to be more or less fixed at certain locations. Therefore, data
collected by them are usually limited in spatial coverage and non-adaptive to the
environmental changes.
Surveillance systems with both wired and wireless devices: In regard to the pros and
cons of the wired and wireless sensing devices, the integration of information obtained
from both types of sensors with multiple modalities is expected to improve the object
detection and tracking accuracy. For a practical design of the surveillance system, virtual
2
fixed (mostly wired) devices which persistently cover the region of interest and wireless
sensors which can provide more detailed information as needed.
Combining the results of multiple sensing devices can provide more accurate
information than using a single device; this allows either improved accuracy from existing
devices or the same performance from smaller or cheaper sensors.
In target surveillance, the network of sensors will have to cooperate to perform scene
monitoring and continuous target tracking over a large area that cannot be viewed continuously
by a single sensor alone. Cooperative multi-sensor surveillance will significantly enhance
situational awareness by providing complete and continuous coverage of target movements in
the coverage area. Information in the form of estimated target locations and appearances can be
gathered from different sensors of possibly different sensing modalities and redundant data
needs to be correlated and merged for better results.
Surveillance applications such as target detection, tracking classification, activity
understanding has attracted much attention. Active research is being done for vehicle detection
and tracking using wireless sensors. The idea of deploying wireless sensors to monitor the
behavior of the target is not new. Different modalities of the sensors are being used to improve
the accuracy of vehicle detection or tracking. Multimodal sensing has attracted much attention
in solving a wide range of problems. In [2], both the acoustic and magnetic sensor
measurements are processed for vehicle detection. Individually, the acoustic and magnetic
sensors can detect the targets regardless of the bearing with low power consumption.
Video based surveillance systems typically monitor the behavior of the target in the
designated area using single or multiple cameras. These systems require the development of
image processing and computer vision algorithms to detect, locate and track a moving target.
The use of multiple cameras enables the surveillance of greater areas and the use of the
redundant information (provided by the videos from different viewpoints) can help overcome
some of the known limitations of single camera systems, such as scene occlusions. These
limitations are mainly due to two types of problems. There are certain areas that cannot be
3
cameras and sensors. The second class of problems is due to the limited resolution of cameras.
An interesting solution to these problems could be using simple but effective specialized
sensors with different modalities to solve the specific problems of the vision systems. In this
way, vision would still provide high-level information, and low-level sensors would assure
higher accuracy.
In order to establish a correspondence among the information from different views, it is
necessary to determine a mapping function that relates the location of a pixel in one view with
that of the same pixel in another view. This mapping function is known as Homography. In [3],
an effective method is presented to resolve occlusions and to track objects between overlapping
and non-overlapping camera views using the homographic relations between each camera view.
Active research on vehicle detection and tracking using multimodal sensors has recently
become an important application in target surveillance. To intelligently fuse information from
different modalities, novel strategies for detection and data association have to be developed to
exploit the multimodal information. In the literature, one finds that fusion of acoustic and video
modalities has been applied to problems such as tracking of humans under surveillance and
smart videoconferencing. The success of the fusion strategy is mainly because each modality
may compensate for the weaknesses of the other or can provide additional information. In
surveillance applications, different types of sensors, such as video and acoustic sensors, provide
distinct observations of ongoing activities. In [4], a fusion framework is presented using video
and acoustic sensors for vehicle detection and tracking. Both video cameras and acoustic arrays
have been used as sensing devices to estimate these parameters. A computational framework for
joint audio-visual vehicle detection and tracking using Markov Chain Monte Carlo (MCMC)
techniques is presented. Improved tracking performance is reported by fusing the empirical
posterior probability density functions obtained using both types of sensing modalities. To
enhance video surveillance systems, multi-modal sensor integration can be a successful
strategy. In [5], a computer vision system capable of detecting and tracking people from
multiple cameras is integrated with a wireless sensor network mounting Passive Infra Red (PIR)
sensors. The reported results demonstrate that integration of PIR sensors and cameras can
4
To understand the pros and cons of both wired and wireless sensing devices, we worked
with a set of wireless sensors and few cameras. From the documentations and manuals provided
with the sensors, we were able to configure, program and test the wireless sensors before the
actual data acquisition could begin. Having hands-on experience provided in-depth
understanding about the basic functionality as well as the limitations. Knowledge about
different sensing devices helped us design of the testbed, fuse the data from multi-sensor
modalities and improve the accuracy of the vehicle detection and tracking system.
This thesis reports the development of a testbed integrating a wireless network of Micaz
mote sensors and a set of three video cameras. We have developed a target surveillance testbed
for small-scale illustration of the automated vehicle detection and tracking using various
algorithms. In the case of partially overlapped cameras, the best choice is to exploit the
geometrical information. These geometry based methods can be classified into calibrated and
un-calibrated approaches. Each camera processes the scene and obtains a set of tracks. The
objective of this thesis is to combine the videos obtained from the cameras with the data
provided by the wireless sensor network to effectively detect and track a moving vehicle. In our
experimental study, we used the wireless sensors to detect the vehicle. The high-resolution
video cameras were used to generate the vehicle trajectory from the video sequences obtained.
The testbed provides a mechanism for performance evaluation of algorithms developed in
different research areas including target information processing, integrated sensing and data
fusion, image processing and target tracking. Video surveillance technologies are generally
based on data processing and analysis for moving object detection, region localization, object
classification, object identification, tracking, human motion analysis, and activity understanding.
Part of the research results in this thesis has been published at the International
Conference on Testbeds and Research Infrastructure for the Development of Networks and
Communities (TridentCom 2007). As one of the coauthors of the TridentCom paper [6], my
contribution includes implementing the sensor data processing and camera calibration
algorithms. During the initial phases of the surveillance testbed, a PhD student in our team,
5
fusion techniques used to detect and track a vehicle. My contributions in different phases of the
testbed development include:
Install the required hardware and software components, understand the functionality of
the different modalities of the micaz motes, and program the mote sensors with
applications required for the experiment.
Implement sensor data acquisition, monitor and retrieve the sensor data from the
database, and develop an algorithm for sensor data processing to detect the presence of
the vehicle.
Address the basic challenges in vehicle detection and tracking using multiple wireless
sensors and video cameras in our testbed and the techniques we have adapted to
overcome the challenges.
Understand the basics of Camera perspective model, camera calibration and different
methods of calibrating a camera. Develop an algorithm to preprocess the video
sequences and to calibrate the camera using the self-calibration technique.
Estimate the camera parameters using fminsearch a nonlinear minimization method that
find a solution by minimizing the errors between the actual image coordinates of the
reference points and the estimated image coordinates.
Summing it up, work on the development of a surveillance testbed to perform small scale
vehicle detection and tracking using wireless sensors and video cameras.
1.2 Outline of the thesis
Chapter 2 presents the overall structure of the surveillance testbed. Background
information about target surveillance and the design of the testbed are discussed. The basic
components of the testbed are discussed.
Chapter 3 gives an overview of vehicle detection using wireless sensors. Some of the
applications of wireless sensor networks are discussed. The micaz development kit, the
programming board, etc. are described in detail. The TinyOS operating system and the nesC
6
data. Vehicle detection using wireless sensors is described in detail. Basic functionality of the
light and acoustic sensors is discussed. Some issues encountered during the data acquisition
process are discussed along with the solutions. The data log, monitoring and retrieval
procedures are discussed.
Chapter 4 presents an overview of the vision based vehicle tracking module. Different
methods of vehicle tracking are discussed. A camera model is discussed with an emphasis on
the perspective projection model. An overview of camera calibration and different methods of
calibrating a camera are discussed. Detailed information about camera parameters is presented,
and different ways of estimating the camera calibration matrix and the camera pose are
described. Preprocessing techniques such as background subtraction and calculation of the
vehicle centroid are discussed.
In Chapter 5, the experimental setup and the basic challenges faced during the
experiment are discussed. We have a set of points whose coordinates in three dimensions are
known, and whose locations in two dimensions are also known. In addition to these points, we
also know that the view is a perspective projection, and therefore the transformation of the
three-dimensional coordinates of a point to the two-dimensional coordinates can be expressed
compactly as a 3 x 4 transformation matrix using homogeneous coordinates. An algorithm to
obtain the transformation matrix and perform the 2-D to 3-D mapping is outlined. The camera
parameters are estimated using a method of nonlinear minimization of the errors between the
actual image coordinates of the reference points and the estimated image coordinates. The
parameters estimated using the self calibration procedure is used as the initial values to the
nonlinear method. One of the challenges is how to track the vehicle using multiple sensing
devices and how to fuse all the estimates. This chapter presents the integration of vehicle
detection by the wireless sensors and vehicle tracking by the video cameras. Different types of
errors in a typical surveillance system are presented. Error between the estimated vehicle
locations with respect to the cameras and sensors is computed.
Chapter 6 presents conclusions and also discusses possible future work to improve the
7
Chapter 2 – Overview of the Surveillance Testbed
2.1 Introduction to the Surveillance Testbed
One major surveillance task is to detect and track moving targets (e.g., vehicles, people).
Surveillance systems track the targets and also detect and classify. Integration of the
multi-sensor and multi-camera output to obtain an evolving, scene representation of the target is an
important task. This is a typical problem of information fusion. In simple words, information
fusion is to combine information (data, decisions, estimates, etc.) from multiple sources (sensors
or data processing nodes, etc.) to achieve better inference than could be achieved by the use of a
single source [6]. Using multiple cameras to track a target has several advantages. Fast moving
targets can often still be tracked. If the target moves fast enough to evade one camera, it is
possible that the other cameras could still keep the target in view.
Deploying a large number of wireless sensor nodes in the designated area is usually not
a good choice. It is not only inefficient, but also hard to achieve accurate and robust
performance. The advantages such as low cost and low energy consumption are outweighed by
the total cost for collaborative sensing and data processing. At the same time, we cannot just use
wired devices due to the high cost and the physical/geometric restrictions on the deployment. In
regard to the pros and cons of both approaches, a viable choice of system design would be to
have a combination of fixed (wired) devices which persistently cover the region of interest and
wireless sensors which can provide more detailed information as needed.
A system consisting of a set of distributed sensor platforms is capable of observing and
interacting with a larger region of the coverage area. A greater amount of information about the
environment can be obtained with a reduced uncertainty through cooperation and sharing of the
environmental knowledge obtained by fusion of multiple viewpoints. In our experimental study,
we use the wireless sensors to detect the vehicle and the video cameras to track the vehicle.
Video surveillance technologies are generally based on data processing or analysis techniques
for moving object detection, region localization, object classification, object identification,
8
of the core theories and topics in computer vision, pattern analysis, and artificial intelligence.
There is a standard set of techniques for video surveillance systems that use background
modeling or frame differencing to detect moving objects of interest or feature tracking from
frame to frame.
The basic techniques for interpreting video and extracting information from it have
received a significant amount of attention. Video based image tracking aims to develop the
object trajectories over time from the video sequences obtained. From the obtained trajectories,
and, with the knowledge of camera pinhole model and other parameters, position of the object
can be determined in the scene with reference to a three-dimensional (3-D) world coordinate
system. This 3-D point refers to the vehicle location in the real world. We evaluate the
performance by comparing the vehicle trajectory obtained using the video cameras to that
obtained from the wireless sensors. We have developed a target surveillance testbed for a
small-scale illustration of the automated vehicle detection and tracking using various algorithms. The
equipment used to develop the testbed system includes:
Remote control vehicle
Two desktop computers and two laptops: for collecting data and local processing.
Two work stations used as fusion centers.
Wireless sensor nodes and developing kits (Micaz Mote- Kit2400): the programming
board is connected to a desktop via a serial-USB converter.
Overhead cameras and a surveillance center (currently built on a high performance
desktop).
Wireless routers (802.11b/g).
The testbed setup for this particular experiment involves both the wireless sensors as
well as the video cameras. The experiment was carried out in a dark room with a coverage area
of approximately 20ft×4ft. Ten sensors are placed equally along both sides of the coverage area.
A remotely controlled vehicle with two sensors and a flash light onboard was used. The
9
digital camera are used to provide the scenes of surveillance area and possibly the position
information of the vehicle. The video cameras are placed at 0ft, 15ft and 23ft respectively and at
an elevation of approximately 3ft along x-axis. The video cameras are mounted on fixed
locations, recording video streams and directly communicating to a desktop by a multi-channel
wireless receiver. The laptop enables the processing of the sensor programming board which is
collecting sensing data from each Micaz mote. The Micaz motes with acoustic and light sensor
functionalities are used as low resolution sensors deployed in the experimental area.
Figure 1: Testbed setup for Vehicle detection and tracking
The remotely-controlled vehicle is be monitored by different sensors. The Micaz motes
with acoustic/light sensors are used as low resolution sensors deployed in the experimental area.
In order to check the sensitivity and accuracy of the wireless sensors in terms of missed
detections, false alarms and the actual detection of the vehicle, different scenarios were tested.
Vehicle moving slowly in a straight line with two sensors and a flash light mounted
Flash light pointing in the same directions in both onward and return paths.
Flash light pointing in different directions in both onward and return paths.
Vehicle making a turn in the coverage area.
Vehicle moving fast in a straight line with two sensors and a flash light mounted
15 ft 23 ft
0 ft 0 ft
10
Flash light pointing in the same directions in both onward and return paths.
Flash light pointing in different directions in both onward and return paths.
Vehicle making a turn in the coverage area.
Inorder to check the sensitivity of the sensors, in the first scenario, we placed the
flashlight on the vehicle pointing to the same direction in both onward and return paths. Since
we have the ten sensors placed equally on both sides of the coverage area, we wanted to test
how many of the sensors would actually detect the change in the light conditions. In the second
scenario, since the direction of the flashlight is changed in the onward and return paths, all the
sensors should be able to detect the changes in the light conditions. Similarly, the first two
scenarios are repeated with the vehicle‘s speed increased from 1m/s to approximately 3m/s.
Sensor data is recorded into the database as the vehicle moves along the sensing area. We also
checked the measurements of the 2-axis accelerometers on board the vehicle for any indication
of the vehicle‘s motion and direction, especially when the vehicle was making a turn.
Corresponding light, voltage/temperature, acoustic, accelerometer, magnetometer readings are
logged into the database for all the time instants. The position of the laser pointer was adjusted
on the vehicle in such a way that the light sensors can easily sense the laser beam.
2.2 Components of the Testbed
The key components of the testbed are:
Micaz Mote Kit 2400: The Micaz development platform, Mote-Kit 2400, is a
comprehensive 8 node kit for commercial Mote development from Crossbow
Technology, Inc [7]. The Micaz motes are designed for deeply embedded sensor
networks.
The 2400 series kit has all of the components needed to develop, test and implement a
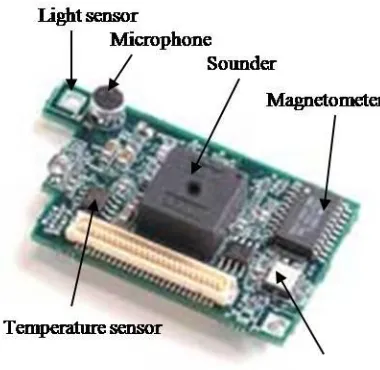
wireless sensor network. The kit includes: MTS310CA sensor board with multiple
sending modalities. The sensor boards can measure light, temperature, barometric
pressure, acceleration/seismic and acoustic sounds.
BU 581SRW Sony CCD Bullet camera: Thesmallest outdoor color bullet camera using a
11
excellent low light sensitivity. It is easy to exchange the lens with a variety of angle of
depending on the requirement of the application [8].
2.3 Overview of Vehicle detection and tracking
This section explains steps in the vehicle detection and tracking using wireless sensors
and video cameras. Figure 2 shows different modules in the form of a block diagram.
Figure 2: Overview of vehicle detection and tracking using wireless sensors and video cameras.
Experimental setup: This section deals with the details of the experimental setup and
the key components of the testbed. The testbed setup involves both the wireless sensors and the
video cameras.
Sensor data logging and monitoring: Functional details of light and acoustic sensors
are discussed. This section also describes the software needed for sensor data logging and steps
to installing TinyOS applications onto a mote sensor. Different methods of retrieving sensor
data measurements are discussed.
Vehicle detection using sensor measurements: This section discusses the sensor data
12
Preprocessing of video sequences: The preprocessing techniques include conversion of
a video sequences into set of images, background subtraction method to extract the target from
an image and calculation of the vehicle centroid.
Camera calibration: Camera calibration is an important part of most computer vision
systems. Camera‘s intrinsic parameters (e.g., the focal length) and its position in the world
coordinate system are not known in advance. All these parameters are determined using
geometric primitives commonly found in traffic scenes. Using these parameters, ground plane
rectification can be done. If a pixel in the image appears on the ground plane, its 3-D
coordinates can be found in the world reference frame.
Integration of camera and sensor data measurements: In our experiment, the
wireless sensors were used for vehicle detection and video cameras were used for tracking.
Tracking is considered a process of data association that links the detection results from
individual frames to a temporal trajectory. One of the main challenges we faced during the
experimental analysis was to fuse the data obtained (vehicle location estimates) from both
wireless sensors and the three cameras to obtain a meaningful representation of the vehicle‘s
motion. The method that we adopted will be discussed in Chapter 5.
Error Analysis: Video data is compared against the sensor measurements used for
vehicle detection. The responses of vehicle detectors, i.e., the sensors are accumulated over time
to obtain the trajectory of the detected vehicle locations. The detected vehicle is tracked in the
video frames with the help of perspective projection model and the camera parameters. We
estimate the vehicle motion by calculating the centroid of the vehicle in each of the frame, and
13
Chapter 3 – Vehicle detection using wireless sensors
3.1 Overview of wireless sensor networks
Wireless sensor networks are comprised of a large number of small sensing devices
commonly known as motes. The motes have a low clock rate processor on board as well as a
small amount of memory [9]. They also have some form of a specific or multiple functionalities
attached to them in order to monitor physical properties. These sensors can be built directly into
the motes main board or can come as add on boards which can be connected in some way to the
mote. Collectively these motes are able to form themselves into autonomous ad-hoc networks
using a variety of communication mediums. The most common medium is radio frequency
communication. These networks of motes are able to collect, process and store data from
sensors. They are also capable of sharing data with each other.
Wireless sensor networks are very versatile and can be used in many different
application areas. The individual motes that form a sensor network are relatively inexpensive.
They require no maintenance once deployed as they automatically form a wireless ad-hoc
network which is completely autonomous. Recent examples of applications developed for these
networks include tracking military vehicles and monitoring forest fires. To support these
applications the TinyOS operating system has been developed to control the operation of the
mote devices. Among other software products for wireless sensor networks, TinyOS provides a
customizable networking stack which includes message passing functions. This allows motes to
form an ad-hoc network in order to communicate with other motes and possibly other types of
devices.
3.2 Applications of Wireless Sensor Networks
The applications using wireless sensor networks can be classified into six major
categories such as Military, Environmental, Habitat monitoring, Health, Home and Office,
14
Military Applications
Wireless sensor networks can be an integral part of military command, control,
communications, computing, intelligence, surveillance, reconnaissance and targeting systems.
Since sensor networks are based on the dense deployment of disposable and low-cost sensor
nodes, destruction of some nodes by hostile actions does not affect a military operation which
makes sensor networks concept a better approach for battlefields. Some of the military
applications of sensor networks are battlefield surveillance, targeting, battle damage assessment,
and nuclear, biological and chemical attack detection.
Environmental Applications
Some environmental applications of sensor networks include tracking the movements of
birds, animals, and insects; monitoring environmental conditions that affect crops and livestock,
chemical/ biological detection, forest fire detection, flood detection and pollution study.
Habitat Monitoring Applications
Sensor networks are being deployed in natural parks and wildlife reserves to closely
monitor and aggregate data from animal and plant life. Great Duck Island System is one such
application for Habitat Monitoring [10] where the Mica motes are deployed using an Atmega
103 microcontroller running at 4M Hz, 916M Hz radio from RF monolithic to provide
bidirectional communication at 40kbps and a pair of AA batteries. 32 motes were placed at area
of interest. These motes transmit sensor data to a gateway, which is responsible for forwarding
the data to a remote base station.
Health Applications
Some of the health applications for sensor networks are providing interfaces for the
disabled; integrated patient monitoring diagnostics; drug administration in hospitals;
tele-monitoring of human physiological data; and tracking and tele-monitoring doctors and patients
inside a hospital. Some other similar applications include glucose level monitors, organ
15
biomedical sensors inside human body is promising, although many additional challenges exist:
the system must be extremely safe and reliable and must require minimal maintenance.
Home and office Applications
Sensors are envisioned to be ubiquitous, integrating themselves to all household
appliances. Such devices are connected to actuators which take an action when the environment
changes to a particular state. End users could communicate with these devices making control
decisions remotely. Some of the important applications could be Smart Homes where sensors
make intelligent decisions such as controlling the room temperature, turning on the lights etc
and Environmental control in office buildings where a distributed sensor network can be used to
control the air flow and temperature.
3.3 Vehicle detection using wireless sensors
Wireless sensors are integrated with video cameras to develop a target surveillance
testbed for small scale illustration of vehicle detection and tracking. In this chapter we describe
the experimental work for vehicle detection using sensor node data. Both light and acoustic
signals are processed for vehicle detection. The sensor nodes used in our vehicle detection
experiments are the Micaz motes, a part of the Micaz development platform, Mote-Kit 2400.
The key components are described in detail along with the functionality.
3.3.1 Micaz Mote – Kit 2400
The Micaz development platform, Mote-Kit 2400, is a comprehensive 8 node kit for
commercial Mote development from Crossbow Technology, Inc [7]. Being low-power, IEEE
802.15.4 compliant, offering 250kbps high data rate, and a ‗plug and play mote‘ compatible to
all the sensor boards and gateways, we have chosen the Micaz motes in our testbed. The Micaz
motes are designed for deeply embedded sensor networks. Belonging to the Mica line of
Cross-Bow, it features new Micaz (MPR2400CA) Processor/ Radio board. The Micaz has a 51-pin
expansion connector that supports analog inputs, digital I/O, SPI and UART. The expansion
connector works for light, temperature, RH, barometric pressure, acceleration/seismic, acoustic,
16
Figure 3: Micaz mote
For more details and specifications, please refer to the Micaz manual [11].
The 2400 series kit has all of the components needed to develop, test and implement a
wireless sensor network. The kit includes: MTS310CA sensor board with multiple sending
modalities as shown in Figure 4. The sensor boards can measure light, temperature and acoustic
sounds and also has a sounder. We have used the light and acoustic modalities in our
surveillance testbed. The basic components are: the mother board consisting of an Atmel
90LS8535 processor, 512KB SRAM, 8KB Flash RAM and a RF transceiver for wireless
communication.
17
The Senor board consists of a 10-bit analog to digital converter, a
Magnetomer(Honeywell HMC1002), a temperature sensor, a photo camera and an
accelerometer sensor.
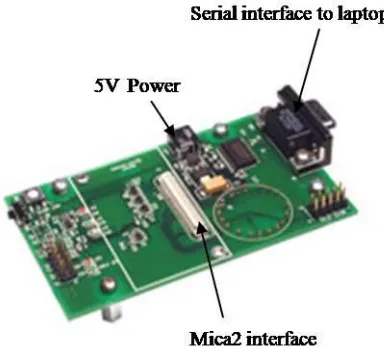
3.3.2 MIB510 Programming board
The MIB510 gateway allows for the aggregation of sensor network data on a PC. In
addition to data transfer, the MIB510 also provides an RS-232 serial programming interface.
With an onboard processor, it is capable of programming Micaz and Mica2DOT processor radio
boards.
Figure 5: MIB510 programming board
It acts as a base station for wireless sensor networks via standard MICA2 processor
radio board and supports serial port programming for all MICA hardware platforms. For more
details and specifications, please refer to the Micaz manual [11].
3.3.3Functionality of the acoustic and light Sensors
In vehicle detection module, the sensors we adopted are the light and acoustic sensors.
18
Light Sensor:
The MTS310 sensor board has a light sensor and a thermistor. The light sensor is a
simple CdSe photocell. A photoresistor or light dependent resistor or cadmium sulfide (CdS)
cell is a resistor whose resistance decreases with increasing incident light intensity. It can also
be referred to as a photoconductor. Based on the working principle of the light sensor, if the
light from the vehicle is of high enough frequency, the resistance of the photocell is lowered
thereby increasing the sensor measurements corresponding to the vehicle‘s proximity to the
sensor. The collected sensor data is used to detect the vehicle‘s presence.
Acoustic Sensor:
Surveillance systems with acoustic sensing devices measure the acoustic energy or
audible sounds produced by a variety of sources within a vehicle. The overall sound energy
level increases when a vehicle passes the detection zone. The sensor node used was Micaz with
sensor board MTS310. The acoustic sensor on the sensor board MTS310 is a Panasonic
WM-62A microphone, which is an omni-directional condenser type microphone. A stretched metal
diaphragm forms one plate of a capacitor. A metal disk placed close to the diaphragm acts as a
backplate. When a sound wave excites the diaphragm, the capacitance between the two plates
varies according to the variation in the sound pressure. The change in the capacitance generates
an output proportional to the sound pressure, which is at an ultra low-frequency pressure
variation. A high-frequency voltage (carrier) is applied across the plates and the acoustic sensor
output signal is the modulated carrier. Vehicle detection from the acoustic sensor measurements
is discussed in the subsequent sections.
3.3.4 Supporting hardware and software
TinyOS
An open-source OS designed for wireless embedded sensor networks. Its
component-based architecture enables rapid implementation while minimizing code size as required
19
Not an operating system (―OS‖) in the traditional sense; it is a programming framework
for embedded systems and set of components that enable building an application-specific
OS into each application.
No file system, supports only static memory allocation. TinyOS has been built using
nesC. It is built using components and interfaces.
nesC
The TinyOS system, libraries, and applications are written in nesC, a new language for
programming structured component-based applications. The nesC language is primarily
intended for embedded systems such as sensor networks. nesC has a C-like syntax, but supports
the TinyOS concurrency model, as well as mechanisms for structuring, naming, and linking
together software components into robust network embedded systems. The principal goal is to
allow application designers to build components that can be easily composed into complete,
concurrent systems, and yet perform extensive checking at compile time. Additional details
about TinyOS and nesC can be found in the manual [13].
3.4 Hardware setup
Before the wireless sensors can be used for vehicle detection, the hardware setup and
installation of the applications onto the motes has to be completed. After the installation is over,
the motes have to be verified if the programs installed are working properly. Only after the
hardware check is completed, the motes are ready for the experiment and data acquisition. This
section will describe the steps required to setup, test and program the Micaz hardware. For
further details about the hardware setup, please refer to the TinyOS tutorial on testing the
hardware [14].
3.4.1 Hardware Installation
SwitchSettings: The Micaz platform has a single slide switch which should always be in
the OFF position while programming the motes. It is the power switch for the batteries. In the
OFF position, the switch disconnects the batteries. During normal operation (not connected to
20
mote. The MIB510 programmer has a single slide switch that affects how data is sent on the
serial com port. It must be in the OFF position to both program and use the motes.
3.4.2 Preparing the motes
Install the appropriate batteries; Attach the antennas to the Micaz motes if not already
connected. Switch Micaz battery switch to ―ON‖ position. As a first step, the MTS300
Sensor Board is attached to one of the Micaz motes by pressing its 51-pin connection
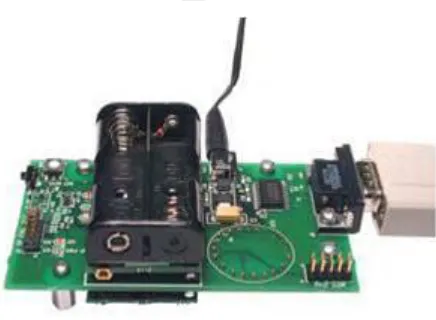
socket with that of Micaz. Two AA batteries each are then placed in the motes, except in
the mote that is to be attached with the MIB510 base station.
Setting up the base station: Attach the Micaz mote labeled ―Base_###_0‖ or ―Surge_0‖
to the MIB510, the base station, where ### refers to the frequency band of the Mote (i.e.,
2400 in our case). Supply power to the MIB510 with the AC wall power adaptor. One
thing to note here is that when connecting the mote to the MIB510 base station, one
tends to push the mote onto the MIB510 51-pin connector with less force since both the
mote and the base station seem quiet fragile.
Connect the MIB510 to the PC‘s serial port (or USB to serial or PCMCIA serial adaptor)
with a straight-through RS-232 cable.
3.4.3 Installing TinyOS applications onto a mote
The programming tools also include a method of programming unique node addresses
without having to edit the TinyOS source code directly. To set the node address/ID during
program load, the general syntax for installing is:
make <platform> re|install,<n> <programmer>,<port>
where <programmer> ,<port> name of the programmer, port ID or address or number of the
host PC to which the programmer is attached,,<n> is an optional number (in decimal) to set the
node ID or address, and <platform> is the type of Mote processor/radio hardware platform.
Here is the command to assign a node address/ID of 38 to a MICA2 and the MIB510
programming board on the PC‘s COM1 serial port.
21
The difference between install and reinstall is explained below.
install,<n>—compiles the application for the target platform, sets the node ID/address
and programs the device (Mote).
reinstall,<n>—sets the node ID/address and downloads the pre-compiled program (into
the Mote) only and does not recompile. This option is significantly faster.
TinyOS application is programmed individually on all the motes. Open the cygwin
window and point to the following location:
C:/tinyos/cygwin/opt/tinyos-1.x/contrib/xbow/apps/. Based on the type of mote being programmed, navigate to the
corresponding folder under /apps.
The first step is to install the TinyOS application on the base station using the command
make mica install, 0 mib510, com4,
Where ‗0‘ refers to the ‗nth‘ number of mote and mib510 refers to the programmer and
com4 refers to the port number to which the programmer is connected to. The same procedure is
repeated to program all the remaining motes.
3.4.4 Testing the motes
This section will describe how to test the Micaz mote hardware. Detailed information
about testing the motes can be found in [14].
22
Making MicaHWVerify
Open a ‗cygwin bash shell‘ and type the following commands:
cd /opt/tinyos-1.x/apps/MicaHWVerify make mica2
At this point we now have a custom Micaz compatible program ready to be programmed into
the mote.
Programming MicaHWVerify via the MIB510CA programmer
The previous step created an application ready for transferring into the Micaz. To write
the firmware image to the Micaz chip, type the following command:
make mica reinstall mib510,/dev/ttyS0
Note: The above command is case sensitive. /dev/ttyS0 = com1 /dev/ttyS1=com2
/dev/ttyS2=com3 /dev/ttyS3=com4.
Hardware COMMS check
Now we know that the programming tools and the computer's parallel port are working.
The next step is to verify the mote hardware. First, confirm that the LEDs are blinking like a
binary counter. Next, connect the programming board to the serial port of the computer. This
step will attempt to communicate with the Micaz. Make sure the slide-switches on both the
programmer board and the Micaz are set to OFF. To read from the serial port, we provide a
java tool called hardware_check.java. It is located in the same directory. Build and run this tool.
Type the following command:
make –f jmakefile
MOTECOM=serial@COM1:<baud rate> java hardware_check
Example, if COM1, the port is being used at 19.200 Kbaud to connect to the
programming board. The commands listed above are case sensitive. It is helpful to perform this
test on at least 2 Micaz nodes. This program checks the serial ID of the mote, the flash
connectivity, the UART functionality and the external clock. If all status checks are
positive, the hardware verification successful message will be printed on the PC screen. If any
23
Radio Verification Test
This test requires 2 Micaz nodes. One unit will be used as the base root node and the
second node will be used as the remote node. During the test, both the nodes will communicate
with each other via the radio link.
Node #1: Take one of the nodes that has passed the ‗Hardware COMMS Check‘, install the
batteries and slide the switch to ON. The lights on the Micaz will start to blink, the node is now
active!
Node#0: This node will be the root node and will stay connected to the programmer board. It
must have some special ‗base station‘ software programmed onto the Micaz in order for this test
to operate correctly. To compile and load the base station software onto the Micaz, type the
following commands:
cd /opt/tinyos-1.x/apps/TOSBase
make mica2
make mica2 reinstall mib510,/dev/ttyS0
Re-run the ‗Hardware Comms Check‘
cd /opt/tinyos-1.x/apps/MicaHWVerify
MOTECOM=serial@COM1:mica2 java hardware_check
The Node Serial ID report will be displayed. The ID of the remote node was displayed,
not the Node ID of the Micaz plugged directly into the base station. The base station acted as a
data conduit passing the serial data onto the radio network; the remote node responded to the
data on the RF interface. If the remote mote is turned off or not functioning, it will return a
24 3.5 Data logging
3.5.1 Mote-View
Wireless sensor networks monitoring software developed by Crossbow Technology
[15]. It is an interface ("client tier") between a user and a deployed network of wireless sensor
providing the tools to simplify deployment and monitoring. It provides an easy means of
logging wireless sensor data to a database, analyzing and plotting sensor readings. The setup
looks as follows: all the sensor nodes are preloaded with XMesh software. Programming the
nodes can be done from within the Mote-View application. Basically, the applications running
on the nodes send sensor reading data to the gateway node which posts the readings to a
database. Different applications for different node configurations (sensing equipment,
processor, power modes and frequency bands) are included with the Mote-View software. It
requires a full-fledged database running on the machine where the sensor data is stored.
Depending on the type of mote being programmed, data is logged into corresponding table in
the postgreSQL database. Mote-view connects to the remote Postgres database through a
TCP/IP link.
Mote-View has a number of useful features for monitoring and understanding wireless
sensor data. These features include:
Historical and Real-Time Charting
Topology Map and network visualization
Data Export capability
Printing the graph results
Node programming with MoteConfig
Command interface to sensor networks
Additional Software Requirements: For the application to run the following additional
components are required:
25
PostgreSQL 8.0 database service and postgreSQL ODBC driver
Microsoft .NET 1.1 framework
Surge-View
The installation files are included on the Mote-View installation CD.
3.5.2 PostgreSQL 8.0
A powerful, open source relational database system known for reliability, data integrity,
and correctness. Is highly scalable both in the sheer quantity of data it can manage and in
the number of concurrent users it can accommodate [15].
Runs on all major operating systems, including Linux, UNIX (AIX, BSD, HP-UX, SGI
IRIX, Mac OS X, Solaris, Tru64), and Windows.
All the visualization tools in Mote-View require being connected to a database. This
database can reside on the PC (―localhost‖), a remote server, or a Stargate. The size of
this database is bound by the storage available on the system.
The installation of PostgreSQL will automatically install and configure a local
PostgreSQL 8.0 database on the machine [15].
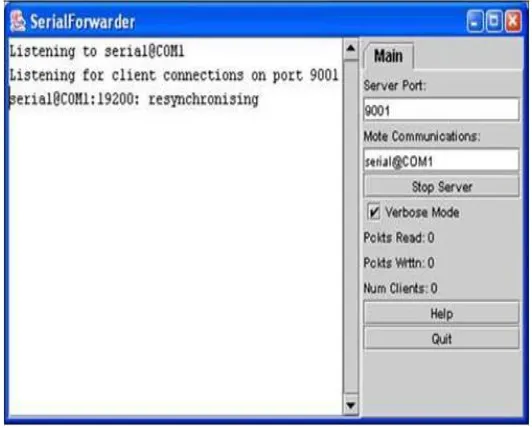
3.5.3 SerialForwarder GUI
A program written in Java, it is used to read packet data from a computer‘s serial port
and forward it over a server port connection, so that other programs can communicate
with the sensor network via a sensor network gateway [16].
It does not display the packet data itself, but rather updates the packet counters in the
lower-right hand corner of the window.
Once running, the serial forwarder listens for network client connections on a given TCP
port (9001 is the default), and simply forwards TinyOS messages from the serial port to
26
serial forwarder at once, and all of them will receive a copy of the messages from the
sensor network.
Figure 7: Serial Forwarder GUI
3.5.4 Xlisten
Xlisten is a user interface that serves as a tool to test the functionality of available data
acquisition boards (DAQs). It displays the DAQ‘s output in a Cygwin window. Xlisten needs a
DAQ board application and a driver, which can be modified to develop custom applications and
to meet data logging needs. Xlisten is a program included with TinyOS installation. It can be
found in the following folder: c:\tinyos\cygwin\opt\tinyos-1.x\contrib\xbow\tools\src\xlisten.
The boards drivers are located at opt/tinyos-1.x/contrib/xbow/tos/sensorboards and the
XSensor Applications are located at: opt/tinyos-1.x/contrib/xbow/apps/. Xlisten can be used to
test motes:
Over the UART
Over the RF
For a single mote configuration, the mote must be programmed with XSensorMTS310
27
radio. For the network of motes configuration, a base station mote needs to be programmed with
TOSBase and plugged into the MIB510. All other motes need to be installed with an
XSensorMTS310 application and put within range of the base station or a valid multihop peer.
Xlisten must then be run with the -w flag to properly parse the wireless packets. Please refer to
manual [16] for instructions on how to program a mote, and for a more complete discussion of
the Xlisten display options. Proper care is to be taken to ensure that all the motes are
programmed to the same frequency and group id.
3.6 Sensor data monitoring using Mote-View
During the installation of Mote-View a static database was included to make it possible
to demonstrate Mote-View’s features without having to be connected to an active sensor
network or to be connected to a remote server/database [15]. Mote-View uses XServe™ data
logging software to insert readings consolidated at a MIB510 interface gateway into the
PostgreSQL database. A table in the database corresponding to the motes is selected. The sensor
data can then be displayed within Mote-View in the form of a spreadsheet, chart, and topological
map. The log to database option selected when connecting to a MIB510 enables us to view live
sensor network data.
In order to have Mote-View display data from an active sensor network, the users must
check on the ―Live‖ checkbox. In Live mode, Mote-View refreshes the node list, charts, and
topology views at a regular interval, the default being 10 seconds. Mote-View‘s visualization
tabs provide three ways to view the sensor data. The main display of the user interface consists
of the four tabs:
Data: Displays the latest sensor readings received for each node in the network.
Command: The command tab provides the user with an ability to change different node
parameters wirelessly.
Chart View: The chart view provides the ability to generate graphs of a sensor reading
against time for some set of nodes, with y axis being time and x axis being data in
28
Topology View: The topology view shows a map of the network of motes, including
placement and parenting information. This allows the user to define and view a topology
of their mote deployment.
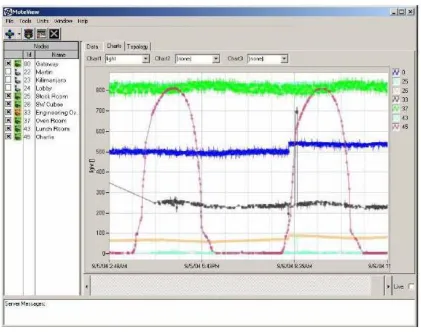
Figure 8: Mote-View window illustrating the charts feature
Always visible on the left hand side is the node list, which quickly shows the nodes that
have been reported. Health of the network can be evaluated quickly by looking at the node list
on the left. The colors of the node icon signify how long it has been since data has been
received from that node.
Green - a healthy node reported within the last 20 minutes.
Red – inactive since 24 hours,
Orange – inactive in the past one hour
Yellow – inactive for the last 40 minutes
29
Gray - a mote that was added by the user, but has never reported in.
3.7 Sensor data retrieval
3.7.1 Using PostgreSQL and SQL commands
PostgreSQLis an advanced relational database system that is provided with the Cygwin
on the PC and is available on the Stargate. The database tables that Mote-View accesses can be
manipulated directly by advanced users. To access the PostgreSQL database, from a Cygwin
shell type [15]
psql –h localhost –U tele task
Here ‗task‘ is the name of the database
Once the database is accessed, the tables can easily be accessed using SQL commands.
SQL is the generic command language used to manipulate databases such as PostgreSQL. SQL
commands can be typed in directly from the PostgreSQL command shell.
PostgreSQL comes with other tools for offline manipulation of data besides the psql
shell. The more useful of these are described here.
PostgreSQL Export: To output entire task database to a file, e.g., my_database.out
pg_dump –h localhost –U tele –f my_database.out task
Data can be exported in two different formats: XML or CSV (comma separated values).
To save contents of surge_results table to a file of SQL commands named surge.out:
pg_dump –h localhost –U tele –t surge_results –f surge.out task
PostgreSQL Import: To load files from a PostgreSQL exported table, use the following
command:
30
The output file can be read by a text editor, word processor, or spreadsheet program.
3.7.2 Using Xlisten and Matlab
Xlisten is the application that runs on the PC to obtain the data sent by the MIB510
board to the serial port. Xlisten is located at ―/opt/tinyos-1.x/contrib./tools/src/xlisten/‖. To run
Xlisten, change to the above directory where Xlisten is located. Compile Xlisten if necessary by
entering the command ―make‖. The file ―xlisten.exe‖ shall appear if the program is compiled
without any error. Enter the command
$ ./xlisten –p –s=com# >output_file.csv
The file ―output_file.csv‖ would be saved to Xlisten directory as a comma separated
variable file. The option -s=com# means Xlisten is using port #4. The port differs from
computer to computer if a real com (serial) port is not used. Cooked option is used, -c, the data
from the sensors is converted to engineering units, which can be used for further analysis.
Detailed information about the different modes and display options of Xlisten can be found in
the manual [16].
The file saved using the redirection operator >, can be opened with excel to manipulate
and graph the obtained data. If Xlisten is run again and the same name is given to the log file,
the file ‗output_file.csv‘ is overwritten by the new data values by Xlisten. The ‗.csv’ files can be
imported into Matlab for further data processing.
3.8 Assumptions and limitations of data collection using wireless sensors
During the course of the experiment, we have made certain assumptions that will be
helpful in the sensor data processing.
The experiment is carried in a dark room, so that any change in the conditions in the
room (such as light and sound) could be attributed to that of the vehicle being monitored
which we refer to as the ‘target’.
The speed of the target is assumed to be fairly constant and it moves in a straight line.
31
heavily on the operation of the remote controller with timely acceleration and
deceleration.
The time stamp at which the sensor data is logged into the database, the time registered
in the video camera should coincide with the actual time.
When a sensor reading exceeds the base value by a predetermined threshold value, in our
case the threshold value is 20 ADC, a target is declared present.
3.9 Sensor data processing for vehicle detection
The testbed setup for this experiment involves both wireless sensors as well as the video
cameras. A remotely controlled vehicle with two sensors and a flash light onboard will be
monitored by Micaz motes. The coverage area is crossed by the vehicle assumed to be moving
at constant velocity. We assume that only one vehicle is in the region during the time of
experiment. The task of the testbed is to detect the vehicle and determine its motion trajectory.
Flash light is pointed at motes equipped with light sensors that detect the presence of a passing
vehicle. The Micaz motes with acoustic and light sensor functionalities are used as low
resolution sensors deployed into the experimental area. The sensor measurements are analyzed
to detect the presence of the vehicle. The sensor measurements are retrieved from the database
using the methods described in Section 3.7.
The initial data collected from the environment (without the vehicle‘s presence) is used
to set the base value (representing the condition of no vehicle presence). Later when the vehicle
comes in the vicinity of the sensor the current sensor measurement is compared with the base
value. The difference between the measurements is used to make the decision of the vehicle‘s
presence. If the difference between both the measurements is greater than a preset threshold
value, we declare the vehicle‘s presence. If the difference is less than the threshold, we declare
that there is no vehicle present at that time instant.
When the target enters the coverage area, it could be detected by multiple sensor nodes
depending on their distances from the target. Detection times are used to estimate the vehicle