A WIRELESS SENSOR DATA FUSION FRAMEWORK FOR CONTAMINANT DETECTION
by Joshua Kiepert
A thesis
submitted in partial fulfillment of the requirements of the degree of Master of Science in Computer Engineering
Boise State University
BOISE STATE UNIVERSITY GRADUATE COLLEGE
DEFENSE COMMITTEE AND FINAL READING APPROVALS
of the thesis submitted by
Joshua Kiepert
Thesis Title: A Wireless Sensor Data Fusion Framework for Contaminant Detection Date of Final Oral Examination: 25 June 2009
The following individuals read and discussed the thesis submitted by student Joshua Kiepert, and they also evaluated his presentation and response to questions during the final oral examination. They found that the student passed the final oral examination, and that the thesis was satisfactory for a master’s degree and ready for any final modifications that they explicitly required.
Sin Ming Loo, Ph.D. Chair, Supervisory Committee Robert Davidson, Ph.D. Member, Supervisory Committee
Arvin Farid, Ph.D. Member, Supervisory Committee
ACKNOWLEDGMENTS
I would like to thank my thesis advisor Dr. Sin Ming Loo for both his guidance and friendship throughout the course of this research and academic pursuits.
Additionally, I would like to thank all of the people who have been involved with this research, as it would not have been possible without their significant contributions: Jon Bills, Mike Owen, Mike Pook, Derek Klein, Arlen Planting, Mike Martin, and Dereck Rasmussen.
Finally, I would like to thank my family for their love and support during this process and always, and in particular, my wife Araya, who has supported and cared for me despite the long hours I have been locked away working on my academic career. My thanks seem hardly sufficient to convey my heartfelt appreciation for her love and support, which, in no small part, have been responsible for allowing me to complete this thesis.
This work is funded by FAA Cooperative Agreement No. 04-C-ACE-BSU and 07-C-RITE-BSU1.
1
ABSTRACT
A Wireless Sensor Data Fusion Framework for Contaminant Detection Joshua Kiepert
Master of Science in Computer Engineering
TABLE OF CONTENTS
ACKNOWLEDGMENTS ... v
ABSTRACT ... vi
LIST OF FIGURES ... x
LIST OF ABBREVIATIONS ... xii
CHAPTER 1: INTRODUCTION ... 1
1.1 Wireless Sensor Networks ... 1
1.2 History of Sensor Data Fusion ... 2
1.3 General Purpose Hardware ... 3
1.4 Software for Sensor Data Fusion ... 3
1.5 Contributions ... 4
1.6 Overview ... 6
CHAPTER 2: PREVIOUS WORK AND EXISTING TECHNOLOGY ... 7
2.1 Previous Research ... 7
2.2 Existing Technology ... 9
2.2.1 Crossbow Technologies ... 9
2.2.3 Firefly WSN Platform ... 10
CHAPTER 3: SENSOR DATA FUSION FRAMEWORK ... 11
3.3 Sensor Node (level 1 to 4) ... 13
3.4 Communication and Interface (level 5 to 6) ... 14
CHAPTER 4: HARDWARE DESIGN ... 16
4.1 General Purpose Sensor Modules ... 16
4.2 Wireless Capabilities ... 16
4.3 Modular and Reconfigurable Design ... 17
4.4 Processor ... 18
4.5 Power ... 19
4.6 Sensor Integration ... 19
4.7 Communications ... 20
4.8 Data Storage and Transmission ... 21
4.9 Time Management ... 23
4.10 Systems Integration ... 23
CHAPTER 5: SOFTWARE DEVELOPMENT ... 26
5.1 Sensor Module Firmware ... 26
5.1.1 Implementation Details ... 26
5.2 Computer Software ... 34
5.2.1 Plotting ... 34
5.2.2 Data Sink ... 35
5.2.3 Sensor Module Control ... 35
5.2.4 Real-Time Data Fusion ... 37
5.2.5 Database ... 39
5.2.6 Implementation Details ... 39
5.3 Sensor Network Simulation ... 42
6.1 Necessity of Time Synchronization ... 45
6.2 Network Time Protocol ... 45
6.3 Single-Pulse Synchronization ... 46
6.3.1 Performance Characteristics ... 47
6.4 Reference Broadcast Synchronization ... 51
6.5 Summary ... 53
CHAPTER 7: SENSOR DATA FUSION AND APPLICATIONS ... 54
7.1 Sensor Data Fusion ... 54
7.2 Applications ... 59
CHAPTER 8: CONCLUSIONS AND FUTURE WORK ... 62
8.1 Summary and Conclusions ... 62
8.2 Future Work ... 63
8.2.1 Hardware Improvements ... 63
8.2.2 RBS Implementation ... 64
8.2.3 Advanced Sensor Node Operating System ... 64
8.2.4 Field Testing ... 66
LIST OF FIGURES
Figure 1: Wireless Sensor Module Design Space ... 5
Figure 2: Star Network Configuration ... 8
Figure 3: Previous Sensor Node Prototype ... 8
Figure 4: Overall System Architecture ... 11
Figure 5: Wireless Sensor Data Fusion Framework ... 13
Figure 6: Sensor Module System Board ... 18
Figure 7: Example Identifier and Measurement Strings ... 22
Figure 8: Original Sensor Module Design, (a), vs. New Design (b) ... 24
Figure 9: Latest Sensor Module Hardware Design ... 25
Figure 10: Firmware Flow of Control (Simplified) ... 27
Figure 11: Firmware Layered Architecture ... 28
Figure 12: Sensor Table Structure ... 29
Figure 13: Sensor Identify Function ... 31
Figure 14: Sensor Measure Function ... 32
Figure 15: Top Level Identify and Measure Functions ... 33
Figure 16: BSU Sensor Monitor Data Plot ... 35
Figure 17: Two-Way Communication and Time Synchronization ... 36
Figure 18: Real-Time Sensor Data Fusion Dialog ... 37
Figure 19: Average Temperature Fusion Algorithm ... 38
Figure 21: Sensor Simulation Graphical View ... 43
Figure 22: Single-Pulse Synchronization Test Configuration ... 48
Figure 23: Single-Pulse Synchronization Timing ... 49
Figure 24: Time Phase Error between Sensor Nodes ... 50
Figure 25: JDL Data Fusion Model [17] ... 55
Figure 26: Characterization of an Entity through Data Fusion ... 58
Figure 27: Simulator Visualization of a Wave Front ... 60
LIST OF ABBREVIATIONS
ADC Analog-to-Digital Converter
API Application Programming Interface
ASCII American Standard Code for Information Interchange BSUSM Boise State University Sensor Monitor
CO Carbon Monoxide
CO2 Carbon Dioxide
CSV Comma Separated Values DoD Department of Defense
EEPROM Electrically Erasable Programmable Read-Only Memory FAA Federal Aviation Administration
GPIO General Purpose Input/Output GPS Global Positioning System I/O Input/Output
I2C Inter-Integrated Circuit
IDC Insulation Displacement Connector IFFN Identification-Friend-Foe-Neutral ISM Industrial, Scientific, and Medical JDL Joint directors of Laboratories MMSP Master Synchronous Serial Port NTP Network Time Protocol
PDA Personal Data Assistant PLL Phase-Locked Loop PWM Pulse Width Modulation
RBS Reference Broadcast Synchronization SD Secure Digital
SPI Serial Peripheral Interface SQL Structured Query Language SRAM Static Random Access Memory
UART Universal Asynchronous Receiver/Transmitter WSN Wireless Sensor Node
CHAPTER 1: INTRODUCTION
1.1 Wireless Sensor Networks
As science advances there is a continual need to provide new tools to study the world around us. Wireless technology, sensor data fusion, and microelectronics are just a few of the components that can be used to form tools, which may provide a large range of possible advancements. Whether it is an early warning system for the detection of
dangerous chemicals or a portable sensing system for diagnosing problems within complex machinery, the possible applications seems limited only by one's imagination.
Wireless sensor networks are comprised of many individual wireless sensor nodes (WSN). Each node is a small embedded system that includes a microcontroller, sensors, and a radio system that allows the nodes to communicate with each other and the outside world. This thesis focuses on a wireless sensor network framework for collecting environmental data in an effort to develop a sensing solution that fits within many design spaces. It includes the design and implementation of a highly portable, reconfigurable, and wireless sensor network for collecting environmental data over large areas, and in particular, the “back-end” interfacing, delivery, and storage such that different types of sensors can be interfaced to the sensor modules. With the use of different sensors based on different (orthogonal sensing technologies) detection technology, the data collected can be transferred to a central location and provide enough information for
This system, additionally, utilizes mesh network architecture to allow low power radios to be effective even with low sensor dispersion density or in environments that have obstructions which prevent line-of-sight communications. The software
framework is designed to allow a computer to be used to monitor all sensor activities as data is collected as well as allowing a computer to request information as needed.
1.2 History of Sensor Data Fusion
Sensor data fusion, as it applies to this thesis, is the process by which many sensor inputs are combined and processed by algorithms to provide an improved representation of the data. “Improved” may mean more accurate, more complete, or more reliable. The goal of sensor data fusion is to provide a dataset that can more easily be processed and comprehended by human observers.
Sensor data fusion research was started by the U.S. Department of Defense (DoD) when it began funding research for many different applications. Some of the research projects included: automatic target recognition using many diverse sensors (radar, satellite, etc) in concert for identification-friend-foe-neutral (IFFN) systems, target tracking systems, situation assessment, and others. One of the results of this research was the formation of the U.S. Joint Directors of Laboratories (JDL) Data Fusion Working Group in 1986 to develop common terminology to describe different processes within data fusion applications. This eventually led to the design of a data fusion model that could be used as a common basis for discussion of many aspects of data fusion tools and processes. Work in data fusion has since expanded to include many non-military
monitoring [1].
There are several ways data fusion can be used in concert with multi-sensor systems. Data fusion algorithms may 1) directly fuse sensor data to provide data aggregation and thus reduce large data sets to a more easily managed collection, 2) fuse sensors to provide a virtual sensor entity on which higher level queries can be leveraged, or 3) utilize a wide range of common sensor inputs to make inferences or decisions that would not otherwise be possible by analyzing any of the sensors individually.
The work of this thesis focuses on the design and implementation of a framework (hardware and software) that can provide a means to apply data fusion algorithms both for data aggregation and for making inferences and decisions based on a wide range of data from wireless sensor networks. With these goals in mind, it is necessary to design the framework to support many different types of sensors and provide as much flexibility as possible with regard to managing the data collected from sensor networks.
1.3 General Purpose Hardware
With universal applications in mind, it was important to build a system that utilizes standard device communication protocols, device power supply voltages, data storage formats, and standard general communication protocols to interact with outside computer systems. In addition to the general purpose electronic design, a layered and highly abstracted design was required in the embedded operating software to enable control of any type of hardware that may be attached to the system.
1.4 Software for Sensor Data Fusion
identify abnormal events and help reduce false positives. The system described in this thesis is designed to store received data in a database, which allows high powered computing systems to analyze the collected data as it becomes available. With the data available and accessible at one location, diffusion and pattern algorithms can process the data in near real-time, which may aid the detection of contaminants.
Aside from the hardware and embedded software, the work of this thesis has also been the development of software for computers to not only serve as a data sink for networked sensor modules, but also provide a means to do real-time data analysis. The software also allows fusion of sensor data to help users of the system to better identify important information the sensor system has collected.
This goal has in turn resulted in the need for simulation software to help better characterize the fusion algorithms employed without setting up experiments, which would be difficult to control particularly when the testing environment must be spatially large.
1.5 Contributions
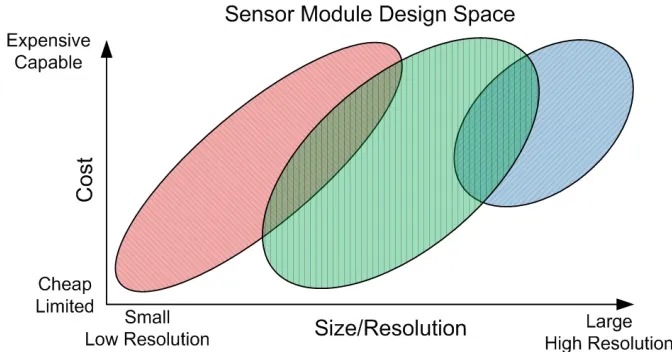
[2], with a sufficient number of low resolution sensors, a larger coverage area is achievable at the same cost, which can offset the benefits of high resolution sensor modules. Our focus, in contrast, has been to look at the middle ground of this design space. Is it possible to provide a sensor module design and supporting framework that offer an inexpensive solution that has good capabilities? We believe, and will show, that it is possible to achieve most of the benefits of both inexpensive and expensive, high resolution sensor modules. Figure 1 shows a graphical representation of the design space we are targeting.
Figure 1: Wireless Sensor Module Design Space
As depicted in Figure 1, the design space of sensor module hardware falls into several categories. In the far left area we have designs that range from limited and inexpensive to expensive and capable, with few sensors. The far right area represents sensor nodes that are expensive, possibly with several high resolution sensors. Our design is targeted to the center area of the figure, in that it is designed to be easily configured for applications that require either only low resolution sensors or high
node to meet the specific application requirements without re-engineering the hardware or firmware of the sensor module2.
1.6 Overview
In the following chapters we will discuss many of the topics surrounding sensor data fusion platforms as it applies to our work. In Chapter 2 we will describe some of our previous work in sensor network technology as well as some of the existing technologies that are under development in the sensor networking field. In Chapter 3 we will describe our sensor data fusion framework in terms of the design parameters that were considered and the general architecture of the system that we have designed. Chapter 4 outlines the design and implementation of our sensor module hardware in terms of each feature that we believe are important to any general purpose sensor system. In Chapter 5 we discuss the software development both for the embedded firmware that resides on the sensor modules and computer software that serves as a link between sensor networks and the outside world. Chapter 5 also discusses some simulation software that has been developed in an effort to improve our ability to reliably test data fusion algorithms. In Chapter 6 we discuss the need for time synchronization and some of the algorithms that may be used to accomplish synchronization. Chapter 7 discusses how data fusion algorithms can be utilized to manage the large amount of data collected by sensor networks or extract information that could not be otherwise gleaned from individual sensors. Finally, Chapter 8 offers up some conclusions from this work as well as a brief description of some possibilities for future work.
2
CHAPTER 2: PREVIOUS WORK AND EXISTING TECHNOLOGY
2.1 Previous Research
Previous to this research much work was done to design a modular, flexible, and reconfigurable hardware platform for taking sensor measurements. This took the form of a small battery-powered device which could be configured with a wide range of
environmental sensors. The focus was to design a stand-alone sensor module with the capability to reconfigure the set of sensors on a sensor module with minimal
re-engineering. The sensor data storage medium was removable Secure Digital (SD) flash memory card. While there was hardware support for wireless communication, this feature was not fully explored [3], [4].
In the previous work, the sensor modules were designed to act as standalone data loggers that could be configured with a wide range of sensors. The data logging task did not require time synchronization or wireless capabilities as each module worked
sensor modules that were developed in [3].
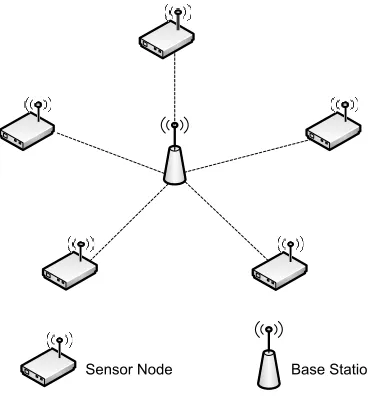
Figure 2: Star Network Configuration Figure 3: Previous Sensor Node Prototype
In a star network, as depicted in Figure 2, there is a fundamental restriction on how far the sensor nodes may be from the base station. This range is limited by the power of the transmitters and the size and type of obstructions between an individual sensor node and the base station. For our new design, we needed a more robust network architecture that could perform well with obstructions to line-of-sight, and operate with larger distances between sensor nodes. As seen in Figure 3, the previous sensor node design had individual circuit boards for the various components and many point-to-point connections between circuit boards. This architecture, while reconfigurable, still requires re-engineering to change the sensor configuration, and is prone to failure in harsh
2.2 Existing Technology
While there are several commercial and research sensor systems available that provide sensor hardware and networking capabilities, e.g. [6], [7], and [8], there are few systems that provide a complete sensing solution targeted for sensor data fusion
applications. There has been development of interface frameworks for sensor networks, e.g. [9], but few with sensor data fusion applications in mind.
Perhaps some of the most notable existing systems are found with Crossbow Technologies Inc [6] and a system that has been developed at Carnegie Mellon University (CMU) [10]. Each of these systems provides some of the functionality that is
implemented in our framework. Therefore it is important to look at how these systems compare with the work discussed in this thesis.
2.2.1 Crossbow Technologies
systems are cost-prohibitive when compared with our solution.
2.2.3 Firefly WSN Platform
CMU’s FireFly platform offers a similar solution in terms of the hardware and sensor options though this system is still targeted toward a limited number of sensors per mote. This system does employ an out-of-band time synchronization mechanism through the land-based atomic clock broadcast signal (WWVB) though it is capable of in-band synchronization. These nodes have been configured with sensor boards carrying several sensors such as light, temperature, audio, passive infrared motion, dual axis acceleration, and battery voltage sensors. The FireFly platform also includes models with mini Secure Digital cards for facilitating local data storage [12]. CMU has also implemented an advanced embedded operating system for the Firefly platform (known as Nano-RK), that manages sensor measurements and time synchronization. Some of the primary
differences with this system are the set of sensors that have been integrated and a hardware architecture that is closely tied to the wireless network radio as well as hardware-assisted time synchronization.
The hardware developed in this thesis does not offer capabilities beyond those that are currently available; it does provide a unique set of capabilities that are
CHAPTER 3: SENSOR DATA FUSION FRAMEWORK
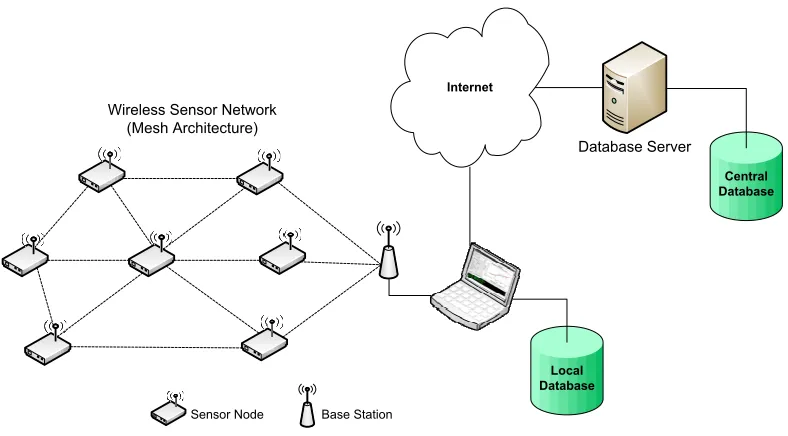
There are many possible system architectures that may be used to collect and process sensor data. The architecture of our system was chosen based on the idea that it should be flexible enough to allow other systems to utilize the collected sensor data, as well as allow on-site processing of the data (when the algorithms applied do not require significant computational power). Figure 4 shows the overall architecture of the system that our framework has been designed to achieve.
Figure 4: Overall System Architecture
system that may interact directly with the sensor network, both monitoring collected data, and potentially forwarding the data to a central database for further processing and
analysis. The computer system connected to the base station radio provides the gateway for data to be moved from the sensor network to a location that allows data fusion
algorithms to be applied. The computer system near the sensor network may also be used to directly control the sensor network and provide application of basic fusion algorithms that do not require significant computational power. Our wireless sensor data fusion framework contains each of these core elements for building a wireless sensor data fusion system. The framework includes both hardware and software, which makes it possible to insert data fusion algorithms to process the sensor data or aggregate data to a central database for high-powered analysis. This framework has a highly flexible design such that different sensors can be integrated into the sensor nodes without re-designing the overall system. The general objective of this design is to provide an implementation of a framework (hardware and software) such that once a sensor has been selected for a particular sensing application the system can be deployed quickly, and sensor data fusion algorithms can be inserted into the framework to analyze the data as desired. The
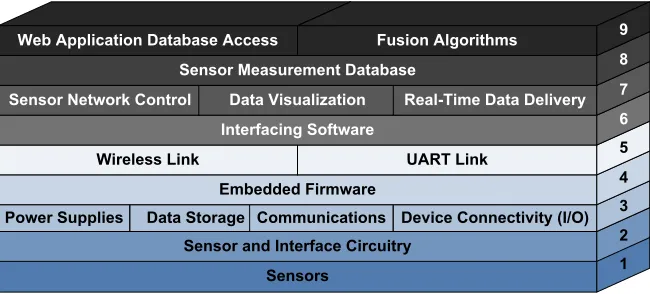
framework is shown in Figure 5. This diagram shows features that may be classified into three categories: (i) sensor node, (ii) communication and interface, (iii) database,
Figure 5: Wireless Sensor Data Fusion Framework
3.3 Sensor Node (level 1 to 4)
Sensor nodes with the contaminant detectors are the frontend of a wireless sensor fusion system. It is the element of the system that passively or actively measures the contaminant levels and reports the findings in a timely manner. As shown in Figure 5, the sensor node provides circuitry to interface to sensors as well as power sources and power regulation for sensors. Once data is collected from a sensor, it is processed, stored, and transmitted. The data transmission requires connectivity to the server (or sink node) through a wireless link.
To be effective, the sensor modules were required to meet many design
To meet the connectivity and re-configurability constraints, the hardware was required to have many input/output (I/O) ports and support for many communications protocols, to enable connections with numerous sensors as well as providing internal power supplies to meet a variety of sensor requirements.
As with the hardware, the sensor module firmware was required to be highly reconfigurable in that it needed to have an architecture that minimizes re-engineering when adding or removing sensors from the sensor module. To achieve this objective, the firmware design was required to exhibit data coupling and a functionally cohesive architecture.
3.4 Communication and Interface (level 5 to 6)
The communication link and interface are the critical infrastructure that delivers the sensed data to the proper destination. For sensor data fusion (residing in the backend to characterize and analyze the data) to work effectively, determining when the data arrives is critical. The delivery of sensor data depends on reliable wireless
communication channels. The wireless hardware was required to have a reliable, redundant, and robust network architecture formed between sensor modules (e.g. mesh network architecture) to meet wireless connectivity objectives. The base station might not be reachable directly (one hop away), but the data could be delivered through
intermediate nodes. More importantly, having multiple intermediate nodes will guarantee delivery of the data to the base station no matter what happens to any single node.
3.5 Database, Visualization, and Fusion (level 7 to 9)
processing happens. The sensed data (usually in significant quantities) is stored on a database server such that algorithms can be applied to “make sense” of the data. The raw data can be visualized, but with its intrinsic volume, visualization may be difficult; that is one area where sensor data fusion algorithms can help reduce the data set, allowing further attention to be placed on the reduced set. If effective analysis is to be done on the collected data, it must be organized such that relationships can easily be determined.
Both centralized and distributed database architectures have benefits. It is our belief that the backend should have flexibility, i.e., new fusion algorithms can be written to process the data without fundamental changes to the system. The system should provide “hooks” such that a new algorithm can be used to analyze the data. The timely arrival of data to the database server is important; however, one will need to define the “real-time” expectation of delivery. The greater the responsiveness needed, the greater the hardware and design costs to implement the system.
Once the data has been analyzed, the system will need to deliver the results to someone in a timely manner. The result could be a decision (e.g. yes, there is
contaminant; or no, nothing is out there) or a series of plots and graphs for human analysis.
CHAPTER 4: HARDWARE DESIGN
4.1 General Purpose Sensor Modules
For this research, the sensor module hardware was further refined and the wireless communication capabilities were expanded to include mesh network architecture.
Computer software was also developed to allow coordination of data collection and provide a facility to fuse the data collected across the network of sensor modules. This software was also designed to store the collected data in a centralized database for post processing.
4.2 Wireless Capabilities
There are many cases where it is difficult or impractical to effectively determine the state of an environment from a single measuring unit. When the environment is large or its conditions vary greatly over space or time, it becomes necessary to use multiple measuring units to provide enough sensor density to gain a full perspective of the environment in question. It is in these cases where a network of measuring units becomes important. A network allows the measured data to be correlated with each measuring unit in the environment and transmitted to a centralized database for detailed analysis. With the prevalence of low-power and inexpensive wireless communication devices, the creation of high density sensor networks is more easily achieved than it has been historically.
and mesh. The star architecture requires that all nodes connect directly to a single master node. This means that there is a fundamental limitation on how many members may be part of the network, as well as the maximum spacing between nodes. This also requires that there be an unobstructed “view” to the master node. Our system will form this type of network provided that all remote nodes are within range of the master node; however, it may dynamically change to form a mesh architecture, if obstructions or distance begin to interfere with a remote node’s communication with the master node.
Mesh architecture, in contrast, has fewer constraints with regard to the layout of the remote measurement units. This architecture allows for multi-hop communication; thus the master node may be located anywhere among the remote units and need only be within range of any one of the remote units. Any messages addressed to the master will be relayed as required to deliver the message to the master. This architecture is also far more robust in constrained environments where line-of-sight communication to all nodes directly is not possible. The dynamic formation of the different network types is
controlled by the radio hardware. The radio used in our system has an embedded processor paired with a microcontroller, which manages all of the low level communications with the radio hardware, including network formation.
4.3 Modular and Reconfigurable Design
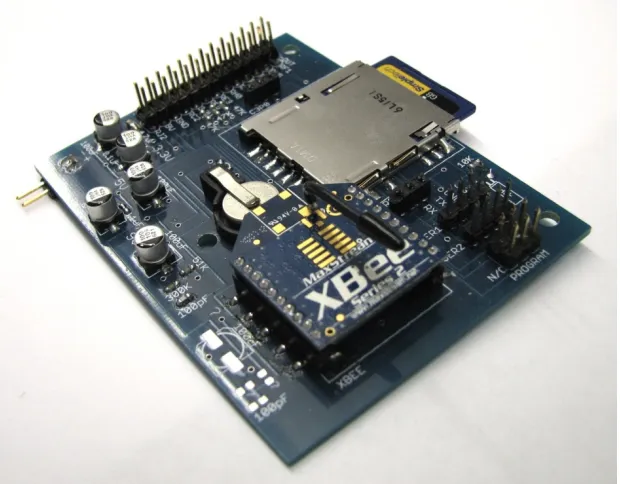
many digital and analog I/O pins. Figure 6 shows the main system board design.
Figure 6: Sensor Module System Board
4.4 Processor
The processor used in this system is a Microchip PIC18F8722 8-bit
applications.
This microcontroller not only provides a wide range of protocols and I/O options, but reasonable computation power as well. On this system, the microcontroller was set up to run at 8 MHz, but the microcontroller has an internal phase-locked-loop (PLL), which allows it to use the 8 MHz external crystal and internally run at four times the external crystal frequency. The microcontroller is rated to run up to 40 MHz by use of a 10 MHz external crystal and the internal PLL [5].
4.5 Power
There are many common voltages for sensors. Some of the most common are 5 V and 3.3 V; however others may be necessary. The system board (motherboard) of the module provides four power supplies running at 3.3 V, 5 V, 9 V and a custom supply that may be configured at build time. The system uses two types of DC-DC converters: a Maxim MAX642 and MAX710. The MAX642 is rated to output up to 18 V at 450 mA, whereas the MAX710 is rated to output up to 11.5 V at 700 mA. The system board has space for two MAX710s and two MAX642s. Both of these supplies have efficiencies of over 80% [13], [14]. In the current hardware configuration, the two MAX710 supplies are set up to output 3.3 V and 5 V. One of the MAX642 chips is configured to output 9 V, whereas the fourth supply is not currently used.
4.6 Sensor Integration
carbon dioxide (CO2), carbon monoxide (CO), temperature, relative humidity, barometric pressure, GPS, and sound intensity. The hardware has also been adapted to other form factors, which allow additional sensors to be connected externally to the enclosure. The current sensor set was chosen as a means to test the overall framework, as the suite provided several standard sensors for general applications.
4.7 Communications
While the microcontroller supports many communication protocols, the primary protocol used for external communication is UART. This provides a standard protocol that interfaces with computers as well as other devices. The microcontroller used in the system offers two UARTs. One UART is used for controlling software system
configuration via a computer while the second is used for wireless communication through use of a ZigBee® modem. The second UART has also been used with a Bluetooth communication module to add link capabilities with PDAs to display sensor measurements.
4.8 Data Storage and Transmission
Local data storage is accomplished with an SD card reader built into the main system board. This media was chosen based on its availability, compatibility, and form factor. The small size of SD cards results in minimal space requirements on the system board. Additionally, media card readers and laptop computers commonly support SD media. The current system firmware supports SD cards up to 2GB, which would allow for approximately four years of data collection without removing the card (assuming measurements are taken every 30 seconds).
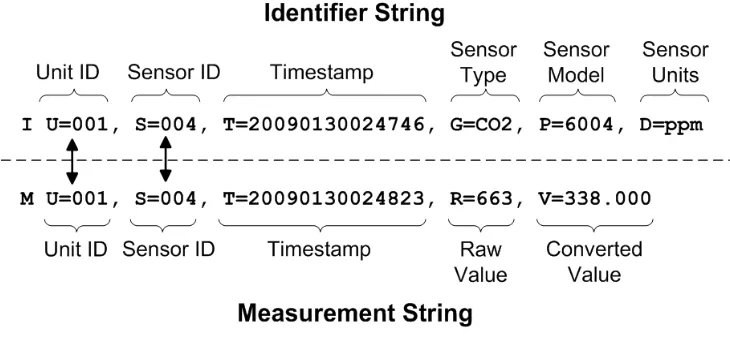
The data from sensor measurements is stored on the SD card in a human readable text format. This not only allows users to easily view the data collected, but it results in simple programming to load data files into databases or generate plots. The same format is also used in wireless transmission of the sensor measurements. Each sensor
measurement string is a collection of key-value pairs containing information such as the identification number of the sensor module on which the measurement was collected, the sensor identification number within the sensor module, the raw sensor reading, converted sensor reading, and a time stamp of when the measurement was taken. Additional strings stored in the data files identify the type of sensors, each sensor's measurement units, model number, and description. These strings provide a way to limit how much data is stored for each measurement. By separating out the sensor information from the
Figure 7: Example Identifier and Measurement Strings
As seen in Figure 7, the identifier string contains information about the sensor on a particular sensor module, whereas the measurement string contains information about a measurement from a sensor on a sensor module. The use of two packet types helps reduce the amount of data sent with each sensor measurement. The identifier strings are sent only at startup or when requested. This allows the measurement strings to remain small, and only contain the data unique to the measurement. The common sensor node global unique identification (GUID) number and sensor identification (SID) numbers are identical between a measurement strings and the identifier string for a respective sensor. This allows the two (identifier and measurement) to be related, and it avoids the need to send the sensor information (type, units of measurement, etc) with every measurement.
The data transmitted has the same format as the data stored to the flash memory on the system. The plain text format requires more data to be transmitted than if
formatted into binary packets, but it offers significant advantages in terms of versatility. The string structure of key/value pairs allows for only minor modification to the
4.9 Time Management
Time keeping is an important part of any data logging device. It is particularly important for a system that must correlate measurements among distinct, independent modules, such as a multi-sensor data fusion system. While it is not strictly necessary to have perfect synchronization among the sensor modules, it is necessary to have the system self-consistent in that all sensor modules agree on the ordering of the events recorded by the system. The sensor system described in this paper pushes most time management control to software. We will discuss time synchronization in more detail in Chapter 6.
As for the time-keeping hardware, the system utilizes a Maxim DS1339 real-time clock. This chip utilizes an external 32.768 KHz crystal oscillator and is controlled through an I2C interface. It offers very low current operation (~450 µA) and accuracy which depends on the crystal used [16]. The typical crystal oscillators used have an accuracy of +/- 40 ppm which means that the crystal has a potential error that could result in up to +/- 10 minutes per year depending on the temperature variations.
While the DS1339 maintains real time, an internal hardware timer is used to manage system events. The internal timer utilizes an additional external 32.768 KHz crystal to maintain system time. This clock is synchronized with the DS1339 at startup and every 24 hours to insure accuracy.
4.10 Systems Integration
There were many areas where the current sensor modules were improved over the original design. Most of the changes were related to minimizing the amount of
sensor modules, but other changes were made to make the sensor system more robust and modular. Figure 8 shows a comparison between the original sensor module (left) and an early prototype (right) of the latest sensor module. Both of the sensor modules shown in Figure 8 have the same sensor suite and functionality.
Figure 8: Original Sensor Module Design, (a), vs. New Design (b)
From Figure 8 we see that the system cabling was substantially improved by using insulation displacement connector (IDC) cables and integrated circuit boards (b). The original prototype, (a), has significantly more point-to-point wiring, and individual circuit boards for each power supply. The various power supplies were consolidated to reside on the main system board rather than relying on three discrete power supply boards. Additionally, as discussed previously, the sensors are now consolidated to a modular circuit board that provides all of the available voltages and communications lines from the main system board. Figure 9 shows one of the latest versions of the updated sensor module.
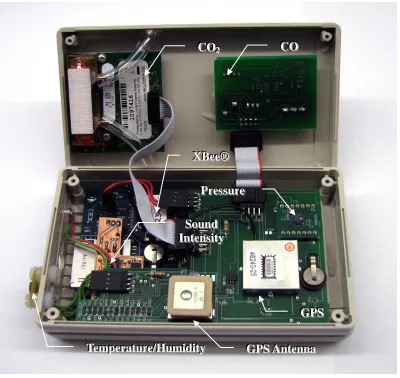
Figure 9: Latest Sensor Module Hardware Design
As seen in Figure 9, the latest version of the sensor module takes advantage of the extra space garnered by the more modular design. The newer breakout board was
designed to allow the addition of a more accurate barometric pressure sensor (which contains an integrated temperature sensor) as well as a GPS unit. The sound intensity sensor was also improved, redesigned to include a wider range of operation and a better form factor for integration with the system board.
C CCOOO C
CCOOO222
P
PPrrreeessssssuuurrreee
S SSooouuunnnddd I
IInnnttteeennnsssiiitttyyy X XXBBBeeeeee®®®
G GGPPPSSS
G
GGPPPSSSAAAnnnttteeennnnnnaaa T
CHAPTER 5: SOFTWARE DEVELOPMENT
5.1 Sensor Module Firmware
As the sensor modules must be battery-powered and have limited resources, it is important to limit the amount of computation that occurs locally. In addition, it is
important that the software be designed such that it is easily reconfigurable to allow for a wide range of sensors to be connected to the system. This was generally accomplished by a layered and modular design. At the lowest level, the code for each sensor must provide a consistent application programming interface (API) that “hides” the low level hardware communication from the higher levels of the software. It is this area that will need to be created to add new sensors to the system, while only the sensor configuration table will need to be modified to include the new sensors at the top level.
5.1.1 Implementation Details
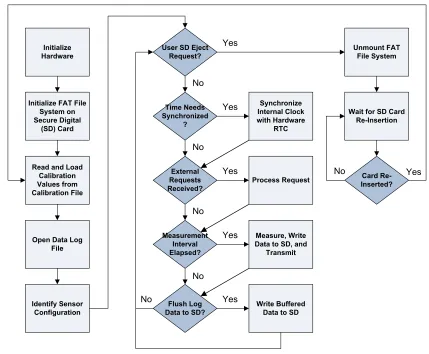
Figure 10: Firmware Flow of Control (Simplified)
As seen in Figure 10, the main execution loop of the firmware has four tasks. It must 1) keep the internal clock synchronized with the external real-time clock, 2) process unsolicited requests received over the network, 3) take measurement data storing to SD and transmitting to the data sink, and 4) insure that the SD contains the latest data in case of power loss.
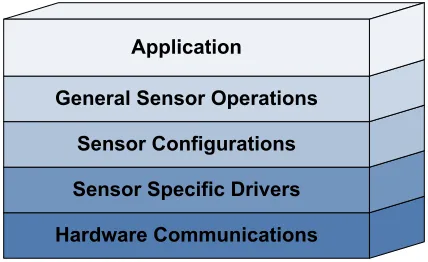
architecture is layered as shown in Figure 11.
Figure 11: Firmware Layered Architecture
The hardware communications layer provides the lowest level interaction with the sensor devices. This layer provides communications protocol code that may be used by many different sensors. The protocols used by the various sensors could be I2C, SPI, UART, or some other proprietary protocol. Re-configurability is maintained in that the hardware communications layer is unchanged when adding a new sensor. This assumes that the protocol is already supported. If the hardware protocol used by a sensor is not already implemented in the hardware communications layer, a software module must be written to manage this type of protocol. The benefit of this architecture is that after a module is added to the hardware communications layer, it is available for use by any other sensor that utilizes the same protocol.
identify, measure, and convert. This set of functions provides a means to request an identification string, take a measurement, and convert a raw sensor measurement to its corresponding unit value. The identification string describes a sensor’s type, measuring units, and model number that is included in the identify packet that is sent on
initialization.
With a unified interface to sensors available, the sensor configurations layer can easily table the function calls and manage many sensors with only a small amount of controlling code. Figure 12 shows the sensor table used to configure the sensors that are active in the system.
Figure 12: Sensor Table Structure
As seen in Figure 12, each sensor in the system requires identify, measure, and
structures is maintained to provide a simple means to both manage the sensor that are connected to the system and directly access the sensor driver interfaces. This table must be modified manually when adding or removing a sensor from the system. The size of the table is calculated dynamically so any sensor can be deactivated in the system by simply commenting the sensor entry in the sensor table code and recompiling.
Figure 13: Sensor Identify Function
Figure 14: Sensor Measure Function
The sensor measurement ASCII strings are formed by the code shown in Figure 14. As with the Sensor_Identify function, the Sensor_Measure function leverages the sensor structure table to gather the raw sensor measurement and convert the raw measurement to its corresponding unit value. Lines 31 and 36 show the calls to the sensor driver associated with the specified sensor index in the sensor structure table.
systems top level function calls, which identify all of the sensors and take measurements for all of the sensors.
Figure 15: Top Level Identify and Measure Functions
As seen in Figure 15, identifying or taking measurements from all of the active sensors on the system is as simple as looping through the sensor table. The
5.2 Computer Software
As it was a goal to minimize the computation at each sensor node, computer software was required to both store and process the collected data. The processing
responsibilities range from graphically representing the data to make it simple to view the real-time state of the monitored variables, to applying algorithms to the received data.
The primary computer-based application developed as part of this thesis was the BSU Sensor Monitor (BSUSM) application. This program was designed using the C# programming language as a general test-bed to provide an example of the types of interactions possible with the sensor system. This software offers a wide range of capabilities, including data plotting, data sinking, sensor module device control, and sensor data fusion.
5.2.1 Plotting
Figure 16: BSU Sensor Monitor Data Plot
5.2.2 Data Sink
In addition to plotting data, the BSUSM was designed to store collected data in a structured query language (SQL) database and subsequently export in a comma separated values (CSV) format compatible with common spreadsheet software. Two versions of the software have been developed: one that relies on a SQL server service to be available and another that uses an internal database to manage the data that is presented in plots and data exportation. Utilizing a computer to provide a data sink for a network of sensor modules allows the data to be stored in a central location for real-time or post processing.
5.2.3 Sensor Module Control
sensor modules, but also to directly request data from any sensor unit within the network. This offers many possibilities for the sensor network configuration as the computer may be used to request specific sensor measurements before the sensor module would
otherwise have provided it, or to remotely control the sensor module for some other purpose such as time synchronization. Figure 17 shows the basic communication interface implemented.
Figure 17: Two-Way Communication and Time Synchronization
As seen in Figure 17, the command interface allows users to specify a command to send to a particular sensor module. The commands currently implemented include get-value, get-raw-value, get-time, set-time, self-identify, and synchronize-time. The get-value and get-raw-value commands allow the user to request the value of any sensor on the module, whereas get-value retrieves the converted user-readable sensor reading and
get-raw-value retrieves the raw sensor reading. The get-time and set-time commands, respectively, allow users to retrieve and set the time, while the synchronize-time
program by multicasting a set-time command to all sensor modules connected.
5.2.4 Real-Time Data Fusion
Real-time sensor data fusion tools implemented in the BSUSM software allows various data fusion algorithms to be applied as data is received from each of the sensor modules connected. The software was designed in a layered architecture to make the addition of new fusion algorithms straightforward. Currently the software implements two fusion/data processing algorithms: averaging and peak detection. Figure 18 shows the graph options associated with the sensor data fusion features of the BSUSM.
Figure 18: Real-Time Sensor Data Fusion Dialog