NSW PUBLIC HEALTH
BULLETIN
Year in review: communicable disease
surveillance, New South Wales, 2006
Communicable Diseases Branch, NSW Department of Health
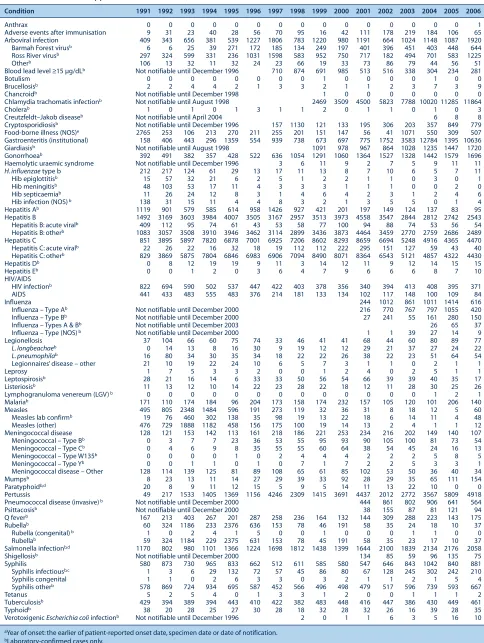
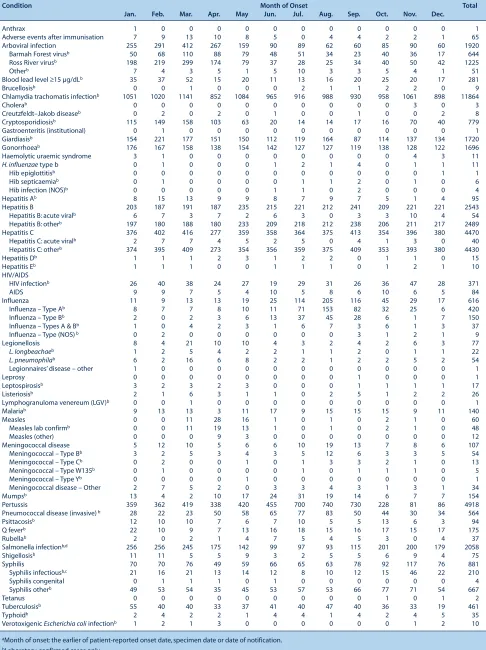
In this issue, we review the trends in reports of notifiable diseases among NSW residents received by the NSW Public Health Units (PHU) for 2006. Readers interested in the details of notifications for specific diseases are referred to Tables 1–5, where diseases are reported by: year of onset, month of onset, Area Health Service (AHS), age group and sex. Table 6 shows the number of people with selected noti-fiable conditions who were reported to have died at the time of follow-up by their local PHU.
Trends
Among the 47 608 NSW residents with medical conditions notified by doctors, hospital staff, and laboratory staff for 2006, highlights included:
Conditions most frequently reported
• Chlamydia: 11 864 cases (173 per 100 000 people), with the highest crude rates by geographical area in the South Eastern Sydney/Illawarra (Randwick region), Hunter/New England (Newcastle region) and Sydney South West (Camperdown region) AHSs
• Pertussis: 4918 cases (73 per 100 000 people), with the highest crude rates in the Greater Western (Broken Hill and Dubbo regions) and Greater Southern (Albury region) Health Areas. Note, a proportion of pertussis notifications may have been false-positive tests caused by the performance of a commonly used serology test kit (see http://www.health.nsw.gov.au/infect/pdf/ false_pertussis_tests.pdf)
• Hepatitis C: 4470 cases (65 per 100 000 people), with the highest crude rates in the Sydney South West (Camperdown region), North Coast (Lismore region) and Greater Western (Bathurst region) AHSs
• Hepatitis B: 2543 cases (37 per 100 000 people), with the highest crude rates in the Sydney South West and Sydney West (Parramatta region) AHSs
• Salmonella infections: 2058 cases (26 per 100 000 population), with the highest crude rates in the North Coast (Lismore region), Greater West (Dubbo region) and Hunter New England (Tamworth region) AHSs.
Conditions with the most meaningful declines in the number of notifications compared with previous years • Hepatitis B: 2543 cases, steadily declining from 4458
cases in 2001, with the most pronounced fall (43% since 2002) in the 35 to 44 year age group, possibly as a result of the ongoing impact of immunisation • Pneumococcal disease (invasive): 564 cases, a
continued decline from 906 in 2004 and most pronounced in the 0-to-2-year age group, possibly a result of the inclusion of the pneumococcal vaccination on the universal childhood vaccination schedule in early 2005
• Meningococcal disease: 107 cases, a continued decline from 253 in 2000, the lowest number of notifications since laboratory reporting began in 1991 and in part due to the introduction of meningococcal C vaccination in late 2003
• Leptospirosis: 17 cases, down from 66 in 2001, the cause of the decline is unclear.
Conditions with the most meaningful increases in the number of notifications compared with previous years • Chlamydia: 11 864 cases, continuing its rise since it
became notifiable in the late 1990s
• Infectious syphilis: re-emerging as a significant issue in the gay community in late 2006
• Barmah Forest virus infection: 644 cases, due to outbreaks mainly in coastal areas of rural NSW in early 2006
• Ross River virus infection: 1225 cases, up from 583 in 2005, due to outbreaks across rural NSW in early 2006
w w w. p u b l i s h . c s i r o. a u / j o u r n a l s / p h b CONTENTS – See back page
Year In Review 2006
Vol. 18(7–8) • July–August 2007 State Health Publication PH 070140 ISSN 1034 7674
• Gastroenteritis in institutions: 10 636 cases associated with 436 outbreaks, mostly due to norovirus
infections
• Mumps: 154 cases, up from 111 in 2005, mainly in young adults and the highest number of laboratory notifications since laboratory reporting began in 1991 • Legionnaires’ disease, due to infection with
Legionella pneumophila: 54 cases, in part due to
outbreaks in western and northern Sydney • Measles: 48 cases, due to two outbreaks, one in
March 2006 related to contact at a hospital emergency department and the second, larger outbreak, in people associated with a national spiritual tour.
Note that the apparent increase in giardiasis (1720 cases) and verotoxigenic Escherichia coli infections (10 cases) are probably related to changes in laboratory testing prac-tices resulting in a higher proportion of samples tested for these organisms than in the past.
Conditions least frequently reported
There were no reported cases of avian influenza, botulism, chancroid, diphtheria, donovanosis, granuloma inguinale, plague, polio, rabies/lyssavirus, SARS, smallpox, tularaemia, typhus, viral haemorrhagic fevers or yellow fever in NSW in 2006.
Conditions associated with the largest numbers of reported deaths
Deaths reported via the surveillance mechanisms for noti-fiable conditions may not include all deaths associated with these conditions. PHUs routinely investigate all cases of some notifiable conditions (eg, tuberculosis, measles, meningococcal disease) in order to implement control measures; the investigations are likely to identify associ-ated deaths. However, there are other notifiable conditions (eg, chlamydia and gonorrhoea) where PHUs do not conduct routine investigations and for which deaths will not be identified as part of the notification or public health management process. Conversely, some deaths in patients following notification may be due to conditions other than that notified. Deaths were most frequently reported for the following notifiable diseases:
• Invasive pneumococcal disease: 61 deaths
• HIV infection: 36 deaths, including 13 people who died from AIDS, and 23 people with HIV infection who died of causes other than AIDS
• Tuberculosis: 21 deaths.
Outbreaks and threats
Several notable disease outbreaks and threats were reported in 2006 in NSW. These included:
• Outbreaks of Legionnaires’ disease in western Sydney in January 20061and northern Sydney in March 20062
thought to be related to contaminated cooling towers. • Two outbreaks of measles2
• An outbreak of keratoconjunctivitis in patients of an eye clinic in regional NSW in March 20062
• Four cases of lymphogranuloma venereum identified in early 2006, the first cases in NSW3
• A cluster of cases of Salmonella Saint-Paul infection in October 2006 linked to contaminated rockmelons4
• Three cases of cholera in November 2006 linked to consumption of raw imported whitebait.5
Conclusions
Sexually transmitted infections, gastroenteritis (particu-larly norovirus) and arboviruses continue to be significant public health problems in NSW. Much progress has been made with other diseases, such as hepatitis B, invasive pneumococcal disease and meningococcal disease, in which declines were identified. Outbreaks of diseases, that have largely been brought under control, for example measles and mumps (where many young adults remain unvaccinated), continue to pose a threat.
We thank all those general and specialist medical practices, laboratories, hospitals, schools, child-care centres, and others, who have notified diseases of public health signifi-cance to their local PHUs for investigation and control.
References
1. NSW Department of Health Communicable Diseases Report, NSW, for January and February 2006. N S W Public Health Bull 2006; 17(3–4): 58–9.
2. NSW Department of Health Communicable Diseases Report, NSW, for March and April 2006. N S W Public Health Bull 2006; 17(5–6): 88–91.
3. NSW Department of Health Communicable Diseases Report, NSW, for July and August 2006. N S W Public Health Bull 2006; 17(9–10): 154–5.
4. NSW Department of Health Communicable Diseases Report, NSW, for September and October 2006. N S W Public Health Bull 2006; 17(11–12): 182–3.
Vol. 18(7–8) NSW Public Health Bulletin | 107
Year in review
Table 1. Disease notifications by year of onset of illnessa, NSW, 1991–2006
Condition 1991 1992 1993 1994 1995 1996 1997 1998 1999 2000 2001 2002 2003 2004 2005 2006
Anthrax 0 0 0 0 0 0 0 0 0 0 0 0 0 0 0 1
Adverse events after immunisation 9 31 23 40 28 56 70 95 16 42 111 178 219 184 106 65
Arboviral infection 409 343 656 381 539 1227 1806 783 1220 980 1191 664 1024 1148 1087 1920
Barmah Forest virusb 6 6 25 39 271 172 185 134 249 197 401 396 451 403 448 644
Ross River virusb 297 324 599 331 236 1031 1598 583 952 750 717 182 494 701 583 1225
Otherb 106 13 32 11 32 24 23 66 19 33 73 86 79 44 56 51
Blood lead level ≥15 µg/dLb Not notifiable until December 1996 710 874 691 985 513 516 338 304 234 281
Botulism 0 0 0 0 0 0 0 0 1 0 0 0 0 1 0 0
Brucellosisb 2 2 4 4 2 1 3 3 2 1 1 2 3 7 3 9
Chancroidb Not notifiable until December 1998 1 0 0 0 0 0 0 0
Chlamydia trachomatis infectionb Not notifiable until August 1998 2469 3509 4500 5823 7788 10020 11285 11864
Cholerab 1 0 1 0 1 3 1 1 2 0 1 1 0 1 0 3
Creutzfeldt–Jakob diseaseb Not notifiable until April 2004 6 8 8
Cryptosporidiosisb Not notifiable until December 1996 157 1130 121 133 195 306 203 357 849 779 Food-borne illness (NOS)e 2765 253 106 213 270 211 255 201 151 147 56 41 1071 550 309 507 Gastroenteritis (institutional) 158 406 443 296 1359 554 939 738 673 697 775 1752 3583 12784 1395 10636
Giardiasisb Not notifiable until August 1998 1091 978 967 864 1028 1235 1447 1720
Gonorrhoeab 392 491 382 357 428 522 636 1054 1291 1060 1364 1527 1328 1442 1579 1696
Haemolytic uraemic syndrome Not notifiable until December 1996 3 6 11 9 2 7 5 9 11 11
H. influenzaetype b 212 217 124 61 29 13 17 11 13 8 7 10 6 5 7 11
Hib epiglottitisb 15 57 32 21 6 2 5 1 2 2 1 1 0 3 0 1
Hib meningitisb 48 103 53 17 11 4 3 3 3 1 1 1 0 0 2 0
Hib septicaemiab 11 26 24 12 8 3 1 4 6 4 2 3 1 2 4 6
Hib infection (NOS)b 138 31 15 11 4 4 8 3 2 1 3 5 5 0 1 4
Hepatitis Ab 1119 901 579 585 614 958 1426 927 421 201 197 149 124 137 83 95
Hepatitis B 1492 3169 3603 3984 4007 3505 3167 2957 3513 3973 4558 3547 2844 2812 2742 2543
Hepatitis B: acute viralb 409 112 95 74 61 43 53 58 77 100 94 88 74 53 56 54
Hepatitis B: otherb 1083 3057 3508 3910 3946 3462 3114 2899 3436 3873 4464 3459 2770 2759 2686 2489 Hepatitis C 851 3895 5897 7820 6878 7001 6925 7206 8602 8293 8659 6694 5248 4916 4365 4470
Hepatitis C: acute viralb 22 26 22 16 32 18 19 112 112 222 295 151 127 59 43 40
Hepatitis C: otherb 829 3869 5875 7804 6846 6983 6906 7094 8490 8071 8364 6543 5121 4857 4322 4430
Hepatitis Db 0 8 12 19 19 9 11 3 14 12 11 9 12 14 15 15
Hepatitis Eb 0 0 1 2 0 3 6 4 7 9 6 6 6 8 7 10
HIV/AIDS
HIV infectionb 822 694 590 502 537 447 422 403 378 356 340 394 413 408 395 371
AIDS 441 433 483 555 483 376 214 181 133 134 102 117 148 100 109 84
Influenza 244 1012 861 1011 1414 616
Influenza – Type Ab Not notifiable until December 2000 216 770 767 797 1055 420
Influenza – Type Bb Not notifiable until December 2000 27 241 55 161 280 150
Influenza – Types A & Bb Not notifiable until December 2003 26 65 37
Influenza – Type (NOS)b Not notifiable until December 2000 1 1 39 27 14 9
Legionellosis 37 104 66 60 75 74 33 46 41 41 68 44 60 80 89 77
L. longbeachaeb 0 14 13 8 16 30 9 19 12 12 29 21 37 27 24 22
L. pneumophilab 16 80 34 30 35 34 18 22 22 26 38 22 23 51 64 54
Legionnaires’ disease – other 21 10 19 22 24 10 6 5 7 3 1 1 0 2 1 1
Leprosy 1 7 5 3 3 2 0 0 1 2 4 0 2 5 1 1
Leptospirosisb 28 21 16 14 6 33 33 50 56 54 66 39 39 40 35 17
Listeriosisb 11 13 12 10 14 22 23 28 22 18 12 11 28 30 25 26
Lymphogranuloma venereum (LGV)b 0 0 0 0 0 0 0 0 0 0 0 0 0 1 2 1
Malariab 171 110 174 184 96 204 173 158 174 232 157 105 120 101 206 140
Measles 495 805 2348 1484 596 191 273 119 32 36 31 8 18 12 5 60
Measles lab confirmb 19 76 460 302 138 35 98 19 13 22 18 6 14 11 4 48
Measles (other) 476 729 1888 1182 458 156 175 100 19 14 13 2 4 1 1 12
Meningococcal disease 128 121 153 142 113 161 218 186 221 253 234 216 202 149 140 107
Meningococcal – Type Bb 0 3 7 7 23 36 53 55 95 93 90 105 100 81 73 54
Meningococcal – Type Cb 0 4 6 9 8 35 55 55 60 64 38 54 45 24 16 13
Meningococcal – Type W135b 0 0 0 0 1 0 2 4 4 4 2 2 2 5 8 5
Meningococcal – Type Yb 0 0 1 1 0 1 0 7 1 7 2 2 5 3 3 1
Meningococcal disease – Other 128 114 139 125 81 89 108 65 61 85 102 53 50 36 40 34
Mumpsb 8 23 13 11 14 27 29 39 33 92 28 29 35 65 111 154
Paratyphoidb,d 20 8 9 11 12 15 5 9 5 14 11 13 22 10 0 0
Pertussis 49 217 1533 1405 1369 1156 4246 2309 1415 3691 4437 2012 2772 3567 5809 4918
Pneumococcal disease (invasive)b Not notifiable until December 2000 444 861 802 906 641 564
Psittacosisb Not notifiable until December 2000 38 155 87 81 121 94
Q feverb 167 213 403 267 201 287 258 236 164 132 144 309 288 223 143 175
Rubellab 60 324 1186 233 2376 636 153 78 46 191 58 35 24 18 10 37
Rubella (congenital)b 1 0 2 4 1 5 0 0 1 0 0 0 1 1 0 0
Rubellab 59 324 1184 229 2375 631 153 78 45 191 58 35 23 17 10 37
Salmonella infectionb,d 1170 802 980 1101 1366 1224 1698 1812 1438 1399 1644 2100 1839 2134 2176 2058
Shigellosisb Not notifiable until December 2000 134 85 59 96 135 75
Syphilis 580 873 730 965 833 662 512 611 585 580 547 646 843 1042 840 881
Syphilis infectiousb,c 1 3 6 29 132 72 57 45 86 80 67 128 245 302 242 210
Syphilis congenital 1 1 0 2 6 3 3 0 3 2 1 1 2 1 5 4
Syphilis otherb 578 869 724 934 695 587 452 566 496 498 479 517 596 739 593 667
Tetanus 5 2 5 4 0 1 3 3 1 2 0 0 1 1 1 2
Tuberculosisb 429 394 389 394 443 410 422 382 483 448 416 447 386 430 449 461
Typhoidb 38 20 28 25 27 30 28 18 32 28 32 26 16 39 28 35
Verotoxigenic Escherichia coliinfectionb Not notifiable until December 1996 2 0 1 1 6 3 5 16 10
aYear of onset: the earlier of patient-reported onset date, specimen date or date of notification. bLaboratory-confirmed cases only.
cIncludes Syphilis primary, Syphilis secondary, Syphilis <1 year duration and Syphilis newly acquired. dFrom 2005, all paratyphoid recorded as salmonellosis.
eFoodborne illness cases are only those notified as part of an outbreak. NOS: not otherwise specified.
Table 2. Disease notifications by month of onset of illnessa, NSW, 2006
Condition Month of Onset Total
Jan. Feb. Mar. Apr. May Jun. Jul. Aug. Sep. Oct. Nov. Dec.
Anthrax 1 0 0 0 0 0 0 0 0 0 0 0 1
Adverse events after immunisation 7 9 13 10 8 5 0 4 4 2 2 1 65
Arboviral infection 255 291 412 267 159 90 89 62 60 85 90 60 1920
Barmah Forest virusb 50 68 110 88 79 48 51 34 23 40 36 17 644
Ross River virusb 198 219 299 174 79 37 28 25 34 40 50 42 1225
Otherb 7 4 3 5 1 5 10 3 3 5 4 1 51
Blood lead level ≥15 µg/dLb 35 37 52 15 20 11 13 16 20 25 20 17 281
Brucellosisb 0 0 1 0 0 0 2 1 1 2 2 0 9
Chlamydia trachomatis infectionb 1051 1020 1141 852 1084 965 916 988 930 958 1061 898 11864
Cholerab 0 0 0 0 0 0 0 0 0 0 3 0 3
Creutzfeldt–Jakob diseaseb 0 2 0 2 0 1 0 0 1 0 0 2 8
Cryptosporidiosisb 115 149 158 103 63 20 14 14 17 16 70 40 779
Gastroenteritis (institutional) 0 1 0 0 0 0 0 0 0 0 0 0 1
Giardiasisb 154 221 177 151 150 112 119 164 87 114 137 134 1720
Gonorrhoeab 176 167 158 138 154 142 127 127 119 138 128 122 1696
Haemolytic uraemic syndrome 3 1 0 0 0 0 0 0 0 0 4 3 11
H. influenzaetype b 0 1 0 0 0 1 2 1 4 0 1 1 11
Hib epiglottitisb 0 0 0 0 0 0 0 0 0 0 0 1 1
Hib septicaemiab 0 1 0 0 0 0 1 1 2 0 1 0 6
Hib infection (NOS)b 0 0 0 0 0 1 1 0 2 0 0 0 4
Hepatitis Ab 8 15 13 9 9 8 7 9 7 5 1 4 95
Hepatitis B 203 187 191 187 235 215 221 212 241 209 221 221 2543
Hepatitis B: acute viralb 6 7 3 7 2 6 3 0 3 3 10 4 54
Hepatitis B: otherb 197 180 188 180 233 209 218 212 238 206 211 217 2489
Hepatitis C 376 402 416 277 359 358 364 375 413 354 396 380 4470
Hepatitis C: acute viralb 2 7 7 4 5 2 5 0 4 1 3 0 40
Hepatitis C: otherb 374 395 409 273 354 356 359 375 409 353 393 380 4430
Hepatitis Db 1 1 1 2 3 1 2 2 0 1 1 0 15
Hepatitis Eb 1 1 1 0 0 1 1 1 0 1 2 1 10
HIV/AIDS
HIV infectionb 26 40 38 24 27 19 29 31 26 36 47 28 371
AIDS 9 9 7 5 4 10 5 8 6 10 6 5 84
Influenza 11 9 13 13 19 25 114 205 116 45 29 17 616
Influenza – Type Ab 8 7 7 8 10 11 71 153 82 32 25 6 420
Influenza – Type Bb 2 0 2 3 6 13 37 45 28 6 1 7 150
Influenza – Types A & Bb 1 0 4 2 3 1 6 7 3 6 1 3 37
Influenza – Type (NOS)b 0 2 0 0 0 0 0 0 3 1 2 1 9
Legionellosis 8 4 21 10 10 4 3 2 4 2 6 3 77
L. longbeachaeb 1 2 5 4 2 2 1 1 2 0 1 1 22
L. pneumophilab 6 2 16 6 8 2 2 1 2 2 5 2 54
Legionnaires’ disease – other 1 0 0 0 0 0 0 0 0 0 0 0 1
Leprosy 0 0 0 0 0 0 0 0 1 0 0 0 1
Leptospirosisb 3 2 3 2 3 0 0 0 1 1 1 1 17
Listeriosisb 2 1 6 3 1 1 0 2 5 1 2 2 26
Lymphogranuloma venereum (LGV)b 0 0 1 0 0 0 0 0 0 0 0 0 1
Malariab 9 13 13 3 11 17 9 15 15 15 9 11 140
Measles 0 0 11 28 16 1 0 1 0 2 1 0 60
Measles lab confirmb 0 0 11 19 13 1 0 1 0 2 1 0 48
Measles (other) 0 0 0 9 3 0 0 0 0 0 0 0 12
Meningococcal disease 5 12 10 5 6 6 10 19 13 7 8 6 107
Meningococcal – Type Bb 3 2 5 3 4 3 5 12 6 3 3 5 54
Meningococcal – Type Cb 0 2 0 0 1 0 1 3 3 2 1 0 13
Meningococcal – Type W135b 0 1 0 0 0 0 1 0 1 1 1 0 5
Meningococcal – Type Yb 0 0 0 0 1 0 0 0 0 0 0 0 1
Meningococcal disease – Other 2 7 5 2 0 3 3 4 3 1 3 1 34
Mumpsb 13 4 2 10 17 24 31 19 14 6 7 7 154
Pertussis 359 362 419 338 420 455 700 740 730 228 81 86 4918
Pneumococcal disease (invasive)b 28 22 23 50 58 65 77 83 50 44 30 34 564
Psittacosisb 12 10 10 7 6 7 10 5 5 13 6 3 94
Q feverb 22 10 9 7 13 16 18 15 16 17 15 17 175
Rubellab 2 0 2 1 4 7 5 4 5 3 0 4 37
Salmonella infectionb,d 256 256 245 175 142 99 97 93 115 201 200 179 2058
Shigellosisb 11 11 5 5 9 3 2 5 5 6 9 4 75
Syphilis 70 70 76 49 59 66 65 63 78 92 117 76 881
Syphilis infectiousb,c 21 16 21 13 14 12 8 10 12 15 46 22 210
Syphilis congenital 0 1 1 1 0 1 0 0 0 0 0 0 4
Syphilis otherb 49 53 54 35 45 53 57 53 66 77 71 54 667
Tetanus 0 0 0 0 0 0 0 0 0 1 0 1 2
Tuberculosisb 55 40 40 33 37 41 40 47 40 36 33 19 461
Typhoidb 2 4 2 2 1 4 4 1 4 2 4 5 35
Verotoxigenic Escherichia coliinfectionb 1 2 1 3 0 0 0 0 0 0 1 2 10
aMonth of onset: the earlier of patient-reported onset date, specimen date or date of notification.
bLaboratory-confirmed cases only.
cIncludes Syphilis primary, Syphilis secondary, Syphilis <1 year duration and Syphilis newly acquired.
dFrom 2005, all paratyphoid recorded as salmonellosis.
Vol. 18(7–8) NSW Public Health Bulletin | 109
Year in review
Ta ble 3. Disease notifica tions b y Ar
ea Health S
e
rv
ic
e of r
e
sidenc
e (2005 AHS boundaries),
crude r
a
te
s per 100
000 popula tion, NSW ,2 006 a Co n d it ion G re a ter Southern e Gr ea ter W e stern e Hunt er/New Nor th C o ast e Nor thern S y d/ South Eastern S y d ne y South W e st e Syd n ey W e st e Justic e England e Ce n tr a l Co a st e Syd /I lla w a rr a e Health f Albur y G o ulburn Br oken Hill Dubbo B a thurst N ew castle Ta mw or th P t Macquarie Lismor e G osf o rd Hornsb y W ollongong R andwick C amper d o w n L iv erpool P e nrith P a rr ama tta Anthrax 0 .4 0.0 0 .0 0.0 0 .0 0.0 0 .0 0.0 0 .0 0.0 0 .0 0.0 0 .0 0.0 0 .0 0.0 0 .0 0.0 Ad verse ev ents af ter immunisation 3.0 4 .9 0.0 0 .0 1.7 0 .9 1.1 0 .7 0.7 1 .3 0.5 0 .3 0.9 0 .0 0.1 3 .4 0.7 0 .0 Arbo vir a l inf e ct ion 68.5 21.5 68.5 84.6 26.5 61.5 56.2 111.0 143.7 32.2 5 .4 17.5 6 .4 3.7 2 .6 10.2 2 .1 0.0 Barmah F o re st virus b 12.8 5 .4 15.0 10.5 0 .6 30.9 8 .9 53.0 47.7 14.5 1 .0 4.8 1 .6 2.0 0 .1 1.2 0 .3 0.0 Ross R iv er virus b 55.3 15.2 53.5 74.2 25.9 30.2 47.3 57.3 93.5 17.4 3 .1 12.5 3 .2 1.6 1 .9 8.3 1 .4 0.0 Ot h e r b 0.4 1 .0 0.0 0 .0 0.0 0 .4 0.0 0 .7 2.5 0 .3 1.4 0 .3 1.6 0 .2 0.6 0 .6 0.4 0 .0
Blood lead lev
e l ≥ 15 µg/dL b 2.6 2 .4 8.6 57.1 6 .3 6.6 1 .7 0.4 1 .4 1.3 1 .5 2.9 4 .7 3.7 5 .1 3.7 0 .7 0.0 Bruc ellosis b 0.0 0 .0 0.0 0 .0 1.2 0 .0 0.6 0 .0 0.0 0 .3 0.1 0 .0 0.3 0 .2 0.1 0 .0 0.0 0 .0 Chlam ydia tr achomatis inf e ct ion b 174.2 134.5 167.1 191.1 184.4 257.8 206.5 122.6 200.9 158.7 134.4 154.3 266.6 243.5 86.8 104.3 118.3 937.5 Cholera b 0.0 0 .0 0.0 0 .0 0.0 0 .0 0.0 0 .0 0.0 0 .0 0.0 0 .0 0.0 0 .6 0.0 0 .0 0.0 0 .0 Cr eutzf e ldt–Jakob disease b 0.0 0 .5 0.0 0 .0 0.0 0 .2 0.6 0 .0 0.0 0 .3 0.0 0 .0 0.0 0 .0 0.2 0 .6 0.0 0 .0 Cr ypt o sporidiosis b 15.1 13.7 12.9 22.8 14.4 13.1 18.9 8 .1 21.3 4 .7 17.6 8 .8 10.7 11.2 6 .3 9.8 5 .7 0.0 G astroent e ritis (institutional) 0.0 0 .0 0.0 0 .0 0.0 0 .0 0.0 0 .0 0.0 0 .0 0.0 0 .0 0.0 0 .2 0.0 0 .0 0.0 0 .0 Giar diasis b 20.3 18.6 2 .1 31.4 8 .1 27.4 28.4 10.5 5 .0 23.7 44.1 19.4 34.2 26.3 13.9 27.1 26.3 0 .0 Go n o rr hoea b 1.9 2 .0 4.3 8 .6 5.2 10.8 5 .0 5.6 13.2 8 .9 16.8 9 .6 72.5 78.2 14.8 9 .8 21.1 75.0
Haemolytic uraemic syndrome
0.0 0 .0 0.0 1 .0 0.6 0 .2 0.0 0 .0 0.4 0 .0 0.1 0 .3 0.1 0 .2 0.2 0 .0 0.1 0 .0 H. influenzae ty p e b 0 .4 0.0 0 .0 0.0 0 .0 0.2 0 .0 0.0 0 .0 0.3 0 .1 0.3 0 .0 0.2 0 .1 0.9 0 .1 0.0 Hib epiglottitis b 0.0 0 .0 0.0 0 .0 0.0 0 .0 0.0 0 .0 0.0 0 .0 0.0 0 .0 0.0 0 .0 0.1 0 .0 0.0 0 .0 Hib septicaemia b 0.4 0 .0 0.0 0 .0 0.0 0 .2 0.0 0 .0 0.0 0 .3 0.1 0 .0 0.0 0 .0 0.0 0 .6 0.0 0 .0 Hib inf e ct ion (NOS) b 0.0 0 .0 0.0 0 .0 0.0 0 .0 0.0 0 .0 0.0 0 .0 0.0 0 .3 0.0 0 .2 0.0 0 .3 0.1 0 .0 Hepatitis A b 0.4 1 .0 4.3 1 .0 1.2 0 .4 0.0 0 .0 1.1 1 .6 1.2 0 .8 1.7 2 .0 1.6 0 .6 3.1 0 .0 Hepatitis B 10.5 12.2 25.7 7 .6 5.2 10.5 11.7 9 .8 9.6 12.7 34.2 14.3 39.6 91.7 61.0 16.3 69.6 487.5 Hepatitis B: acut e vir a l b 0.8 0 .5 4.3 0 .0 1.2 1 .2 0.6 0 .4 1.1 0 .3 0.4 1 .1 0.7 1 .4 0.5 0 .6 0.7 37.5 Hepatitis B: other b 9.8 11.7 21.4 7 .6 4.0 9 .3 11.1 9 .5 8.5 12.3 33.8 13.3 38.9 90.4 60.5 15.7 69.0 450.0 Hepatitis C 43.3 52.3 53.5 69.4 70.9 60.5 50.7 50.9 79.3 58.5 26.6 54.2 60.5 88.2 69.2 49.5 49.1 6363.0 Hepatitis C: acut e vir a l b 0.8 2 .4 0.0 1 .9 0.0 1 .1 0.0 1 .1 0.0 0 .0 0.5 0 .0 0.3 1 .0 0.0 0 .9 0.1 87.5 Hepatitis C: other b 42.5 49.9 53.5 67.5 70.9 59.4 50.7 49.9 79.3 58.5 26.1 54.2 60.3 87.2 69.2 48.6 48.9 6275.0 Hepatitis D b 0.0 0 .0 0.0 0 .0 0.0 0 .0 0.0 0 .0 0.4 0 .0 0.1 0 .0 0.1 0 .0 0.2 0 .0 1.2 12.5 Hepatitis E b 0.0 0 .0 0.0 0 .0 0.0 0 .0 0.0 0 .4 0.4 0 .0 0.1 0 .0 0.0 0 .0 0.4 0 .0 0.5 0 .0 HIV/AIDS HIV inf e ct ion b 1.1 0 .0 0.0 0 .0 0.0 2 .5 1.7 1 .8 0.0 0 .0 4.2 1 .3 0.0 16.5 18.3 3 .4 3.8 0 .0 AIDS 0 .0 0.5 0 .0 0.0 0 .0 0.4 1 .1 1.1 1 .1 1.6 0 .6 0.0 2 .2 2.2 0 .4 0.9 1 .3 0.0 Influenza 8 .7 6.8 0 .0 2.9 7 .5 6.5 31.2 6 .3 22.1 1 .9 4.2 5 .1 14.5 4 .7 4.5 4 .0 15.9 12.5 Influenza – Ty pe A b 7.2 3 .4 0.0 1 .0 5.2 4 .2 26.7 4 .2 18.5 1 .3 3.5 3 .2 7.4 3 .3 2.9 2 .2 10.7 12.5 Influenza – Ty pe B b 1.5 2 .4 0.0 1 .9 1.7 2 .3 2.8 0 .7 3.2 0 .3 0.4 1 .6 4.5 0 .8 1.7 0 .6 5.2 0 .0 Influenza – Ty
pes A & B
b 0.0 0 .0 0.0 0 .0 0.6 0 .0 0.0 1 .4 0.0 0 .3 0.3 0 .3 2.6 0 .2 0.0 1 .2 0.0 0 .0 Influenza – Ty pe (NOS) b 0.0 1 .0 0.0 0 .0 0.0 0 .0 1.7 0 .0 0.4 0 .0 0.1 0 .0 0.0 0 .4 0.0 0 .0 0.0 0 .0 Le gionellosis 1.1 0 .0 0.0 0 .0 1.7 1 .7 0.0 0 .4 0.0 0 .6 2.0 1 .1 0.9 0 .4 0.5 1 .2 2.7 0 .0 L. longbeachae b 0.8 0 .0 0.0 0 .0 1.2 0 .9 0.0 0 .4 0.0 0 .0 0.4 0 .0 0.5 0 .2 0.1 0 .3 0.3 0 .0 L. pneumophila b 0.4 0 .0 0.0 0 .0 0.6 0 .9 0.0 0 .0 0.0 0 .6 1.6 1 .1 0.4 0 .2 0.4 0 .9 2.3 0 .0 Le g io nnaires ’d
isease – other
0 .0 0.0 0 .0 0.0 0 .0 0.0 0 .0 0.0 0 .0 0.0 0 .0 0.0 0 .0 0.0 0 .0 0.0 0 .1 0.0 Le p ro sy 0 .0 0 .0 0 .0 0.0 0 .0 0.2 0 .0 0.0 0 .0 0.0 0 .0 0.0 0 .0 0.0 0 .0 0.0 0 .0 0.0 Le p to spir o sis b 0.0 0 .0 0.0 1 .0 0.0 0 .7 3.9 0 .7 0.7 0 .0 0.0 0 .3 0.0 0 .0 0.0 0 .0 0.0 0 .0 List eriosis b 0.4 0 .0 0.0 0 .0 0.6 1 .1 0.6 0 .4 0.0 0 .0 0.6 0 .0 0.3 0 .4 0.4 0 .6 0.3 0 .0 Ly mphogranuloma v e nereum (L GV ) b 0.0 0 .5 0.0 0 .0 0.0 0 .0 0.0 0 .0 0.0 0 .0 0.0 0 .0 0.0 0 .0 0.0 0 .0 0.0 0 .0 Ma la ri a b 1.5 1 .5 0.0 0 .0 1.2 2 .5 2.8 0 .7 3.9 0 .6 2.4 1 .1 1.4 2 .6 1.4 0 .6 4.2 0 .0 Me asles 0.4 0 .0 0.0 0 .0 0.6 0 .2 0.0 0 .4 0.4 0 .6 1.1 0 .3 1.4 1 .8 0.5 2 .8 1.3 0 .0 Me
asles lab c
Ta ble 3. co n ti n u e d Co n d it ion G re ate r S o uthern e Gr ea ter W e stern e Hunt er/New Nor th C o ast e Nor thern S y d/ South Eastern S y d ne y South W e st e Syd n ey W e st e Justic e England e Ce n tr a l Co a st e Syd /I lla w a rr a e Health f Albur y G o ulburn Br oken Hill Dubbo B a thurst N ew castle Ta mw or th P t Macquarie Lismor e G osf o rd Hornsb y W ollongong R andwick C amper d o w n L iv erpool P e nrith P a rr ama tta Me n ingoc occal – Ty pe W135 b 0.0 0 .0 0.0 0 .0 0.0 0 .0 0.0 0 .0 0.0 0 .3 0.1 0 .3 0.0 0 .0 0.1 0 .0 0.1 0 .0 Me n ingoc occal – Ty pe Y b 0.0 0 .0 0.0 0 .0 0.0 0 .0 0.0 0 .0 0.0 0 .0 0.1 0 .0 0.0 0 .0 0.0 0 .0 0.0 0 .0 Me n ingoc
occal disease – O
ther 0 .4 0.0 0 .0 0.0 0 .0 0.7 0 .6 0.4 0 .4 0.3 0 .5 0.3 1 .1 0.4 0 .5 0.6 0 .3 12.5 Mumps b 0.8 0 .0 0.0 0 .0 1.2 0 .4 0.6 0 .4 1.8 0 .0 3.5 0 .8 3.8 5 .3 2.1 2 .5 3.3 0 .0 Pe rt ussis 111.3 70.4 141.4 125.5 40.9 66.8 86.3 21.8 38.4 45.2 69.3 47.0 93.4 73.9 62.5 72.3 93.4 0 .0 P neumoc o
ccal disease (in
vasiv e ) b 8.3 11.3 8 .6 9.5 15.0 13.6 4 .5 7.4 8 .2 8.9 6 .3 6.4 6 .9 7.1 7 .4 8.0 8 .5 0.0 Ps ittac osis b 2.3 1 .5 2.1 0 .0 5.2 4 .7 0.0 1 .1 2.9 0 .6 0.3 1 .6 0.4 0 .4 0.8 2 .5 0.8 12.5 Q f e ve r b 3.0 6 .9 2.1 21.9 8 .1 3.2 22.8 3 .9 10.3 0 .0 0.1 2 .1 0.4 0 .0 0.2 0 .3 0.1 0 .0 Rubella b 0.0 0 .0 0.0 0 .0 0.0 0 .2 0.0 0 .4 0.4 0 .3 0.4 0 .0 1.5 1 .6 0.7 0 .0 0.5 0 .0 Salmonella inf e ct ion b, d 24.1 27.4 12.9 39.0 24.8 29.7 38.4 25.6 67.9 18.3 29.6 25.8 30.4 30.6 26.7 34.8 26.4 12.5 Shigellosis b 0.4 0 .0 2.1 1 .9 0.6 0 .4 0.6 1 .4 3.2 0 .0 0.9 0 .3 2.8 2 .7 0.4 0 .3 0.5 0 .0 Sy philis 0.4 3 .9 45.0 19.0 5 .2 2.3 6 .7 4.2 8 .2 4.7 5 .2 5.6 23.2 39.8 16.6 7 .4 12.5 275.0 Sy philis inf e ct ious b, c 0.0 0 .0 0.0 0 .0 1.2 0 .7 0.6 0 .0 1.1 0 .0 1.4 0 .3 12.3 12.4 0 .6 0.9 1 .3 0.0 Sy philis c o ngenital 0.0 0 .0 0.0 1 .0 0.0 0 .0 0.6 0 .0 0.0 0 .0 0.1 0 .0 0.0 0 .0 0.0 0 .0 0.1 0 .0 Sy p h ilis other b 0.4 3 .9 45.0 18.1 4 .0 1.6 5 .6 4.2 7 .1 4.7 3 .7 5.3 10.9 27.4 16.0 6 .5 11.1 275.0 Te ta n u s 0 .0 0.0 0 .0 0.0 0 .0 0.0 0 .0 0.0 0 .0 0.0 0 .0 0.3 0 .1 0.0 0 .0 0.0 0 .0 0.0 Tu b e rc ulosis b 1.9 1 .0 2.1 0 .0 0.0 2 .3 1.1 1 .4 1.1 3 .8 5.9 1 .3 8.4 16.5 11.2 2 .8 13.8 0 .0 Ty p h o id b 0.0 0 .0 0.0 0 .0 0.0 0 .0 0.0 0 .0 0.4 0 .3 0.6 0 .0 0.9 0 .4 0.7 0 .3 1.4 0 .0 Ve ro to xi genic Escherichia c o li inf e ct ion b 0.0 1 .5 0.0 0 .0 0.0 0 .4 0.6 0 .0 0.0 0 .0 0.0 0 .3 0.0 0 .0 0.1 0 .0 0.3 0 .0 aYe a
r of onset:
the earlier of patient-r
e por ted onse t dat e ,s pecimen dat e or dat e of notification. bLabor a to ry -c
onfirmed cases only
.
cIncludes S
yphilis primar y, S yphilis sec o ndar y, S
yphilis <1 y
e
ar duration and S
yphilis newly acquir
ed . dFr om 2005, all par at yphoid r e co rd
ed as salmonellosis
.
eAHS fur
ther divided int
o the geogr aphical r e gion c o ve re d b
y their c
o
mponent P
u
blic Health Unit.
fRa
te
is based on a denominat
o
r of 8000 persons
NOS:
not other
w
ise specified
Vol. 18(7–8) NSW Public Health Bulletin | 111
Year in review
Ta ble 4. Disease notifica tions b y Ar
ea Health S
e
rv
ic
e of r
e
sidenc
e (2005 AHS boundaries),
NSW ,2006 a Co n d it ion G re ate r S o uthern e Gr ea ter W e stern e Hunt er/New Nor th C o ast e Nor thern S y d/ South Eastern S y d ne y South W e st e Syd n ey W e st e Justic e Health To tal f England e Ce n tr a l Co a st e Syd /I lla w a rr a e Albur y G o ulburn Br oken Hill Dubbo B a thurst N ew castle Ta mw or th P t Macquarie Lismor e G osf o rd Hornsb y W ollongong R andwick C amper d o w n L iv erpool P e nrith P a rr ama tta Anthrax 1 0 0 0 0 0 0 00 0 0 0 0 0 0 0 0 0 1 Ad verse ev ents af ter immunisation 8 1 0 0 0 3 5 2 2 2 4 4 1 7 0 1 11 5 0 65 Arbo vir a l inf e ct ion 182 44 32 89 46 352 101 316 404 102 44 66 52 19 22 33 16 0 1920 Barmah F o re st virus b 34 11 7 1 1 1 177 16 151 134 46 8 1 8 1 3 1 0 1 4 2 0 644 Ross R iv er virus b 147 31 25 78 45 173 85 163 263 55 25 47 26 8 1 6 2 7 1 1 0 1225 Ot h e r b 12 0 0 0 2 0 2 7 1 1 1 11 3 1 5 2 3 0 5 1
Blood lead lev
e l ≥ 15 µg/dL b 75 4 6 0 1 1 3 8 3 1 4 4 1 2 1 13 8 1 9 4 3 1 25 0 281 Bruc ellosis b 00 0 0 2 0 1 0 0 1 1 0 2 1 1 0 0 0 9 Chlam ydia tr achomatis inf e ct ion b 463 275 78 201 320 1475 371 349 565 502 1086 581 2172 1242 729 3 39 909 75 11864 Cholera b 00 0 0 0 0 0 0 0 0 0 0 0 3 0 0 0 0 3 Cr eutzf e ldt–Jakob disease b 01 0 0 0 1 1 0 0 1 0 0 0 0 2 2 0 0 8 Cr ypt o sporidiosis b 40 28 6 2 4 2 5 7 5 3 4 2 3 6 0 1 5 142 33 87 57 53 32 44 0 779 G astroent e ritis (institutional) 0 0 0 0 0 0 0 0 0 0 0 0 0 1 0 0 0 0 1 Giar diasis b 54 38 1 3 3 1 4 157 51 30 14 75 356 73 279 1 34 117 8 8 202 0 1720 Go n o rr hoea b 54 29 96 29 16 37 28 136 36 591 3 99 124 3 2 162 6 1696
Haemolytic uraemic syndrome
1 0 0 0 0 1 0 0 0 1 1 1 0 1 1 3 1 0 11 H. influenzae ty p e b 0 0 0 0 0 0 0 00 0 0 0 0 0 1 0 0 0 1 Hib epiglottitis b 10 0 0 0 1 0 0 0 1 1 0 0 0 0 2 0 0 6 Hib septicaemia b 00 0 0 0 0 0 0 0 0 0 1 0 1 0 1 1 0 4 Hib inf e ct ion (NOS) b 00 0 1 1 1 0 0 1 0 1 1 1 1 2 0 1 0 1 1 Hepatitis A b 12 2 1 2 2 0 0 3 5 1 0 3 1 41 0 1 3 2 2 4 0 9 5 Hepatitis B 2 8 2 5 1 2 8 9 6 0 2 1 2 8 2 7 4 0 276 54 323 4 68 512 5 3 535 39 2543 Hepatitis B: acut e vir a l b 21 2 0 2 7 1 1 3 1 3 4 6 7 4 2 5 3 5 4 Hepatitis B: other b 26 24 10 8 7 53 20 27 24 39 273 50 317 4 61 508 5 1 530 36 2489 Hepatitis C 115 107 25 73 123 346 91 145 223 185 215 204 4 93 450 5 81 161 377 509 4470 Hepatitis C: acut e vir a l b 25 0 2 0 6 0 3 0 0 4 0 2 5 0 3 1 7 4 0 Hepatitis C: other b 113 102 25 71 123 340 91 142 223 185 211 204 4 91 445 5 81 158 376 502 4430 Hepatitis D b 00 0 0 0 0 0 0 1 0 1 0 1 0 2 0 9 1 1 5 Hepatitis E b 00 0 0 0 0 0 1 1 0 1 0 0 0 3 0 4 0 1 0 HIV/AIDS HIV inf e ct ion b 30 0 0 0 1 4 3 5 0 0 3 4 5 08 4 1 5 4 11 29 0 371 AIDS 0 1 0 0 0 2 2 3 3 5 5 0 1 8 1 1 3 3 1 0 0 84 Influenza 2 3 1 4 0 3 1 3 3 7 5 6 1 8 6 2 6 34 19 118 2 4 3 8 1 3 122 1 616 Influenza – Ty pe A b 19 7 0 1 9 24 48 12 52 4 2 8 1 2 6 0 1 7 2 4 7 82 1 420 Influenza – Ty pe B b 45 0 2 3 1 3 5 2 9 1 3 63 7 4 1 4 24 0 0 150 Influenza – Ty
pes A & B
b 00 0 0 1 0 0 4 0 1 2 1 21 1 0 4 0 0 3 7 Influenza – Ty pe (NOS) b 02 0 0 0 0 3 0 1 0 1 0 0 2 0 0 0 0 9 Le gionellosis 3 0 0 0 3 1 0 0 1 0 L. longbeachae b 20 0 0 2 5 0 1 0 0 3 0 4 1 1 1 2 0 2 2 L. pneumophila b 10 0 0 1 5 0 0 0 2 1 3 43 1 3 3 1 8 0 5 4 Le g io nnair es ’d
isease – other
0 0 0 0 0 0 0 0 0 0 0 0 0 0 0 0 1 0 1 Le p ro sy 0 0 0 0 0 1 0 00 0 0 0 0 0 0 0 0 0 1 Le p to spir o sis b 00 0 1 0 4 7 2 2 0 0 1 0 0 0 0 0 0 1 7 List eriosis b 10 0 0 1 6 1 1 0 0 5 0 2 2 3 2 2 0 2 6 Ly mphogranuloma v e nereum (L GV ) b 01 0 0 0 0 0 0 0 0 0 0 0 0 0 0 0 0 1 Ma la ri a b 43 0 0 2 1 4 5 2 1 1 2 1 9 41 1 1 3 1 2 2 32 0 140 Me asles 1 0 0 0 1 1 0 1 1 2 91 1 1 9 4 91 0 0 6 0 Me
asles lab c
Ta ble 4. co n ti n u e d Co n d it ion G re ate r S o uthern e Gr ea te r W e stern e Hunt er/New Nor th C o ast e Nor thern S y d/ South Eastern S y d ne y South W e st e Syd n ey W e st e JHS T o tal f England e Ce n tr a l Co a st e Syd /I lla w a rr a e Albur y G o ulburn Br oken Hill Dubbo B a thurst N ew castle Ta mw or th P t Macquarie Lismor e G osf o rd Hornsb y W ollongong R andwick C amper d o w n L iv erpool P e nrith P a rr ama tta Me n ingoc occal – Ty pe W135 b 00 0 0 0 0 0 0 0 1 1 1 0 0 1 0 1 0 5 Me n ingoc occal – Ty pe Y b 00 0 0 0 0 0 0 0 0 1 0 0 0 0 0 0 0 1 Me n ingoc
occal disease – O
ther 1 0 0 0 0 4 1 1 1 1 4 1 9 2 4 2 2 1 3 4 Mumps b 20 0 0 2 2 1 1 5 0 2 8 3 3 12 7 1 8 8 25 0 154 Pe rt ussis 296 144 66 132 71 382 155 62 108 143 560 177 7 61 377 5 25 235 718 0 4918 Pn e u m o co
ccal disease (in
vasiv e ) b 22 23 4 1 0 2 6 7 8 8 21 23 28 51 24 56 36 62 26 65 0 564 Ps ittac osis b 63 1 0 9 2 7 0 3 8 2 2 6 3 2 7 8 6 1 9 4 Q f e ve r b 81 4 1 2 3 14 18 41 11 29 0 1 8 3 0 2 1 1 0 175 Rubella b 00 0 0 0 1 0 1 1 1 3 0 12 8 6 0 4 0 3 7 Salmonella inf e ct ion b, d 64 56 6 4 1 4 3 170 69 73 191 58 239 97 248 1 56 224 1 13 203 1 2058 Shigellosis b 10 1 2 1 2 1 4 9 0 7 1 23 14 3 1 4 0 75 Sy philis 1 8 21 20 9 1 3 1 2 1 2 2 3 1 5 4 2 2 1 1 89 203 1 39 24 96 22 881 Sy philis inf e ct ious b, c 00 0 0 2 4 1 0 3 0 1 1 1 1 00 63 5 3 10 0 210 Sy philis c o ngenital 0 0 0 1 0 0 1 0 0 0 1 0 0 0 0 0 1 0 4 Sy p h ilis other b 18 2 1 19 7 9 10 12 20 15 30 20 89 140 1 34 21 85 22 667 Te ta n u s 0 0 0 0 0 0 0 00 0 0 1 1 0 0 0 0 0 2 Tu b e rc ulosis b 52 1 0 0 1 3 2 4 3 12 48 5 6 8 8 4 9 4 9 106 0 461 Ty p h o id b 00 0 0 0 0 0 0 1 1 5 0 7 2 6 1 1 1 0 3 5 Ve ro to xi genic Escherichia c o li inf e ct ion b 03 0 0 0 2 1 0 0 0 0 1 0 0 1 0 2 0 1 0 aYe a
r of onset:
the earlier of patient-r
e por ted onse t dat e ,s pecimen dat e or dat e of notification. bLabor a to ry -c
onfirmed cases only
.
cIncludes S
yphilis primar y, S yphilis sec o ndar y, S
yphilis <1 y
e
ar duration and S
yphilis newly acquir
ed . dFr om 2005, all par at yphoid r e co rd
ed as salmonellosis
.
eAHS fur
ther divided int
o the geogr aphical r e gion c o ve re d b
y their c
o
mponent P
u
blic Health Unit.
fIncludes cases with unk
Vol. 18(7–8) NSW Public Health Bulletin | 113
Year in review
Table 5. Disease notifications by age group and sex of the case, NSW, 2006a
Condition 0–4 years 5–24 years 25–44 yrs 45–64 years 65+ years Total Totale
F M F M F M F M F M F M
Anthrax 0 0 0 0 0 0 0 1 0 0 0 1 1
Adverse events after immunisation 12 17 8 5 5 0 10 5 3 0 38 27 65
Arboviral infection 2 5 111 101 371 361 374 391 97 105 955 963 1920
Barmah Forest virusb 1 2 54 32 141 110 131 112 30 31 357 287 644
Ross River virusb 1 3 54 61 223 243 231 270 65 72 574 649 1225
Otherb 0 0 3 8 7 8 12 9 2 2 24 27 51
Blood lead level ≥15 µg/dLb 6 6 1 37 4 140 2 72 1 11 14 266 281
Brucellosisb 0 0 1 1 0 2 0 4 0 1 1 8 9
Chlamydia trachomatis infectionb 31 22 4563 2077 2101 2552 113 366 5 14 6814 5031 11864
Cholerab 0 0 0 0 0 0 0 0 3 0 3 0 3
Creutzfeldt–Jakob diseaseb 0 0 0 0 0 0 2 0 2 4 4 4 8
Cryptosporidiosisb 144 190 98 102 139 57 20 11 12 2 413 362 779
Giardiasisb 193 263 138 179 298 282 148 109 63 44 840 877 1720
Gonorrhoeab 2 0 109 340 99 930 16 189 1 5 227 1464 1696
Haemolytic uraemic syndrome 3 2 1 3 1 0 1 0 0 0 6 5 11
H. influenzaetype b 2 2 0 0 2 0 0 0 3 2 7 4 11
Hib epiglottitisb 0 0 0 0 0 0 0 0 0 1 0 1 1
Hib septicaemiab 0 2 0 0 1 0 0 0 2 1 3 3 6
Hib infection (NOS)b 2 0 0 0 1 0 0 0 1 0 4 0 4
Hepatitis Ab 5 2 21 19 14 13 7 5 3 6 50 45 95
Hepatitis B 5 9 190 221 645 728 248 377 33 63 1121 1399 2543
Hepatitis B: acute viralb 0 3 7 7 11 17 4 4 0 0 22 31 54
Hepatitis B: otherb 5 6 183 214 634 711 244 373 33 63 1099 1368 2489
Hepatitis C 7 10 254 313 925 1539 386 842 78 77 1650 2781 4470
Hepatitis C: acute viralb 0 1 5 6 8 13 2 4 0 1 15 25 40
Hepatitis C: otherb 7 9 249 307 917 1526 384 838 78 76 1635 2756 4430
Hepatitis Db 0 0 1 2 3 5 1 3 0 0 5 10 15
Hepatitis Eb 0 0 4 2 1 3 0 0 0 0 5 5 10
HIV/AIDS
HIV infectionb 1 1 9 23 30 214 7 80 0 4 47 322 371
AIDS 0 0 0 0 5 47 2 29 0 1 7 77 84
Influenza 67 63 64 73 65 50 67 49 61 57 324 292 616
Influenza – Type Ab 46 46 36 46 44 35 47 43 44 33 217 203 420
Influenza – Type Bb 18 15 23 26 13 10 11 5 12 17 77 73 150
Influenza – Types A & Bb 1 1 5 1 6 5 7 1 5 5 24 13 37
Influenza – Type (NOS)b 2 1 0 0 2 0 2 0 0 2 6 3 9
Legionellosis 0 0 0 0 3 5 12 22 12 23 27 50 77
L. longbeachaeb 0 0 0 0 1 1 6 3 3 8 10 12 22
L. pneumophilab 0 0 0 0 2 4 6 19 9 14 17 37 54
Legionnaires’ disease – other 0 0 0 0 0 0 0 0 0 1 0 1 1
Leprosy 0 0 0 0 0 1 0 0 0 0 0 1 1
Leptospirosisb 0 0 1 2 2 7 0 4 0 1 3 14 17
Listeriosisb 0 1 0 0 3 0 2 0 7 13 12 14 26
Lymphogranuloma venereum (LGV)b 0 0 0 0 0 0 0 1 0 0 0 1 1
Malariab 3 5 11 37 12 35 13 19 0 4 39 100 140
Measles 8 13 16 4 11 5 1 2 0 0 36 24 60
Measles lab confirmb 7 10 12 2 10 4 1 2 0 0 30 18 48
Measles (other) 1 3 4 2 1 1 0 0 0 0 6 6 12
Meningococcal disease 15 19 21 17 12 8 8 3 3 1 59 48 107
Meningococcal – Type Bb 9 14 11 7 2 3 4 3 1 0 27 27 54
Meningococcal – Type Cb 0 1 4 4 2 0 1 0 1 0 8 5 13
Meningococcal – Type W135b 1 0 1 0 0 0 2 0 1 0 5 0 5
Meningococcal – Type Yb 0 0 0 1 0 0 0 0 0 0 0 1 1
Meningococcal disease – Other 5 4 5 5 8 5 1 0 0 1 19 15 34
Mumpsb 0 2 23 28 37 43 12 7 2 0 74 80 154
Pertussis 82 104 325 266 915 517 1246 678 431 341 3000 1906 4918
Pneumococcal disease (invasive)b 24 38 14 33 39 52 69 77 101 117 247 317 564
Psittacosisb 0 1 6 3 10 13 16 22 6 17 38 56 94
Q feverb 1 1 8 13 15 49 17 50 5 16 46 129 175
Rubellab 1 1 2 5 10 14 1 1 1 0 15 21 37
Salmonella infectionb,d 272 278 271 308 195 203 163 151 132 78 1033 1019 2058
Shigellosisb 5 5 8 9 11 21 6 5 1 4 31 44 75
Syphilis 1 3 22 34 128 305 44 170 52 119 247 631 881
Syphilis infectiousb,c 0 0 3 17 14 131 2 39 0 3 19 190 210
Syphilis congenital 1 3 0 0 0 0 0 0 0 0 1 3 4
Syphilis otherb 0 0 19 17 114 174 42 131 52 116 227 438 667
Tetanus 0 0 0 0 0 0 0 0 1 1 1 1 2
Tuberculosisb 5 2 28 38 88 79 54 63 39 64 214 246 461
Typhoidb 4 1 4 6 6 11 1 1 0 1 15 20 35
Verotoxigenic Escherichia coliinfectionb 0 1 1 2 0 1 2 1 1 1 4 6 10
aOnset: the earlier of patient-reported onset date, specimen date or date of notification.
bLaboratory-confirmed cases only.
cIncludes Syphilis primary, Syphilis secondary, Syphilis <1 year duration and Syphilis newly acquired. dFrom 2005, all paratyphoid recorded as salmonellosis.
eIncludes cases with unknown age and sex and people who identify as transgender.
Table 6. Disease notifications where the case had died at the time of public health follow-up, by year of onset of illnessa, NSW, 1991–2006
Condition 1991 1992 1993 1994 1995 1996 1997 1998 1999 2000 2001 2002 2003 2004 2005 2006
Haemolytic uraemic syndrome 0 0 0 0 0 0 0 0 1 1 0 1 0 1 1 1
Hepatitis Ab 2 1 0 0 0 0 1 2 0 0 0 1 0 0 0 0
H. influenzaetype b 4 4 4 1 0 2 0 0 0 1 1 0 0 0 0 2
HIV/AIDS deathsc 350 337 393 432 365 280 134 76 74 87 62 67 64 58 38 36
Legionnaires’ disease – L. pneumophilab 1 10 5 3 4 6 2 0 2 1 2 0 2 2 2 1
Measles 3 2 0 0 0 0 0 0 0 0 0 0 0 0 0 1
Meningococcal disease – Type Bb 0 0 1 1 3 0 4 2 7 6 2 8 6 4 4 4
Meningococcal disease – Type Cb 0 0 1 1 0 2 2 10 4 4 5 10 6 1 2 1
Meningococcal disease – Type W135b 0 0 0 0 0 0 0 0 1 0 0 0 0 0 2 1
Meningococcal disease – Type Yb 0 0 0 0 0 0 0 1 0 1 0 0 0 0 1 0
Meningococcal disease – Other 3 8 9 13 4 5 1 4 2 3 0 1 2 1 0 0
Meningococcal (total) 3 8 11 15 7 7 7 17 14 14 7 19 14 6 9 6
Pneumococcal disease (invasive)b 0 0 0 0 0 0 0 0 0 0 6 96 75 89 61 61
Tetanus 0 0 1 0 0 0 0 0 0 0 0 0 0 0 0 0
Tuberculosisb 10 26 31 25 23 16 21 25 29 40 33 39 22 28 22 27
Verotoxigenic Escherichia coliinfectionsb 0 0 0 0 0 0 0 0 0 0 0 0 0 0 1 0
aYear of onset: the earlier of patient reported onset date, specimen date or date of notification.
bLaboratory-confirmed cases only.
Vol. 18(7–8) NSW Public Health Bulletin | 115 Hepatitis B is a viral infection that can cause chronic
inflammation of the liver and may lead to cirrhosis and hepatocellular carcinoma.1 In Australia in 2005, 6793
unspecified hepatitis B notifications were reported to the National Notifiable Disease Surveillance System, with 235 of these reported as being incident (or newly acquired) cases.2 In NSW, there were 54 newly acquired cases
reported.2 Furthermore, it has been estimated that the
prevalence of chronic hepatitis B infection in Australia ranges from 0.47–0.87%.3 Hepatitis B is preventable by
vaccination, and further spread can be avoided through administration of immunoglobulin prophylaxis within 14 days of exposure,1as well as through the provision of
information about modes of transmission and infection control. In addition, new treatment modalities are proving to be effective.4It would therefore be beneficial for cases
Enhanced surveillance of hepatitis B infection
in inner-western Sydney
Abstract: Objectives: We developed an enhanced
surveillance system for hepatitis B to improve the detection of newly acquired cases and to collect epidemiological data. Methods: The study was undertaken from February to June (inclusive) 2005 at the Sydney South West Area Health Service Eastern Zone Public Health Unit. A letter was sent to treating doctors on receipt of a notification, requesting additional information on cases. Cases identified by the treating doctors as newly acquired were followed up by telephone. Results: There were 295 notifications of hepatitis B in the period, of which three were newly acquired infec-tions. Only one of these three cases was identified through enhanced surveillance. Information on ethnicity was obtained. Conclusions: This enhanced surveillance system is of limited value as an ongoing process. We recommend that it be undertaken periodically to monitor the epidemiol-ogy of the disease.
Bradley L. Forssman
A,Band Leena Gupta
AASydney South West Area Health Service Public Health Unit,
Sydney South West Area Health Service
BCorresponding author. Email: [email protected]
of newly acquired hepatitis B to be detected in a timely manner to allow effective public health action to be insti-tuted, as well as to facilitate early referral for management.
Identifying newly acquired cases of hepatitis B can be problematic, however, as laboratories usually only test and report results for positive surface antigen (HBsAg), which indicates unspecified infection with hepatitis B, rather than IgM antibody to core antigen (HBcAb IgM), which indicates newly acquired infection. In addition, clinical details or related results such as liver function tests are very rarely provided to the Public Health Unit (PHU). Identification of newly acquired cases is therefore highly dependent on the treating doctor notifying the PHU. While medical practitioners are required under the NSW Public
Health Act 1991 to notify acute episodes of viral hepatitis,
it is acknowledged that under-reporting is a significant issue.5,6 In addition, laboratories provide limited
demo-graphic data (age, sex and postcode only), resulting in an incomplete picture of the epidemiology of hepatitis B.
A recent report of an enhanced surveillance system for hepatitis B in south-eastern Sydney stated that it was effective in increasing the detection of newly acquired cases by three-fold (from three to 10 cases) over a six-month period.7However, this system required a reasonably
high staff workload and relied on access to supplementary investigation results and clinical details. Consequently, it was unsuitable for implementation at our centre. An alter-native enhanced surveillance system for hepatitis B infec-tion was therefore developed, with the aims of improving both the detection of newly acquired cases and the collec-tion of epidemiological data to inform targeted public health action. This article presents the results of this enhanced surveillance and discusses the implications of its implementation.
Methods
In NSW, hepatitis B infection is notifiable by laboratories and acute viral hepatitis is notifiable by medical practi-tioners and hospitals under the Public Health Act 1991. The case definition for newly acquired hepatitis B is pro-vided in Box 1.8
Enhanced surveillance was undertaken from February to June (inclusive) 2005 at the Sydney South West Area Health Service (SSWAHS) Eastern Zone PHU, which services a large, ethnically diverse population of approxi-mately 500 000 in inner-western Sydney.9After receipt of