Please cite this article as: A. Sherbaf Moghaddam, A. Amiri, M. Bashiri , Multi-objective Economic-Statistical Design of Cumulative Count of Conforming Control Chart, International Journal of Engineering (IJE), TRANSACTIONS A: Basics Vol. 27, No. 10, (October 2014) 1591-1600
International Journal of Engineering
J o u r n a l H o m e p a g e : w w w . i j e . i rMulti-objective Economic-Statistical Design of Cumulative Count of Conforming
Control Chart
A. Sherbaf Moghaddam, A. Amiri *, M. Bashiri
Industrial Engineering Department, Faculty of Engineering, Shahed University, Tehran, Iran
P A P E R I N F O
Paper history:
Received 26 February 2014 Received in revised form 27 May 2014 Accepted 26 June 2014
Keywords:
Statistical Process Control
Cumulative Count of Conforming Charts, High-Quality Processes
Multi-Objective Economic-Statistical Design NSGA-II Algorithm
A B S T R A C T
Cumulative Count of Conforming (CCC) charts are utilized for monitoring the quality characteristics in high-quality processes. Executive cost of control charts is a motivation for researchers to design them with the lowest cost. Usually, in most researches, only one objective named cost function is minimized subject to statistical constraints, which is not effective method for economic-statistical design of control charts. In this paper, a multi-objective model for the economic-statistical design of the CCC control chart is developed. Then, multi-objective evolutionary algorithm (NSGA-II) for obtaining the Pareto optimal solution of the model is proposed. A numerical example is applied to illustrate the effectiveness of the proposed model. This model leads to lower cost and smaller probability of Type I and Type II errors, compared with economic model. In addition, a sensitivity analysis is done to investigate the effect of input parameters on the best solutions of the proposed model.
doi: 10.5829/idosi.ije.2014.27.10a.13
1. INTRODUCTION1
Control chart as one of Statistical Process Control (SPC) tools, has a very significant role in achieving process stability. However, traditional control charts face a number of problems in high-quality processes, which are very common in the modern manufacturing environments. Cumulative Count of Conforming (CCC) control charts is useful procedure for process control when large number of consecutive conforming items are perceived between two nonconforming ones. The CCC chart is useful for one-at-time inspections which are common in automated manufacturing processes. Generally, it is a technique for high-quality processes when nonconforming items are observed infrequently. This chart is statistically based on the geometric distribution. Firstly, Calvin [1] was developed the idea of tracking cumulative counts to monitor assignable causes in high quality process. Then, introduction of CCC charts is presented by Goh [2]. The use of CCC control charts has been further
1*Corresponding Author’s Email: [email protected] (A. Amiri)
studied by Lucas [3], Glushkovsky [4] and Xie and Goh [5]. Chan et al. [6] use the idea of counting the cumulative conforming items in the case of continuous production process. Similar to other control charts, an important stage in CCC chart implementation is its design. A common practice is to design the control chart with primarily statistical considerations.
The design of a control chart includes determining the sample size (n), the sampling frequency or time interval between samples (h), and the coefficient of control limits (l). One of the approaches for design of a control chart is statistical design in which only statistical properties such as probability of type I and type II errors are considered. However, design of control chart includes various expenses, such as the costs of sampling and checking, costs associated with examining out-of-control signals, the cost of locating and repairing assignable causes and costs of allowing nonconforming products to reach the customer. These expenses are not considered in statistical design. Hence, it is very rational to consider the design of control chart from an economic perspective. Economic design of control charts is another approach, in which a
cost model for particular type of industrial process is developed and optimization methodologies search the optimal solutions that minimize the expected cost per hour.
In the literature, many models have been developed for economic design of control charts. First time, Weiler [7] attempted to design a control chart based on an economic criterion. Executive cost of control chart cause that researchers design control charts economically based on either minimizing the cost or maximizing the benefit. Duncan [8] presented an economic model for X control chart that this model can be used in the most types of control charts. Also, Lorenzen and Vance [9] proposed another cost function for economic design of control charts. This model permits production to be continued or stopped during search or repair. These are two famous cost models used by many researchers in economic design of many control charts. McWilliams [10] and Surtihadi and Rachavachari [11] presented economic design of X chart with Lorenzen and Vance (LV) cost function. In addition, Montgomery et al. [12] used the LV cost function to economic design of EWMA chart and Simpson and Keats [13] applied it to economic model of CUSUM chart. Collani et al. [14] considered economic design of control charts for monitoring the nonconforming probability. Xie et al. [15] presented economic design of cumulative count of conforming (CCC) chart. They used LV cost function for economic model of CCC chart. Zhang et al. [16] extended economic design of cumulative count of conforming charts under inspection by samples. They proposed this model to monitor the cumulative number of samples inspected until a nonconforming sample is encountered.
Woodall [17] stated the economic design of control charts leads to poor statistical properties. So, economic-statistical design of control chart has been proposed to solve this problem. Saniga [18] was the first one who presented the economic-statistical design of X and R control charts including the economic objective and statistical constraints.
Multi-objective economic-statistical design of control charts is a new approach proposed by some researchers to design a control chart from both points of economic and statistical properties. Firstly, Evans and Emberton [19] introduced multi-objective and economic-statistical design for joint X and R control charts. They considered cost function and statistical properties as objectives that are optimized simultaneously. Hence, optimal design of a control chart can be considered as a multiple criteria decision-making (MCDM) problem. Del Castillo et al. [20] proposed a multi-objective approach in designing joint X and R control charts by using MCDM approach. Also, Celano and Fishera [21] presented a
multi-objective model based on Duncan [8] cost model for design of X control chart They optimized this model using genetic algorithm (GA). Zarandi et al. [22] used fuzzy cost parameters for multi-objective design of X control chart. They used adaptive neuro-fuzzy interface system (ANFIS) and GA to obtain optimal parameters of the X control chart. In addition, Chen and Liao [23] and Asadzadeh and Khoshalhan [24] used multi-objective approach for designing X control chart. Moreover, Amiri et al. [25] presented multi-objective economic-statistical model of MEWMA control charts and applied GA algorithm for obtaining optimal solutions. Amiri et al. [26] also considered multi-objective economic-statistical design of EWMA control chart. Bashiri et al. [27, 28] considered multi-objective economic-statistical design of X and np control charts, respectively. Safaei et al. [29] also investigated multi-objective economic-statistical design of X control chart.
Review of the literature shows that multi-objective economic-statistical design of the CCC control chart has not been yet considered by the researchers. Therefore, in this paper, we extend a multi-objective economic-statistical design of the CCC control chart by Lorenzen and Vance cost function. The design parameters of the CCC control chart are obtained such that the expected cost per hour as well as out-of-control average run length (ARL ) are minimized, while desired in-control average run length (ARL ) is obtained. In addition, a non-dominated sorting genetic algorithm II (NSGA-II) is applied to solve the proposed multi-objective model. Because, the objectives are nonlinear and complex and the NSGA-II algorithm has some advantages and leads to accpetable solutions in short time. The advantages of the NSGAII algorithm will be discussed in section 4.
The remainder of this paper is organized as follows: In section 2, first the CCC control chart is introduced briefly then the Lorenzen and Vance cost function used in economic design of the CCC control chart is discussed. In section 3, multi-objective model for economic-statistical design of CCC control charts is developed. In section 4, the NSGA-II algorithm as the optimization method is proposed for the multi-objective economic-statistical design of control charts. In section 5, a numerical example is presented and the effectiveness of the multi-objective model is illustrated. Also, this proposed model is compared with economic model. In section 6, sensitivity analysis on the parameters of the proposed model is presented. Finally, the conclusion is mentioned in section 7.
2. THE ECONOMIC MODEL FOR CCC CHART
control chart was first developed by Calvin [1]. Suppose x is the number of observed items before a nonconforming item. Then, x is a geometric random variable with probability function:
(1− ) = 1,2, … , (1)
where, p is probability of observed nonconforming item.
Average of geometric distribution is considered as center line of the CCC control chart:
= 1⁄ (2)
Suppose false alarm probability equals to . Control limits for the CCC control chart based on the geometric distribution are derived from the cumulative distribution function of x. These control limits are as follows:
= (( ⁄ )) (3)
= ( ( ⁄)) (4)
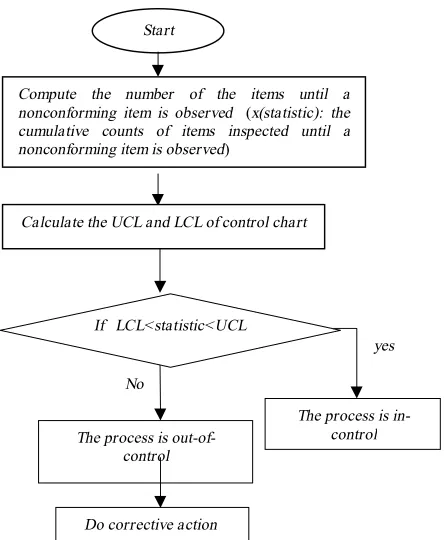
Design parameters of the CCC control charts are including the coefficient of control limit for the CCC control chart (l) and sampling interval or time between two consecutive samples (h). In CCC control charts, sample size (n) is equal to 1 because sampling procedure is based on one-at-a-time. The machanism of the CCC control charts by using a flowchart is shown in Figure 1.
Figure 1. Machanism of the CCC control chart
2. 2. The Cost Function In this paper, Lorenzen and Vance [9] cost function is used in the formulation of the cost function for the CCC control chart. In this cost function, minimizing the expected cost in unit of time that computed by dividing the expected total cost in a cycle by the expected cycle time is used. The total cost in a cycle involves sampling inspection, search and repair costs in addition to the cost due to producing nonconforming items. The parameters of this cost model are notated as follows:
Cost and time parameters
quality cost per hour due to nonconformities produced while production process is in-control
quality cost per hour due to nonconformities produced while production process is out-of-control
a fixed cost per sampling
b cost per unit sampling
Y cost per false alarm
W cost to located and repair the assignable cause E time to sampling and chart one item
expected search time when signal is a false alarm expected time to detect the assignable cause expected time to repair the process
Process parameters
expected nonconforming productions when process is in-control
expected nonconforming productions when process is out-of-control
= 1 if production process continues during search0 if production process stops during search
= 1 if production process continues during repair0 if production process stops during repair
Dependent parameters
average run length when process is in-control
average run length when process is out-of-control s expected number of samples taken when process is in-control
expected time of occurrence of assignable cause
The process is assumed to begin in a state of statistical control with a known fraction non-conforming p . Assignable cause occurrence causes the fraction nonconforming of process changes to p . The time between events of the assignable cause is exponentially distributed with a mean .
The expected cost per hour for economic model of CCC control chart is defined as follows:
= + + × , (5) Start
Compute the number of the items until a nonconforming item is observed (x(statistic): the cumulative counts of items inspected until a nonconforming item is observed)
The process is in-control The process is
out-of-control
Do corrective action If LCL<statistic<UCL Calculate the UCL and LCL of control chart
yes
where, S , S and D are defined in Equations (6) to (8), respectively.
= ( − )(− + +ℎ( ) + + ) − [(1− ) + (1− ) ] +
− ( ) +
(6)
= 1 + (− + +ℎ( ) + + ) (7)
and
= 1 +( ) + (− + +ℎ( ) +
+ ) (8)
So, expected number of samples when process is in-control (s) and expected time of occurrence of assignable cause ( ) are obtained as follows:
= (9)
and
= − (10)
In this paper, only lower control limit for the CCC control chart is investigated due to its practicality and simplicity. When the CCC statistic falls out of upper control limit, the fraction of nonconforming in the process is decreased. Hence, we ignore the UCL of the CCC control chart and use a one-sided CCC control chart. The number of consecutive conforming items is counted up to the time which a nonconforming one is detected. If the count is smaller than or equal to lower control limit (LCL), assignable causes is taken place.
3. MULTI-OBJECTIVE ECONOMIC-STATISTICAL MODEL
The main issue with the economic design of control chart is ignoring statistical properties. Therefore, to overcome this problem economic design of control chart is completed by statistical constraints and economic-statistical design is formed. Usually, in economic-statistical design of control charts, cost function is minimized as single objective subjected to statistical properties. Statistical properties including probability of Type I and II error or in-control average run length ( ) and out-of-control average run length ( ). In this paper, we apply statistical properties of and . Economic-statistical design of control charts leads to better results in both economic and statistical properties.
In this paper, we develop multi-objective economic-statistical design of Cumulative Count of Conforming control charts (CCC). In this multi-objective model, optimal values of sampling interval
(h) and the coefficient of the lower control limit (l) are obtained such that cost function as well as out-of-control average run length ( ) are minimized, while in-control average run length ( ) is a statistical constraint.
The proposed multi-objective model for CCC control charts is as follows:
(ℎ, )
Subject to : > h and l > 0 ,
(11)
where, (ℎ, ) is economic cost function of CCC control chart presented in Equation (1). The ARL is the lower bound for in-control ARL Also, in-control average run length ( ) and out-of-control average run length ( ) for CCC control charts are obtained by Equations (12) and (13).
= + + ( ) (12)
= + + ( ) (13)
To decrease the total cost, the average run length should be large when the process is in-control ( ) and it should be small when the process is out-of-control ( ).
4. OPTIMIZATION ALGORITHM
solutions in the overall front. In this evolutionary algorithm (NSGA-II), the solution with the lowest rank and the most crowding distance is the optimum solution. Finally, the NSGA-II algorithm leads to more accurate and better solutions.
In this section, we apply NSGA-II algorithm to solve the multi-objective economic-statistical model of CCC control charts and to obtain Pareto optimal set. The decision variables of the proposed model are sampling interval (h) and the coefficient of lower control limit (l). Figure 2 illustrates a pattern of a chromosome. Hence, a chromosome consists of two genes, as decision variable. The chromosomes are compared based on their fitness function.
Steps of the NSGA-II algorithm for finding a Pareto optimal set of multi-objective model are defined as follows:
1. Generate initial population of size n-pop (the number of chromosomes), randomly.
2. Calculate out-of-control average run length ( ), in-control average run length ( ) and cost function (C) for each chromosome.
3. By using non-domination criteria, rank the initial population
4. Compute crowding distance for the initial population.
5. Use the crossover and mutation operator to generate intermediate population of size n-pop. 6. Evaluate objectives (C and ) and constraint
( ) for this created intermediate population. 7. Combine the parent and intermediate populations,
then rank them and compute the crowding distance.
8. Select population that has best individuals based on the rank and crowding distance criteria as a new population of size n-pop.
9. Go to step 3 and repeat the steps until the stopping rule (number of generations) occurs.
In this algorithm, crossover operator is used with the probability of 0.8. The mutation operator creates the mutated children using adaptive mutation of the genes with the probability of 0.3. Also, the crowding distance means the relative closeness of a solution to other solutions in the population and is applied for the solutions in the same rank or in each front. Eventually, chromosomes with Pareto optimal values are reported as the Pareto solution set for multi-objective economic-statistical design of the CCC control chart.
5. NUMERICAL EXAMPLE
In this section, we evaluate the performance of the proposed method using a numerical example. Lorenzen and Vance [9] depicted a foundry operation which produces 84 casting per hour. In castings production, a standard is set to proscribe high carbon-silicate content
as it will result in low tensile strength. In this place, we consider the case where castings production process is a high quality process with very low fraction nonconforming. Therefore, the CCC control chart should be used because nonconforming items occur rarely in process. Suppose in-control fraction nonconforming items = 0.0001 and out-of-control fractions nonconforming items, varying from 0.0005 to 0.01.
In this process, fixed cost per sample equals to 0 and cost per unit sampled is $4.22, Cost per hour due to nonconformities produced when the process is in-control = $4.2 and when the process is out-of-control = $420. Also, cost per false alarm and cost to locate and repair the assignable cause = = $977.40. Other parameters of process are defined as follows:
= = = 5 60⁄ = 0.083 , = 45 60⁄ = 0.75 , = 1 , = 0
Multi-objective economic-statistical design of the CCC control chart in Equation (11) is applied. In this model ARL is assumed to be equal to 10000. The upper and lower bounds of decision parameters are defined as:
2≤ ≤500 0≤ℎ≤2.
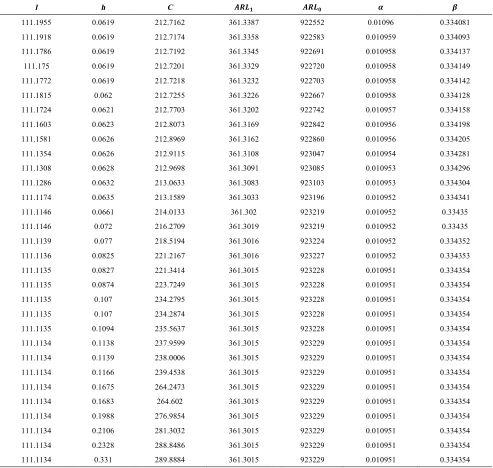
This multi-objective model is solved by the NSGA-II algorithm with the n-pop equals to 50 and optimal values of design parameters are reported in Table 1.
( = 0.0001 , = 0.001)
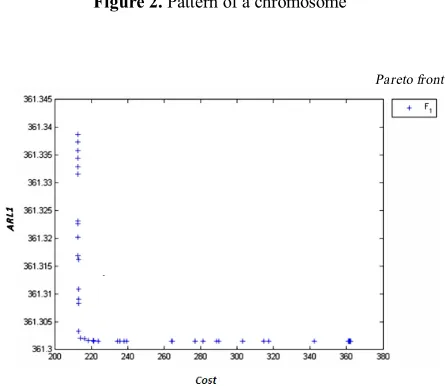
The Pareto front for cost and ARL of the multi-objective economic-statistical design of CCC control charts is shown in Figure 3.
h l
Figure 2. Pattern of a chromosome
Pareto front
The design parameters of the CCC control chart are optimized by minimizing both the economic cost function and ARL . Based on the Table 1 and assuming that the cost function is more important than the other objective function in designing the considered control chart, it can be concluded that the preferred solution from the economic and statistical viewpoint is the solution vector (l, h) = (111.1955, 0.0619). By using
∗= 111.1955 and ℎ∗= 0.0619, total cost is equal to
$212.7162 and is equal to 361.3387. Also, probability of Type I and II errors obtained equal to 0.01096 and 0.33408, respectively. As discussed in the introduction section, the economic design of the CCC control chart is investigated by Xie et al. [15]. The
result of thepreferred solution of our proposed method is compared with the optimal solution of economic design of the CCC control chart in Table 2. As Table 2 shows, the preferred solution of the proposed multi-objective economic-statistical design of CCC control chart is better than the optimal solution of the economic design of CCC control chart reported by Xie et al. [15]. In other words, expected total cost in multi-objective economic-statistical model is less than the expected total cost in the economic design of CCC control chart. In addition, probabilities of Type I and II errors in the proposed model are better than their values in economic model of CCC control chart.
TABLE 1. Pareto optimal solutions of multi-objective economic-statistical model of CCC control charts ( = 0.0001 , = 0.001)
l h C
111.1955 0.0619 212.7162 361.3387 922552 0.01096 0.334081
111.1918 0.0619 212.7174 361.3358 922583 0.010959 0.334093
111.1786 0.0619 212.7192 361.3345 922691 0.010958 0.334137
111.175 0.0619 212.7201 361.3329 922720 0.010958 0.334149
111.1772 0.0619 212.7218 361.3232 922703 0.010958 0.334142
111.1815 0.062 212.7255 361.3226 922667 0.010958 0.334128
111.1724 0.0621 212.7703 361.3202 922742 0.010957 0.334158
111.1603 0.0623 212.8073 361.3169 922842 0.010956 0.334198
111.1581 0.0626 212.8969 361.3162 922860 0.010956 0.334205
111.1354 0.0626 212.9115 361.3108 923047 0.010954 0.334281
111.1308 0.0628 212.9698 361.3091 923085 0.010953 0.334296
111.1286 0.0632 213.0633 361.3083 923103 0.010953 0.334304
111.1174 0.0635 213.1589 361.3033 923196 0.010952 0.334341
111.1146 0.0661 214.0133 361.302 923219 0.010952 0.33435
111.1146 0.072 216.2709 361.3019 923219 0.010952 0.33435
111.1139 0.077 218.5194 361.3016 923224 0.010952 0.334352
111.1136 0.0825 221.2167 361.3016 923227 0.010952 0.334353
111.1135 0.0827 221.3414 361.3015 923228 0.010951 0.334354
111.1135 0.0874 223.7249 361.3015 923228 0.010951 0.334354
111.1135 0.107 234.2795 361.3015 923228 0.010951 0.334354
111.1135 0.107 234.2874 361.3015 923228 0.010951 0.334354
111.1135 0.1094 235.5637 361.3015 923228 0.010951 0.334354
111.1134 0.1138 237.9599 361.3015 923229 0.010951 0.334354
111.1134 0.1139 238.0006 361.3015 923229 0.010951 0.334354
111.1134 0.1166 239.4538 361.3015 923229 0.010951 0.334354
111.1134 0.1675 264.2473 361.3015 923229 0.010951 0.334354
111.1134 0.1683 264.602 361.3015 923229 0.010951 0.334354
111.1134 0.1988 276.9854 361.3015 923229 0.010951 0.334354
111.1134 0.2106 281.3032 361.3015 923229 0.010951 0.334354
111.1134 0.2328 288.8486 361.3015 923229 0.010951 0.334354
TABLE 2. Comparison Multi-objective economic statistical and Economic design of CCC control charts
Multi-objective economic statistical design Economic design
212.72 111.19 0.0619 0.0109 0.3341 820.08 962.08 0.0214 0.0916 0.3822
TABLE 3. Sensitivity analysis of multi-objective economic statistical model of CCC control charts under different values of
0.0001 0.001 212.902 383.13 111.04 0.0609 0.011 0.90037
0.0002 0.001 216.192 378.26 105.7009 0.0637 0.02072 0.90054
0.0003 0.001 227.032 362.001 99.36 0.0933 0.02908 0.90628
0.0004 0.001 236.885 363.84 99.002 0.1106 0.03845 0.9066
0.0005 0.001 245.082 360.15 98.65 0.1279 0.04766 0.90692
0.0006 0.001 242.8 358.204 96.64 0.1246 0.05578 0.90875
0.0007 0.001 287.857 357.82 96.48 0.2326 0.06467 0.90888
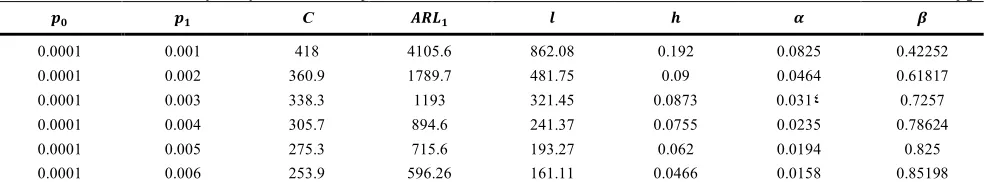
TABLE 4. Sensitivity analysis of multi-objective economic statistical model of CCC control charts under different values of
C
0.0001 0.001 418 4105.6 862.08 0.192 0.0825 0.42252
0.0001 0.002 360.9 1789.7 481.75 0.09 0.0464 0.61817
0.0001 0.003 338.3 1193 321.45 0.0873 0.031٤ 0.7257
0.0001 0.004 305.7 894.6 241.37 0.0755 0.0235 0.78624
0.0001 0.005 275.3 715.6 193.27 0.062 0.0194 0.825
0.0001 0.006 253.9 596.26 161.11 0.0466 0.0158 0.85198
6. SENSITIVITY ANALYSIS
In this section, a sensitivity analysis on the input parameters of the multi-objective model of the CCC control chart is done. There are fifteen input parameters in the Lorenzen and Vance [9]cost function used in the economic-statistical model of CCC control chart. The process parameters consist of and which define the in-control and out-of-control states of the process. The effect of these parameters on the best solutions of multi-objective economic-statistical model of the CCC control chart is studied in this section. Moreover, the effect of other input parameters on the best solutions of the proposed model is investigated. Sensitivity analyses on the best solutions of the multi-objective economic-statistical model of the CCC control chart under different values of and are done and the results are summarized in Tables 3 and 4, respectively. The other parameters such as the probability of false alarm ( ) and the probability of Type II error ( ) are also listed in these tables. Table 3 shows that the optimal total cost (C) is an increasing function of . For a given value of , the optimal sampling interval (h) is increasing when the value of p increases. Also, for a given value of , optimal control limit(l) is decreasing when the value of increases. The results show that the probability of Type I and II errors are increasing when the value of increases. Also, Table 4 demonstrates that the optimal
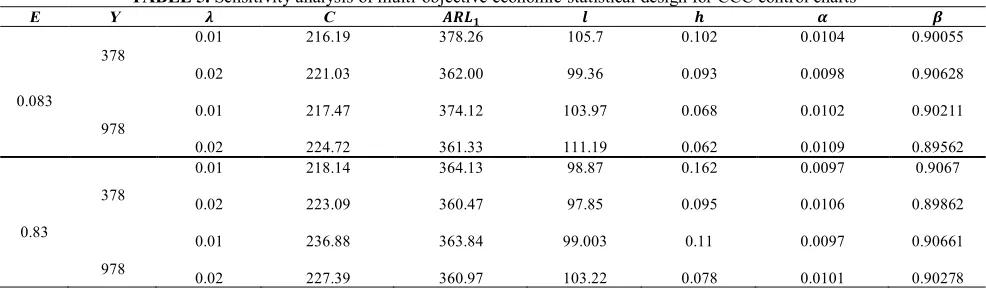
total cost (C) is an decreasing function of . For a given value of , when the value of p increases, the optimal sampling interval (h) is increasing and optimal control limit(l) is decreasing. The results show when the value of increases, the probability of Type I error is decreasing while the probability of Type II error is increasing. Table 5 shows sensitivity analysis of the proposed model under three input parameters. These parameters are including time to sampling and charting a sample (E), cost per false alarm (Y) and λ. {0.083, 0.83}, {378, 978}, {0.01, 0.02}
Table 5 shows that with increasing value of time to sampling and charting a sample (E), optimal total cost is increasing and is decreasing while optimal sampling interval (h) is increasing and optimal control limit (l) is decreasing. However, changes in the time to sampling and charting a sample (E) has slight effect on the values of probability of Type I and II errors (α and
β). In addition, Table 5 shows that changes in the cost per false alarm (Y) has little effect on the optimum values of ARL , probability of Type I and II errors (α
TABLE 5. Sensitivity analysis of multi-objective economic-statistical design for CCC control charts
E Y C
0.083 378 978 0.01 0.02 0.01 0.02 216.19 221.03 217.47 224.72 378.26 362.00 374.12 361.33 105.7 99.36 103.97 111.19 0.102 0.093 0.068 0.062 0.0104 0.0098 0.0102 0.0109 0.90055 0.90628 0.90211 0.89562 0.83 378 978 0.01 0.02 0.01 0.02 218.14 223.09 236.88 227.39 364.13 360.47 363.84 360.97 98.87 97.85 99.003 103.22 0.162 0.095 0.11 0.078 0.0097 0.0106 0.0097 0.0101 0.9067 0.89862 0.90661 0.90278
7. CONCLUSION AND FUTURE RESEARCHES
In this paper, a multi-objective economic-statistical model was proposed for designing CCC control chart. The proposed model was solved by a multi-objective algorithm (NSGA-II). A numerical example was used to illustrate effectiveness of the proposed procedure. In addition, the performance of the proposed method is compared with the performance of economic design of the CCC control chart. The results showed that the proposed multi-objective model can address the disadvantages of the economic model. Multi-objective economic-statistical design of the CCC control chart is better than the economical. In the other words, the proposed model leads to better economic and statistical properties. Moreover, a sensitivity analysis is done under different values of input parameters. The results showed that the input parameters including , , E, Y andλ affect the optimum design parameters of multi-objective economic-statistical model of CCC control charts significantly. Multi-objective economic-statistical design of other processes such as multistage processes (Niaki et al. [32], Niaki and Moeinzadeh [33]) or processes with profile quality characteristic (Niaki et al. [34], Keramatpour et al. [35], Abdella et al. [36]) can be considered as future researches.
8. REFERENCES
1. Calvin, T., "Quality control techniques for" zero defects"",
Components, Hybrids, and Manufacturing Technology, IEEE
Transactions on, Vol. 6, No. 3, (1983), 323-328.
2. Goh, T., "A control chart for very high yield processes",
Quality Assurance, Vol. 13, No. 1, (1987), 18-22.
3. Lucas, J.M., "Control scheme for low count levels", Journal of
Quality Technology, Vol. 21, No. 3, (1989), 199-201.
4. Glushkovsky, E.A., "‘On‐line’g‐control chart for attribute data", Quality and Reliability Engineering International, Vol. 10, No. 3, (1994), 217-227.
5. Xie, M. and Goh, T., "The use of probability limits for process control based on geometric distribution", International
Journal of Quality & Reliability Management, Vol. 14, No. 1,
(1997), 64-73.
6. Chan, L., Lai, C., Xie, M. and Goh, T., "A two-stage decision procedure for monitoring processes with low fraction nonconforming", European Journal of Operational Research, Vol. 150, No. 2, (2003), 420-436.
7. Weiler, H., "On the most economical sample size for controlling the mean of a population", The Annals of
Mathematical Statistics, (1952), 247-254.
8. Duncan, A.J., "The economic design of x charts used to maintain current control of a process", Journal of the
American Statistical Association, Vol. 51, No. 274, (1956),
228-242.
9. Lorenzen, T.J. and Vance, L.C., "The economic design of control charts: A unified approach", Technometrics, Vol. 28, No. 1, (1986), 3-10.
10. McWilliams, T.P., "Economic, statistical, and economic-statistical x chart designs", Journal of Quality Technology, Vol. 26, No. 3, (1994), 227-238.
11. Surtihadi, J. and Raghavachar, M., "Exact economic design of x charts for general time in-control distributions", The
International Journal Of Production Research, Vol. 32, No.
10, (1994), 2287-2302.
12. Montgomery, D.C., Torng, J.-C., COCHRAN, J.K. and LAWRENCE, F.P., "Statistically constrained economic design of the ewma control chart", Journal of Quality Technology, Vol. 27, No. 3, (1995), 250-256.
13. Simpson, J.R. and Keats, J.B., "Sensitivity study of the cusum control chart with an economic model", International Journal
of Production Economics, Vol. 40, No. 1, (1995), 1-19.
14. Collani, E.V. and Drager, K., "A simplied economic design of control charts for monitoring the nonconforming probability",
Journal of Economic Quality Control, Vol. 10, (1995),
231-247.
15. Xie, M., Tang, X. and Goh, T., "On economic design of cumulative count of conforming chart", International Journal
of Production Economics, Vol. 72, No. 1, (2001), 89-97.
16. Zhang, C.W., Xie, M. and Goh, T.N., "Economic design of cumulative count of conforming charts under inspection by samples", International Journal of Production Economics, Vol. 111, No. 1, (2008), 93-104.
18. Saniga, E.M., "Economic statistical control chart with an application to x-bar and r charts", Technometrics, Vol. 31, No. 3, (1989), 313-320.
19. Evans, G.W. and Emberton, G.R., "Bicriterion design of process control charts", International Journal of Production
Economics, Vol. 22, No. 2, (1991), 141-150.
20. Castillo, E.D., Mackin, P. And Montgomery, D.C., "Multiple-criteria optimal design of x control charts", IIE Transactions, Vol. 28, No. 6, (1996), 467-474.
21. Celano, G. and Fichera, S., "Multi-objective economic design of an x control chart", Journal of Computers & Industrial
Engineering, Vol. 37, No. 1, (1999), 129-132.
22. Zarandi, M.H.F., Alaeddini, A., Turksen, I.B. and Ghazanfari, M., A neuro-fuzzy multi-objective design of shewhart control charts, in Analysis and design of intelligent systems using soft computing techniques., Springer. (2007) 842-852.
23. Chen, Y.-K. and Liao, H.-C., " Multi-criteria design of an X control chart ", Computers & Industrial Engineering, Vol. 46, No. 4, (2004), 877-891.
24. Asadzadeh, S. and Khoshalhan, F., " Multiple-objective design of an X control chart with multiple assignable causes ", The
International Journal of Advanced Manufacturing
Technology, Vol. 43, No. 3-4, (2009), 312-322.
25. Amiri, A., Mogouie, H. and Doroudyan, M.H., "Multi-objective economic-statistical design of mewma control chart",
International Journal of Productivity and Quality
Management, Vol. 11, No. 2, (2013), 131-149.
26. Amiri, A., Bashiri, M., Maleki, M.R. and Sherbaf Moghaddam, A., "Multi-objective markov based economic-statistical design of ewma control chart using nsga-ii and moga algorithms", To appear in International Journal of Multicriteria Decision
Making, (2014).
27. Bashiri, M., Amiri, A., Doroudyan, M.H. and Asgari, A., "Multi-objective genetic algorithm for economic-statistical design of xbar control chart", Scientia Iranica, Vol. 20, No. 3, (2013), 909-918.
28. Bashiri, M., Amiri, A., Asgari, A. and Doroudyan, M.H., "A multiple objective efficient design of np control charts using data envelopment analysis", International Journal of
Engineering-Transactions C: Aspects, Vol. 26, No. 6, (2013),
587-588.
29. Safaei, A.S., Kazemzadeh, R.B. and Niaki, S.T.A., "Multi-objective economic statistical design of x-bar control chart considering taguchi loss function", The International Journal
of Advanced Manufacturing Technology, Vol. 59, No. 9-12,
(2012), 1091-1101.
30. Fonseca, C.M. and Fleming, P.J., "Genetic algorithms for multiobjective optimization: Formulationdiscussion and generalization", in ICGA. Vol. 93, (1993), 416-423.
31. Deb, K., "Multi-objective optimization using evolutionary algorithms, John Wiley & Sons, Vol. 16, (2001).
32. Niaki, S.A., Houshmand, A. and Moeinzadeh, B., "On the performance of a multivariate control chart in multistage environment", International Journal of Engineering, Vol. 14, No. 1, (2001), 49-64.
33. Niaki, S. and Moeinzadeh, B., "A multivariate quality control procedure in multistage production systems", International
Journal of Engineering Transactions A Basics, Vol. 10, No.
4, (1997), 191-208.
34. Niaki, S.T.A., Abbasi, B. and Arkat, J., "A generalized linear statistical model approach to monitor profiles", International
Journal of Engineering Transactions A Basics, Vol. 20, No.
3, (2007), 233-242.
35. Keramatpour, M., Niaki, S., Khedmati, M. and Soleymanian, M., "Monitoring and change point estimation of ar (1) autocorrelated polynomial profiles", International Journal of
Engineering-Transactions C: Aspects, Vol. 26, No. 9, (2013),
933-942.
36. Abdella, G., Yang, K. and Alaeddini, A., "Effect of location of explanatory variable on monitoring polynomial quality profiles", International Journal of Engineering-Transactions
Multi-objective Economic-statistical Design of Cumulative Count of Conforming
Control Chart
A. Sherbaf Moghaddam, A. Amiri, M. Bashiri
Industrial Engineering Department, Faculty of Engineering, Shahed University, Tehran, Iran
P A P E R I N F O
Paper history:
Received 26 February 2014 Received in revised form 27 May 2014 Accepted 26 June 2014
Keywords:
Statistical Process Control
Cumulative Count of Conforming Charts, High-Quality Processes
Multi-Objective Economic-Statistical Design NSGA-II Algorithm
هﺪﯿﮑﭼ
لﺮﺘﻨﮐيﺎﻫرادﻮﻤﻧ
CCC
ﺪﻧﻮﺷﯽﻣهدﺮﺑرﺎﮐﻪﺑﻻﺎﺑﺖﯿﻔﯿﮐﺎﺑيﺎﻫﺪﻨﯾآﺮﻓردﯽﻔﯿﮐيﺎﻫﻪﺼﺨﺸﻣﺶﯾﺎﭘياﺮﺑ
.
ﯽﺗﺎﯿﻠﻤﻋﻪﻨﯾﺰﻫ
ﺪﺷﺎﺑﯽﻣﻪﻨﯾﺰﻫﻦﯾﺮﺘﻤﮐﺎﺑﺎﻫرادﻮﻤﻧﯽﺣاﺮﻃردنﺎﻘﻘﺤﻣياﺮﺑﯽﮐﺮﺤﻣناﻮﻨﻋﻪﺑلﺮﺘﻨﮐيﺎﻫرادﻮﻤﻧ
.
ﻊﺑﺎﺗ،ﺎﻫﺶﻫوﮋﭘزايرﺎﯿﺴﺑرد
يﺎﻬﺘﯾدوﺪﺤﻣﻦﺘﻓﺮﮔﺮﻈﻧرد ﺎﺑفﺪﻫﻊﺑﺎﺗﮏﯾناﻮﻨﻋ ﻪﺑﻪﻨﯾﺰﻫ
ﯽﺣاﺮﻃرديﺮﺛﻮﻣ دﺮﮑﯾورﻦﯾاﻪﮐدﻮﺷﯽﻣﻢﻤﯿﻨﯿﻣ يرﺎﻣآ
يدﺎﺼﺘﻗا
-ﯽﻤﻧلﺮﺘﻨﮐيﺎﻫرادﻮﻤﻧيرﺎﻣآ
ﺪﺷﺎﺑ
.
يدﺎﺼﺘﻗاﯽﺣاﺮﻃياﺮﺑﻪﻓﺪﻫﺪﻨﭼلﺪﻣﮏﯾ،ﻪﻟﺎﻘﻣﻦﯾارد
-لﺮﺘﻨﮐرادﻮﻤﻧيرﺎﻣآ
CCC
ﺖﺳاهﺪﺷهدادﻪﻌﺳﻮﺗ
.
ﻪﻓﺪﻫﺪﻨﭼﯽﻠﻣﺎﮑﺗﻢﺘﯾرﻮﮕﻟاﺲﭙﺳ
)
NSGA-II
(
لﺪﻣﻮﺗرﺎﭘﻪﻨﯿﻬﺑباﻮﺟندروآﺖﺳﺪﺑياﺮﺑ
ﺖﺳاهﺪﺷدﺎﻬﻨﺸﯿﭘ
.
ﺖﺳاهﺪﺷهدﺎﻔﺘﺳايدﺪﻋلﺎﺜﻣﮏﯾزا،يدﺎﻬﻨﺸﯿﭘلﺪﻣﺮﺛاندادنﺎﺸﻧياﺮﺑ
.
يدﺎﺼﺘﻗالﺪﻣﻦﯾا
-يرﺎﻣآ
دﻮﺷﯽﻣيدﺎﺼﺘﻗالﺪﻣﺎﺑﻪﺴﯾﺎﻘﻣردﺮﺘﮑﭼﻮﮐمودولواعﻮﻧيﺎﻄﺧتﻻﺎﻤﺘﺣاوﺮﺘﻤﮐﻪﻨﯾﺰﻫﻪﺑﺮﺠﻨﻣيدﺎﻬﻨﺸﯿﭘ
.
ﺰﯿﻟﺎﻧآﻦﯿﻨﭽﻤﻫ
ورويﺎﻫﺮﺘﻣارﺎﭘﺮﺛاﯽﺳرﺮﺑياﺮﺑﯽﺘﯿﺳﺎﺴﺣ
ﺖﺳاهﺪﺷمﺎﺠﻧاهﺪﺷدﺎﻬﻨﺸﯿﭘلﺪﻣيﺎﻫباﻮﺟﻦﯾﺮﺘﻬﺑيوريد
.