Iranian Journal of Electrical and Electronic Engineering, Vol. 15, No. 4, December 2019 536
Optimal Estimation of Weibull Distribution Parameters in
order to Provide Preventive-Corrective Maintenance Program
for Power Transformers
H. Sh. Solari*,**, B. Majidi*,**(C.A.) and M. Moazzami*,**
Abstract: In this paper, a new method for modelling and estimation of reliability parameters of power transformer components in distribution and transmission voltage levels for preventive-corrective maintenance schedule of transformers is proposed. In this method, with optimal estimation of Weibull distribution parameters using least squares method and input data uncertainty reduction, failure rate and probable distributions of power transformers’ components as the key parameters of equipment reliability is estimated. Then by using the results of this modelling, a maintenance schedule for evaluation the effect of maintenance on reliability of this equipment is presented. Simulation results using real failure data of 196 power transformers on 33 to 230kV voltage levels show that applying the proposed method in addition to uncertainty reduction of raw input data and better estimation of equipment reliability, improve decision making regarding maintenance schedule of power transformers.
Keywords: Failure Rate, Preventive-Corrective Maintenance, Weibull Distribution, Power Transformer.
List of Parameters1
MTTF Mean Time to Failure
MTBF Mean Time between Failures
Fi Median rank Fi of failure event i
i The mean rank of the failure sample
N Total ranking number
ti Age of failure sample in rank i [year]
β Shape parameter
α Scale parameter
f(t) Probability of failure at specific time t
R(t) Reliability function at specific time t
λ(t) Rates of failure at specific time t
μ Mean deviation
σ Standard deviation
Iranian Journal of Electrical and Electronic Engineering, 2019. Paper first received 05 May 2019, revised 09 June 2019, and accepted 11 June 2019.
* The authors are with the Smart Microgrid Research Center, Najafabad Branch, Islamic Azad University, Najafabad, Iran. ** The authors are with the Department of Electrical Engineering, Najafabad Branch, Islamic Azad University, Najafabad, Iran. E-mails: [email protected], [email protected], and [email protected].
Corresponding Author: B. Majidi.
Γ Gama function
1 Introduction
OWER transformers in addition to playing an important role in efficiency and reliability of power networks, are among expensive equipment in electricity industry. Therefore, it is necessary to reduce the risk of failure and forced outages by design optimization and performing preventative repairs to improve the reliability of the system [1, 2]. The transformer fault or failures lead to high costs of electricity outages and customer dissatisfaction. Therefore, analysis of the behaviour of this equipment requires knowledge about a way in which suitable data is collected and reliability modelling perform in a proper way [3]. The previous researches regarding transformers reliability studies included statistical analysis and their health index evaluation, which were carried out to investigate their life cycle and/or justifiable alternative for them [4-7]. In addition, some studies carried out to identify transformers failure modes and causes, in order to perform maintenance with a focus on reliability [8, 9]. In [10] the concept of quality mode and statistical tools to provide reliability modelling with transformer
P
Iranian Journal of Electrical and Electronic Engineering, Vol. 15, No. 4, December 2019 537 insulation components is presented. In [11] an
integrated reliability model for the transformer by breaking a transformer into three sub-systems and studying reliability models is developed. In [12] a mathematical model to estimate the remaining lifetime of power transformers and a strategy to replace them is developed. Ref. [13] applied posterior normal distribution function and new managerial decision-making methods in order to provide a framework for
effective replacement of transmission network
equipment according to reliability and techno-economic criteria. In [14] normal failure and repair, inspection and testing transmission rates using multi-mode Markov model and sensitivity analysis is calculated. Then to reduce repair and maintenance costs, an optimized repair and maintenance schedule based on these parameters is proposed. In [15], with common assumptions about Weibull distribution parameters and exponential distribution function for showing repairable and unrepairable failures of power transformers, a
method for optimization of substations spare
transformers number regardless of the actual failure probability distribution function (past operation history), has been proposed. In [16] by using least squares method and direct use of the Median-rank approximate formula in the estimation of the Weibull distribution parameters, parameters of failure rate and MTBF of power transformers insulation are calculated. Then by comparison of this estimation and DGA experimental results from past statistical records, a monitoring-based maintenance program for transformer monitoring has
been proposed
.
The theory of linear cumulative damageto study the effect of heat, electrical and mechanical stress as a random and time variable on the lifetime of power transformers is presented in [17]. According to this method, the form of its probabilistic model is estimated with assumption that failures follow the Weibull distribution theoretical model. A method for reliability parameters estimation of circuit breakers and preventive maintenance based on grouping the average time between common parts failure by using Weibull distribution function is developed in [18].
Using hypothetical models and putting the usual parameters behaviour of distribution functions cannot lead to desirable analyses in reliability studies of the system. For example, consider a system that has been operate for many years and continues to serve. Since the equipment and system experience a lot of failures and repairs, its future behaviour cannot be predicted without considering the real probability distribution of past behaviour of the equipment. On the other hand, when the least squares method is used to estimate the Weibull distribution parameters, the empirical distribution function of the lifetime model is a key factor in increasing the accuracy of this estimation. It should be noted that key equipment reliability parameters such as failure rate, failure probability distribution and MTBF are the average value of statistical records. Therefore,
direct use of the Mean-rank approximate formula in the least squares method for estimating the Weibull distribution parameters and key reliability indices without considering the required reliability margin for
data, lead to large errors
.
According to the mention problems, the purpose of this study is to propose a new method for modelling and
estimation of reliability parameters of power
transformer components at different voltage levels to provide the scheduling of the preventive-corrective maintenance program according to the actual statistical records of the equipment. In order to reduce the statistical uncertainties and increase the estimation accuracy of the Weibull distribution parameters, the Mean-rank formula for optimization of the least squares method and estimation of Weibull distribution parameters is used. Then by modelling and estimation of the key reliability parameters of power transformers components, the proposed method are compared with two methods of Weibull distribution using direct approximation of Median–rank formula and empirical exponential distribution and a maintenance program in order to evaluate the preventive-corrective maintenance effect on the reliability of power transformer is
proposed
.
The rest of this paper is organized as follows:Section 2 explains the required data for modelling of power transformers reliability. Section 3 is devoted to modelling and transformers reliability parameter estimation. In Sections 4 and 5, reliability of power transformers for preventive maintenance and an example of the model is presented, respectively. Finally, in Section 6 conclusion of this research is dedicated.
2 Input Data for Modelling of Reliability
The reliability model is described by parameters such as failure frequency and repair time, failure and repair rate, the rate of transition between different states of availability and unavailability, the average of lifetime and standard deviation. These parameters are system reliability evaluation input data and are obtained from experimental test or empirical data such as number of failure, repair and maintenance reports. In this paper, failures of different parts of power transformer are considered independently. Transformer failures data are captured from 196 power transformers at the voltage level of 33 to 230kV, rated power of 5 to 315MVA and the age distribution in the range of 2 to 30 years with an average age of 15 years [8]. These transformers date are related to TANTRANSCO and TANGEDCO Indian companies that gathered during 5 years 2009-2013 [8]. Fig. 1 shows the relationship between the age of power transformers and their unavailability [13].
On this basis, it can be assumed that due to the low unavailability of this equipment and previous repairs, simulation of this paper has been carried out to provide the next maintenance program for a group of equipment with an average age of 15 years. Failure analysis based
Iranian Journal of Electrical and Electronic Engineering, Vol. 15, No. 4, December 2019 538 Fig. 1 Relationship between unavailability and age of power
transformers [13].
Table 1 Numbers of failures in power transformers according to the voltage level during 2009-2013 [8].
Subpopulation [kV] Years
2009 2010 2011 2012 2013 Total 33-11 11 15 14 16 15 71 66-11 0 0 0 0 1 1 110-11 7 6 11 8 9 41 110-22 3 9 8 7 8 35 110-33 0 9 10 10 13 42 110-66 0 1 0 0 1 2 230-110 0 1 1 0 2 4 Total no. of failures 21 41 44 41 49 196
on various voltage levels and different components and sub-components of power transformers is presented in Table 1. This table shows the failure distribution of power transformers for different voltage levels of 33, 66, 110 and 230kV during 5 years (2009-2013) [8]. Table 2 also shows the number of failures of studied power transformers for each component.
From Fig. 2 it could be found that dielectric breakdowns encompass about 41% of total failures of power transformers. Moreover, failures in windings, bushings, tap changers, and core include 14, 13, 10, and 8 percentages of total failures in power transformers respectively. These components with higher share of failure have to be considered as important parts for
careful supervision and maintenance schedule
inspection.
3 Reliability Modelling of Components
In this paper, rate of failure and mean time between failures (MTBF) as the key parameters of reliability in power transformers are estimated using Weibull distribution function and available data for each part. Taking advantage of this modelling, reliability modelling of main components and level of accessibility of equipment will be obtained. Weibull distribution method is mostly used in modelling and careful analysis of failure rates, forecasting failure and in modelling of failure and fault process stemmed from aging. The
distribution would be specified by the two shape (β) and
scale (α) parameters. In this way, mean and standard
deviations will not appear directly in probability distribution function of this distribution. Input data in reliability evaluation include mean of parameters of equipment interruption model (e.g. failure frequency and number of failure). When the least square method is used for estimation of Weibull distribution parameters,
Table 2 Failures in power transformers according to its various parts during 2009-2013 time periods [8].
Total No. of failures 2013
2012 2011 2010 2009 Category wise failures
80 20 19 20 10 11 Insulation
28 3 13 5 7 - Winding
20 5 3 6 5 1 OLTC
26 6 - 9 9 2 Bushing
15 6 4 1 4 - Core
9 4 - 2 3 - Cooling
System
6 3 1 2 - - Tank and accessories
12 2 1 1 1 7 Others
196 49 41 44 41 21 Transformer
Fig. 2 Share of failures percent in power transformers components [8].
empirical distribution function is an important factor that is effective on precision of estimation of the results. If we use raw data from power network equipment in estimation of these parameters, large failures would be made in calculation of indices. Therefore, according to the provided method in estimation of Weibull parameters, the average rating method is used via statistical data regarding frequency and number of failure according to equation (1):
( - 0.3)
( 0.4)
i
i F
N
(1)
where Fi is the average rank of occurring i-thfailure. If
equipment are considered as separate components, for
each individual component, i is the adjusted rank of age
of failed component and N is the total ranking number
of component. In this case, Weibull parameters would be determined using (2):
ln( )
i i
i i
y m x c
x t
(2)
where ti is independent age (year) of failed component
in rank i. Therefore, yi can be determined from (3):
1 ln ln
1
i
i
y
F
(3)
From (2) and (3), the Weibull shape parameter β can
be calculated as given in (4):
Iranian Journal of Electrical and Electronic Engineering, Vol. 15, No. 4, December 2019 539
1 1
1
2
1 2
1
N N
N i i i i
i i i
N
i
N i
i i
x y
x y
N m
x x
N
(4)
and
1 1
N N
i i
i y i x
c m
N N
(5)The life or scale parameter α can be determined
from (6):
c m
e
(6)
By estimation of two parameters of the method, behaviour of equipment according to the equipment curve in Fig. 1 can be modelled [7]. In continuation,
Weibull probability distribution function f(t) which
shows probability of failure in certain time (t) is defined
through (7):
1 0
( ) 0
0 t
t
f t e for
t
(7)
Moreover, cumulative distribution function F(t), that
show the probability of failure in time (t) would be
calculated through (8):
0
( ) 1 0
0 t
F t e for t
(8)
In continuation, reliability function R(t) which shows
probability of remaining intact till the time (t) and the
rates of failure λ(t)will be expressed with (9) and (10):
( ) 1 ( )
t
R t F t e
(9)
1 ( )
( ) ( )
f t t t
R t
(10)
The shape parameter β, affects the shape of distribution
curve. When the shape parameter has changed, the
curve of f(t) varies in different shapes. For example the
curve turns to exponential distribution while β = 1. It
resemble the Rayleigh and normal distribution while
β = 2 and β = 3.5 respectively. The failure rate is
decreasing while β < 1, and the component is in the
early failure. Also the failure rate is constant while β = 1
and the component is in the occasional failure. The
failure rate is increasing while β > 1, and the component
is in the loss failure [3, 18]. The mean and standard
deviation of Weibull distribution are defined according to (11) and (12) in terms of shape and scale parameters:
1 1
(11)
2 2 1 2 2 1 1
(12)
where, Γ(̇.) represents gamma function, which could be
estimated according to [2], as mentioned below:
( 0.5) 1
2 1
12
t t
t e
t
(13)
In long term unavailability and without considering restrictions related to repair or replacement time of equipment, in order to estimate equipment failure rate, the mean time to failure (MTTF) and the mean time between failure (MTBF) should be equal. With through estimating constant value of gamma [3], MTBF will be calculated for a sample component via (14):
1 1 MTBF
(14)
4 Transformer Reliability as a Function of Repair and Maintenance Schedule
Total failure rate of power transformer considering important components of it for reliable performance is defined through (15):
1
( ) ( )
n
i i
t t
(15)where, λi(t) is the rate of failure in i-th critical part of
equipment and n is the total subcomponents of the
transformer. To improve the reliability of equipment, those components having relatively similar rate of failure and MTBF will be place in first priority of precautionary inspection, test, repair and maintenance program. The components with lower importance are repair or replace in a programmed preventive repair schedule. For a precautionary repair and maintenance schedule of higher importance components, the following equation will be defined after performing repair and maintenance schedule:
1
( ) ( ) ( )
m
total i
i
t t t
(16)where, m is the number of important component of the
equipment after repair or replacement in i-thyear which
will be deducted from total rate of failure, after performance of repair and maintenance schedule. Therefore, through this repair and maintenance schedule, total rate of failure of the equipment will be
Iranian Journal of Electrical and Electronic Engineering, Vol. 15, No. 4, December 2019 540 relatively or absolutely improve (in case of replacement
of one part) before occurring expected next failure waiting time. However, the rate will be increase again because of the increase in age of equipment and the effect of time on the failure
5 Simulation Results
The analysis of reliability parameters through Weibull distribution function, including data gathering and ranking of important parts of equipment, estimation of parameters, the output results and their interpretation is presented in this section.
5.1. Evaluation of Reliability Parameters for All Transformer Parts
The Weibull distribution parameters, MTBFs, and failure rates for all subcomponents are calculated using the procedure described in Section 3 and shown in Table 3.
It is to be noted that simulation have been performed for a similar distribution age group of transformers with an average age of 15 years and results show variations in the calculated probability distribution for a 20-year
period of time [8]. In the estimation of the Weibull distribution parameters using the proposed method in this paper, the number of input failures data is only important in increasing the accuracy of the linear values of the number of years of failure data acquisition. Hence, this assumption does not reduce in any way the value of the calculated results [19]. This calculation is used for scheduling a preventive-corrective maintenance plan for the next average age of the transformer. These results clearly show that the use of the proposed method and the actual data in estimation of Weibull distribution parameters and reliability of power transformers can play a significant role in bringing computer results closer to analytical results.
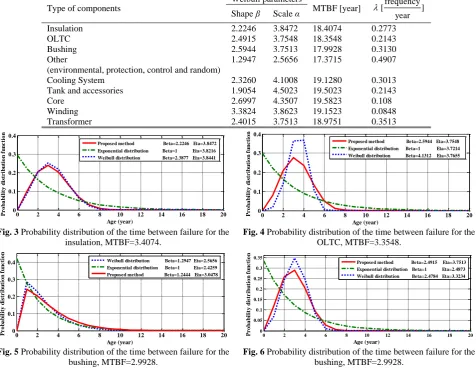
According to Weibull estimation parameters for all parts of the transformer (not considering share of each part in proper performance of the equipment), probability distribution of failures are presented in Figs. 3-10. The proposed method is compared with
exponential distribution (e.g. β = 1) and classic Weibull
distribution. Moreover, for reasonable comparison, MTBFs of exponential and Weibull distributions have been shown in Figs. 3 to 11.
Table 3 Reliability parameters, MTBFs and failure rate of each part (Weibull distribution/Mean-Rank).
frequency [ ] year MTBF [year] Weibull parameters
Type of components
Scale α
Shape β
0.2773 18.4074 3.8472 2.2246 Insulation 0.2143 18.3548 3.7548 2.4915 OLTC 0.3130 17.9928 3.7513 2.5944 Bushing 0.4907 17.3715 2.5656 1.2947 Other
(environmental, protection, control and random)
0.3013 19.1280 4.1008 2.3260 Cooling System 0.2143 19.5023 4.5023 1.9054
Tank and accessories
0.108 19.5823 4.3507 2.6997 Core 0.0848 19.1523 3.8623 3.3824 Winding 0.3513 18.9751 3.7513 2.4015 Transformer
0 2 4 6 8 10 12 14 16 18 20 0 0.1 0.2 0.3 0.4 Age (year) P r o b a b il it y d is tr ib u ti o n f u n c ti o n
Proposed method Beta=2.2246 Eta=3.8472 Exponential distribution Beta=1 Eta=3.8216 Weibull distribution Beta=2.3877 Eta=3.8441
0 2 4 6 8 10 12 14 16 18 20 0 0.1 0.2 0.3 0.4 Age (year) P r o b a b il it y d is tr ib u ti o n f u n c ti o n
Proposed method Beta=2.5944 Eta=3.7548 Exponential distribution Beta=1 Eta=3.7214 Weibull distribution Beta=4.1312 Eta=3.7655
Fig. 3 Probability distribution of the time between failure for the insulation, MTBF=3.4074.
Fig. 4 Probability distribution of the time between failure for the OLTC, MTBF=3.3548.
0 2 4 6 8 10 12 14 16 18 20 0 0.1 0.2 0.3 0.4 Age (year) P r o b a b il it y d is tr ib u ti o n f u n c ti o n
Weibull distribution Beta=1.2947 Eta=2.5656 Exponential distribution Beta=1 Eta=2.4259 Proposed method Beta=1.2444 Eta=3.0478
0 2 4 6 8 10 12 14 16 18 20
0 0.05 0.1 0.15 0.2 0.25 0.3 0.35 Age (year) P r o b a b il it y d is tr ib u ti o n f u n c ti o n
Proposed method Beta=2.4915 Eta=3.7513 Exponential distribution Beta=1 Eta=2.4873 Weibull distribution Beta=2.4784 Eta=3.3234
Fig. 5 Probability distribution of the time between failure for the bushing, MTBF=2.9928.
Fig. 6 Probability distribution of the time between failure for the bushing, MTBF=2.9928.
Iranian Journal of Electrical and Electronic Engineering, Vol. 15, No. 4, December 2019 541
0 2 4 6 8 10 12 14 16 18 20 0 0.05 0.1 0.15 0.2 0.25 0.3 Age (year) P r o b a b il it y d is tr ib u ti o n f u n c ti o n
Proposed method Beta=2.3260 Eta=4.1008 Exponential distributio Beta=1 Eta=4.0962 Weibull distribution Beta=2.412 Eta=4.1056
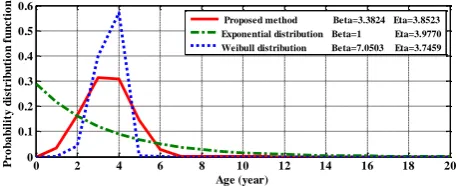
0 2 4 6 8 10 12 14 16 18 20 0 0.1 0.2 0.3 0.4 0.5 0.6 Age (year) P r o b a b il it y d is tr ib u ti o n f u n c ti o n
Proposed method Beta=3.3824 Eta=3.8523 Exponential distribution Beta=1 Eta=3.9770 Weibull distribution Beta=7.0503 Eta=3.7459
Fig. 7 Probability distribution of the time between failure for the cooling system, MTBF=4.1280.
Fig. 8 Probability distribution of the time between failure for the tank and accessories, MTBF=4.5023.
0 2 4 6 8 10 12 14 16 18 20 0 0.05 0.1 0.15 0.2 0.25 0.3 Age (year) P r o b a b il it y d is tr ib u ti o n f u n c ti o n
Proposed method Beta=2.3260 Eta=4.1008 Exponential distributio Beta=1 Eta=4.0962 Weibull distribution Beta=2.412 Eta=4.1056
0 2 4 6 8 10 12 14 16 18 20
0 0.05 0.1 0.15 0.2 0.25 0.3 0.35 Age (year) P rob ab il it y d is tr ib u ti on f u n ct
ion Proposed method Beta=1.9054 Eta=4.5023
Exponential distributio Beta=1 Eta=3.8670 Weibull distribution Beta=2.1054 Eta=4.5590
Fig. 9 Probability distribution of the time between failure for the core, MTBF=4.5823.
Fig. 10 Probability distribution of the time between failure for the winding, MTBF=4.1523.
0 2 4 6 8 10 12 14 16 18 20
0 0.05 0.1 0.15 0.2 0.25 0.3 0.35 Age (year) P r o b a b il it y d is tr ib u ti o n f u n c ti o n
Proposed method Beta=2.4015 Eta=3.7513 Exponential distribution Beta=1 Eta=2.7353 Weibull distribution Beta=2.7538 Eta=3.2397
Fig. 11 Probability distribution of the time between failure for transformer, MTBF=3.9751.
From Figs. 3-11, it is clear that the base exponential distribution mostly used, creates very different distribution shapes from estimated distribution through real failure data. The hypothesis of time between failures by the results from exponential distribution in a constant risk function (no memory), shows that remain life span of a part is not depending on its current age. In other words, exponential distribution shows no view of dependence to time of equipment feature; while, the Weibull distribution obtained from real failure data shows that rate of failure as a feature depends on time. For example, according to Fig. 11 that show probability distribution time between failures for total set of components, it can be seen that the probability of failure of the proposed method for the second to fourth years is 0.2708. This amount for Weibull distribution using the Medain-Rank formula and exponential distribution are 0.30 and 0.1220 respectively. These results show a significant difference in the accuracy of Weibull distribution using the Medain-Rank formula and exponential distribution compared to the method presented in this paper. Therefore, two desirable results from the proposed method results can be explain here. At first, according to Fig. 1 and using components unavailability data for power system reliability studies,
exponential and empirical distribution due to
computation of unavailability parameter, may not clearly show actual changes of previous operation conditions. Whereas, the obtained results from Weibull distribution in addition to appropriate show of unavailability behaviour, is more intended to show distribution of number of failures of a component during a time period (age time).
The second point is the effect of optimizing the estimation of the Weibull distribution parameters, which shows how the use of the Mean-Rank formula in calculation of the least squares method can improve the accuracy of the results of the distribution parameters and components reliability. The effect of this optimization is more sensible when it comes to the fact that constraints in time and condition of data sampling obtained from equipment during useful life period may reduce certainty of these data in the records of power companies [19].
5.2. Maintaining or Improvement of Transformers’ Reliability According to a Function of Repair and Maintenance Schedule
Repair and maintenance is considered as one of the important measures in electricity companies. This activity includes regular field visits, overhauls, and renovation of parts or equipment before occurrence of failures. A main principle in reliability-based repair and maintenance is the importance of equipment and the way that these equipment repaired and maintained to keep the system reliability. So, with calculation of relatively similar MTBFs for all important sub-component and also their grouping, a joint schedule of repair and maintenance will be performed on them. On the other hand, this modelling could be applied for the
Iranian Journal of Electrical and Electronic Engineering, Vol. 15, No. 4, December 2019 542 study of repair and maintenance scheduling with the
least exploitation risk of power system. Of course, it should be noted that considering all aspects of repair and maintenance in a reliability model is complicated and almost impossible. Repair and maintenance scheduling for subcomponents of transformer are shown in Table 4.
First group includes more important parts of power transformer with MTBF of 17.9928-18.4074 years,
which in 17th year, precautionary repair and
maintenance will be impose on them. Moreover, on the year 17, the effect of other factors (protection, control, environmental and external) could be review. Second group of parts are those including less important components of power transformers with MTBFs of 19.1280–19.5023 years; while, repair and maintenance schedule imposed on them will be performed on the year 18.
It should be noted that in developing the next maintenance plan, the average time until the next failure of each component is added to the average distribution age of the transformer (15 years). For example, insulation MTBF is obtained from 3.4074 years (obtained from simulation) which when added to the first 15 years of age of the equipment, the value has been considered 18.4074 years. It is to be noted that precautionary repair and maintenance necessarily do not mean replacement of a part or component; it could also include regular field visits, overhauls, and various tests made on the equipment. However, corrective repair and maintenance program may be performed for a group of equipment with the same failure distribution for five years according to estimated MTBFs in Figs. 3-11 without considering the experience of previous operation condition. Finally, estimation improvement of
failure parameters of equipment under both
precautionary, repair and maintenance procedures could be made upon decrease of frequency of the failure and repair time or improvement of failure parameters resulted from aging. Fig. 12 shows the failure rate for more important subcomponents according to the proposed repair and maintenance schedule. This figure clearly shows that the delay in carrying out preventive maintenance due to budget constraints, in addition to
increasing the failure rate, will increase probable corrective repair and maintenance for other components. For example, the delay in carrying out the maintenance program for the insulation of the transformers can lead to increase the probability of failure of the cooling system, transformer core and winding. These results cannot be obtained from the analysis of exponential and empirical distribution functions. It should be noted that by doing preventive repair and maintenance program for
components with higher importance before 17th year or
in year 17 may not completely prevent the occurrence of random failures. Therefore, the effect of other factors on failure of power transformers in this repair program should also be considered as a corrective program for the failure of power transformers. On the other hand, it is clear that if a preventive-corrective maintenance program is implemented simultaneously, the failure rate will be significantly reduced. Therefore, in terms of repair and maintenance, using time-dependent model of failure improve decision time for scheduling repair and maintenance programs to keep an acceptable level of reliability.
6 Conclusion
The results of this study show that due to the effect of sampling and test time limit on the accuracy of the input data collected for a power transformer components, the direct use of the Median-Rank formula to calculate the least squares method for estimation of Weibull distribution and reliability parameters of power transformer lead to large errors. Thus in this paper, using Mean-Rank and least squares method, the uncertainty of input data is minimized and by creating a sufficient margin of confidence in the input data, the estimation of Weibull distribution parameters and reliability of the power transformer components are optimized. Simulation results show that by optimizing the estimation of the Weibull distribution parameters and using real data, the values of failure parameters of power transformers can be calculated more precisely by obtaining a realistic view of the changes in the previous operation condition of power transformer and the characteristics of its components failure. Also the
Table 4 Proposed repair and maintenance schedule for two groups of parts in power transformer.
Group
Year of planned maintenance
Suggested repair and maintenance
Maintenance component
Failure rate before maintenance schedule [frequency/year]
Failure rate after maintenance schedule [frequency/year]
First 17th Preventive
Insulation
0.8076 0.1308
OLTC Bushing
Corrective Other 0.4907 0.0866
Second 18th Corrective
Core
0.7084 0.1807
Winding Cooling system Tank and Accessories
Iranian Journal of Electrical and Electronic Engineering, Vol. 15, No. 4, December 2019 543
0 2 4 6 8 10 12 14 16 18 20
0 0.2 0.4 0.6 0.8 1 1.2 1.4
Time (year)
F
a
il
u
r
e
r
a
te
Failure rate after preventive maintenance schedule
Failure rate after corrective maintenance schedule
Failure rate before corrective and preventive maintenance schedule Failure rate after corrective and preventive maintenance schedule
Fig. 12 Proposed repair and maintenance schedule for two groups of parts in power transformer.
Weibull distribution that obtained from the actual failure data shows that the failure rate characteristic of each component is time-dependent. Therefore, by using the proposed method results, a preventive maintenance program can be scheduled for higher significant components that reduce the risk of forced outages of power transformers at various voltage levels.
References
[1] R. Billiton and R. N. Allan, Reliability evaluation
of engineering systems: concepts and techniques. 2nd
Ed., New York: Plenum Press, 1992.
[2] L. P. Di Noia, D. Lauria, F. Mottola, and R. Rizzo,
“Design optimization of distribution transformers by
minimizing the total owning cost,” International
Transactions on Electrical Energy Systems, Vol. 27, No. 11, pp. e2397, 2017.
[3] W. Li, Risk assessment of power systems models
methods and applications. John Wiley & Sons, Inc. Publication, 2005.
[4] M. Akbari, P. Khazaee, I. Sabetghadam, and
P. Karimifard, “Failure modes and effects analysis
(FMEA) for power transformers,” in 28th
International Power System Conference (PSC), Tehran, Iran, 2013.
[5] M. Abdelfatah, M. EL-Shimy, and H. M. Ismail,
“Reliability analysis of 220 kV power transformers
in Egypt,” Ain Shams Engineering Journal, Vol. 2,
No. 3–4, pp. 183–194, 2011.
[6] E. Abbasi and O. P. Malik, “Failure rate estimation
of power transformers using inspection data,”
International Conference on Probabilistic Methods Applied to Power Systems (PMAPS), 2016.
[7] T. Suwanasri, R. Phadungthin, and C. Suwanasri,
“Risk-based maintenance for asset management of
power transformer: practical experience in
Thailand,” International Transactions on Electrical
Energy Systems, Vol. 24, No. 8, pp. 1103–1119, 2014.
[8] R. Murugan and R. Ramasamy, “Failure analysis of
power transformer for effective maintenance
planning in electric utilities,” Engineering Failure
Analysism, Vol. 55, pp. 182–192, 2015.
[9] P. Hilber, V. Miranda, M. Matos, and L. Bertling,
“Multi objective optimization applied to
maintenance policy for electrical networks”, IEEE
Transactions on Power Systems, Vol. 22, No. 4, pp. 1675–1682, 2007.
[10]A. Van Schijndel, J. M. Wetzer, and
P. A. A. F. Wouters, “Reliability estimation of paper
insulated components,” in Annual Report
Conference on Electrical Insulation and Dielectric Phenomena, 2007.
[11]A. Van Schijndel, P. Wouters, E. F. Steennis, and
J. Wetzer, “Approach for an integral power
transformer reliability model,” European
Transactions on Electrical Power, Vol. 22, No. 4, pp. 491–503, 2012.
[12]P. A. A. F. Wouters, A. Van Schijndel, and
J. M. Wetzer, “Remaining lifetime modelling of power transformers: individual assets and fleets,”
IEEE Electrical Insulation Magazine, Vol. 27, No. 3, pp. 45–51, 2011.
[13]S. K. E. Awadallah, J. V. Milanović, and
P. N. Jarman, “Reliability based framework for cost-effective replacement of power transmission
equipment,” IEEE Transactions on Power Systems,
Vol. 29, No. 5, pp. 2549–2557, 2014.
[14]A. Koksal and A. Ozdemir, “Improved transformer
maintenance plan for reliability centred asset
management of power transmission system,” IET
Generation, Transmission & Distribution, Vol. 10, No. 8, pp. 1976–1983, 2016.
[15]V. Mijailovic, “Probabilistic model for planning
keeping of power transformer spare components
with general repair time distribution,” Electric
Power Systems Research, Vol. 97, pp. 109–115, 2013.
[16]E. Chaidee and W. Tippachon, “Failure statistics
and condition evaluation for power transformer
maintenance,” in Power and Energy Engineering
Conference (APPEEC), Asia-Pacific, 2011.
[17]C. Bai, W. Gao, and T. Liu, “A preliminary study
of transformer life estimation based on linear
cumulative damage theory,” International
Transactions on Electrical Energy Systems, Vol. 24, No. 9, pp. 1217–1231, 2013.
[18]C. Suwanasri, S. Lipirodjanapong, T. Suwanasri,
and W. Wangdee, “Failure rate analysis of circuit breaker and itspreventive maintenance application,” in International Conference on Probabilistic Methods Applied to Power Systems (PMAPS), pp. 1– 6, 2014.
Iranian Journal of Electrical and Electronic Engineering, Vol. 15, No. 4, December 2019 544
[19]Q. Liao, X. Wang, D. Ling, Z. Xiao, and
H. Z. Huang, “Equipment reliability analysis base on the Mean-Rank method of two-parameter Weibull
distribution,” in International Conference on
Quality, Reliability, Risk, Maintenance, and Safety Engineering, 2011.
H. Sh. Solari was born in Isfahan, Iran. He received his M.Sc. degree in Electrical Engineering from Islamic Azad University of Najafabad (IAUN). His research interests include protection and reliability of power transformers.
B. Majidi was born in Isfahan, Iran. He received his Ph.D. degree in Electrical Engineering from Amirkabir University of Technology, Tehran, Iran. He is currently Assistant Professor in Islamic Azad University of Najafabad (IAUN). His research interests include electrical machines, power electronics and variable speed drives.
M. Moazzami received the B.Sc. and M.Sc. degree in Electrical Engineering
from Islamic Azad University of
Najafabad, Najafabad, Iran, in 2004 and 2007, respectively, and the Ph.D. from the Electrical Engineering Department, University of Isfahan, Iran, in 2013. Now he is Assistant Professor in the Electrical Engineering Department of IAUN. His main areas of research interests are power system dynamics, electricity markets, renewable energy, and microgrids.
© 2019 by the authors. Licensee IUST, Tehran, Iran. This article is an open access article distributed under the terms and conditions of the Creative Commons Attribution-NonCommercial 4.0 International (CC BY-NC 4.0)
license (https://creativecommons.org/licenses/by-nc/4.0/).
![Table 1. This table shows the failure distribution of power transformers for different voltage levels of 33, 66, 110 and 230kV during 5 years (2009-2013) [8]](https://thumb-us.123doks.com/thumbv2/123dok_us/20794.2002226/3.595.306.545.105.360/table-table-failure-distribution-transformers-different-voltage-levels.webp)