1
Throughout this study, USDA commodity programs refer to the provisions under the 1990 Farm Bill.
EFFECT OF USDA COMM ODITY PROGRAMS
ON ANNUAL PUMP AGE FROM THE EDW ARDS AQUIFER
Manzoor E. Chowdhury, Ronald D. Lacewell, and Bruce A. McCarl
Department of Agricultural Economics, Texas A&M UniversityINTRODUCTION
Irrigated agriculture is a major user of Edwards Aquifer water. According to the Texas Water Development Board's Survey of Irrigation in Texas, the total acres irrigated in 1994 in Uvalde, Medina, and Bexar Counties were 79,990 acres (Texas Water Development Board, 1995). About 45% of this irrigated acreage is in Uvalde and Medina counties. The survey also indicated that near 80% of the irrigated crop-lands in Uvalde and Medina counties use groundwater. Irrigated agriculture in the Edwards Aquifer region is highly diversified and includes vegetables, hay, sesame, soybeans, peanuts, cotton, corn, sorghum, wheat, and oats. The amount of water pumped for irrigation annually by agriculture ranges from 59 to 203 thousand acre feet (Moore and Votteler, 1995). Between the 1930's and the 1990's, the total water pumped from the aquifer increased by nearly 380% (USDA, TAMU, TSSWCB, 1996). On several occasions in recent years, the total annual water discharge from the aquifer by both pumping and natural spring flow has exceeded the annual recharge.
Because agriculture uses large quantities of water in the region, one issue that has recently received attention is the impact of USDA commodity programs on annual pumpage for irrigation in the Edwards aquifer area. Federal commodity programs - through provisions on land use, crop choice and production returns - alter incentives for agricultural production and irrigation water use. While commodity programs are generally designed with little regard to their effect on water demand, attention has focused on the implications of federal farm policy for resource use and quality (e.g., Just and Bockstael, 1990). As competition for existing water supplies intensifies, the benefits of efficient water use increase and an understanding of farm policy effects on water-use decisions becomes more critical. The purpose of this research is to investigate the effect of farm programs on annual pumpage for irrigation in the Edwards Aquifer area.1
A 1995 survey by the National Agricultural Statistical Service for the counties that include the Edwards Aquifer indicated that for 1994 some 42.4% of irrigated cropland participated in a USDA commodity program. Irrigated acres participating by crop included cotton at 74.3%, corn at 59.2%, sorghum at 58.1%, wheat at 54% and oats at 10.7%. The USDA commodity programs under the 1990 Farm Bill provided farmers with an opportunity for non-recourse loans if the market price is less than the program loan rate and a deficiency payment based on the difference in either the loan rate or market price (which ever is higher) and the target price for the proven yield of a particular crop and specific farmer. The participation in USDA commodity programs varies from year to year based on expected market prices, proven yield on a farm, acreage allotment and other factors.
MODELS AND PROCEDURES
2
The ICEMM simulation runs were provided by Dr. Carlos Fernandez of TAMU Agricultural Research and Extension Center at Uvalde and Dr. Juan Landivar of TAMU Agricultural Research and Extension Center at Corpus Christi.
ICEMM and EPIC Models
Previous economic models of agriculture in the Edwards were limited in that there was only one irrigation alternative. To overcome this, crop simulation models were applied to generate expected yields for alternative irrigation strategies for the three weather years (wet, dry, and normal). For all crops, the first simulation assumed no water stress and thus was used to establish maximum yield.
Alternative irrigation strategies were simulated for cotton using the cotton model (ICEMM-Integrated Crop and Economic Management Model).2
The strategies included irrigation at soil water potentials of -0.4 bar, -1.0 bar and
-3.0 bar. In addition, irrigation was scheduled at 10 day intervals. Development of a robust set of yields were included for each of the irrigation triggers above, irrigation being terminated at first open boll, three weeks after bloom and at early bloom. The simulations included alternative irrigation amounts of 1.5 and 3.0 inches. For this analysis, applications of 3.0 inches per irrigation were used to more accurately reflect furrow irrigation systems. It is acknowledged that sprinklers are being adopted and any analysis related to the future must include a trend for increasing adoption of sprinkler irrigation.Crop yields for corn, grain sorghum and wheat by alternative irrigation strategies were simulated by applying the EPIC (Erosion Productivity Impact Calculator) model. Again, the first simulation was an effort to maximize yield by allowing no water stress in any of the crops. Other irrigation strategies included a schedule approach every 10 days, a schedule approach every 7 days, application of postplant irrigation whenever soil moisture reached 67%, and application of postplant irrigation whenever soil moisture reached 33%. Alternative irrigation termination dates such as May 1 and June 1 were included. Each irrigation simulated assumed an application of 3.5 inches. As with cotton, the model was applied using the actual weather data of Medina County for a dry year (1989), a wet year (1992) and a normal year (1994).
Economic Optimization Model
To evaluate the expected effect of USDA commodity programs on level of pumping from the Edwards Aquifer, an economic model of irrigated agriculture was developed. The model has five farm program crops and thirteen non-farm program crops for which there are a number of irrigation strategies. Dryland alternatives are also included in the full model. The farm operator faces cropping pattern decisions and whether or not to participate in the commodity program not knowing what weather conditions will occur. Therefore, they make a decision considering the probability of a dry, wet or normal year (thus the use of probabilities of each of the weather years). The model was formulated in GAMS and solved for a price scenario (1992, 1993 or 1994) considering a dry, normal, or wet weather pattern. This means that the cropping pattern and participation in commodity program is constant across the alternative weather years. However, irrigation strategy, yield and economic implications do vary across the weather years.
Mathematically, the model establishes a cropping pattern and participation rate with program as follows: Max 3Ci k i miXi
+
3
Pk3
3
Rikm YikmSubject to:
3
Xi # Land- Xi +
3
Yikm # 0 Acreage Balancem
where:
i
=crop
C
i =production costs that do not vary by state of nature
Xi =
acreage
k
=state of nature
m
=irrigation strategy
Rikm =
returns to crop i under state of nature k when using irrigation strategy m
Yikm =acreage of crop i under state of nature k when using irrigation strategy m
Pk =probability of state of nature k
To put the solution into a crop mix, the following applies:
X
i-
3
AiqMq = 0q
where:
Mq =
acres grown using q crop mix
Aiq =
proportion of acreage devoted to crop i in cropping mix q
Another basic structural feature of the model involves crop mixes. The approach that is being used for the crop mixes was advocated by McCarl (1982). The basic theoretical justification being that if we are dealing with a region, there are rotations, resource availability and other considerations which lead to a regional solution not being individual crops but rather a mix of crops. This justification is further explained using a theoretical decomposition approach in publications by Onal and McCarl (1989, 1991). The basic action of the crop mix is that the acreage mix within the region is restricted to some convex combination of the mixes that are allowed. The mixes that are used in the model are historical mixes coupled with mixes taken from various farm survey sources including questions about what adjustments farmers would make. Justification for using historical mixes is demonstrated in an assessment of the economic effects of ozone on agriculture (Adams, Hamilton and McCarl). Basically, the argument is that the constraints implicit in farmers decisions are coded in the historical data. By using combinations of historical data we have implicitly taken into account all of those considerations.
program. However, if 2,000 acres were produced, up to 1,600 acres would be allowed to participate. This was not limited to a “base” maximum because farmers could build base if the farm program was in place long enough. Therefore, we did not deal with base acreage restrictions.
STUDY ASSUMPTIONS
Crop Prices, Deficiency Payment and Set Aside Requirements
The years of 1992, 1993 and 1994 were used to reflect a range in market prices of commodity crops, associated deficiency payments and acreage set-aside requirements. The deficiency payment is on a per unit of commodity basis. The deficiency payment represents a direct payment to a farmer and is based on the farm proven yield. Thus, if a farmer produces 140 bushels of corn per acre, but has a proven farm yield of 100 bushels per acre, that farmer receives the deficiency payment times 100 bushels. The deficiency payment was not linked to production. Set aside is acres of a commodity program crop's acreage that must be idled to be in compliance with the program. In addressing market prices for the commodities, the Texas average price for each year was taken from published statistics. However, for cotton, due to the overwhelming influence of High Plains cotton that is of a lower grade and staple length, it was decided to take the U.S. average price.
An alternative set of market prices for the five crops was provided by Dr. Joe Pena from local elevators and cotton gins (Pena, 1995a). These crop prices for 1992, 1993 and 1994 are as follows: cotton – 62¢, 65¢ and 68¢ per pound of lint, corn – $2.30, $2.30, and $2.50 per bushel, grain sorghum – $3.80, $3.65 and $3.65 per hundredweight, wheat – $3.48, $3.15 and $3.20 per bushel and oats – $1.75, $1.75 and $2.50 per bushel.
Weather Conditions
To indicate the impact of alternative weather conditions, three different years were selected. These were 1989 for a dry year, 1992 for a wet year and 1994 for a normal year. The years selected to represent different weather conditions were provided by NRCS, USDA of Temple, Texas. To apply the different weather years in an economic model, it was necessary to estimate the probability of each occurring. Mr. James Hailey of NRCS, USDA applied the Palmer Drought Severity Index values for the region for the period 1985 to 1995. Using this methodology, it was determined that 22% of the years were dry, 21% were wet and 57% were normal (Hailey, 1995).
Costs and Returns
The basis of establishing expected costs in the economic model was the Crop and Livestock Enterprise Budgets developed by Pena and applicable to the region (Pena, 1995b). Irrigated inputs and associated costs for each crop were fixed except for cost of irrigation and cost to harvest, haul, dry or other yield related expenses. Irrigation costs were set at $3.05 per acre-inch based on Pena’s budgets. Harvest related costs were put on a per unit of output basis to allow them to change with yield for the alternative irrigation strategies. Returns were calculated as price times yield for non-participating growers of commodity crops and as market price times yield plus the appropriate deficiency payment. Base Yield and Participation Limits
RESULTS
The economic model was applied under many assumptions of market price for crops, a maximum participation rate in USDA commodity programs, and pumping costs. The basic trend in all cases was the same, an increase in pumpage in the absence of the USDA commodity program. Included in the following discussion are implications of USDA commodity programs on total water pumped from the Edwards Aquifer, cropping patterns, net income, output of alternative crops, water use per acre by crop and summary of costs and returns for every irrigation strategy, crop price scenario, weather year and participating and non-participating acres.
Total Irrigation Water Pumped
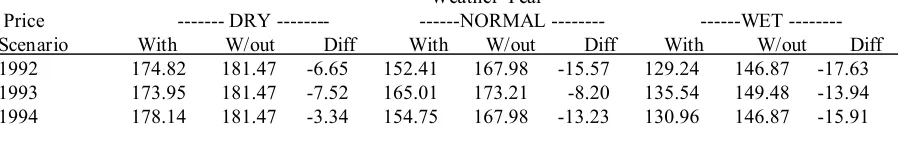
Table 1 indicates the implications on water pumped, with and without the USDA commodity program for the three crop price scenarios and weather years. For the dry year, water pumped with the USDA commodity program across price scenarios ranges from 175 thousand to 178 thousand acre feet compared to 181 thousand acre feet if there is not a USDA commodity program (an increase of 3 thousand to over 7 thousand acre feet). The normal year expected pumping rate is less than a dry year, but the difference in pumping without a USDA commodity program is much higher (an increase of 8 thousand to 15 thousand acre feet compared to with a commodity program). The wet year suggests that pumping with the USDA program is around 130 thousand acre feet compared to the mid 140 thousand acre feet range without a USDA commodity program (14 thousand to 17 thousand acre feet more without the program). Table 1. Effect of weather year, price scenario and availability of USDA commodity
program on regional water use in 1000 acre feet
Weather Year
Price --- DRY ---NORMAL ---WET ---Scenario With W/out Diff With W/out Diff With W/out Diff 1992 174.82 181.47 -6.65 152.41 167.98 -15.57 129.24 146.87 -17.63 1993 173.95 181.47 -7.52 165.01 173.21 -8.20 135.54 149.48 -13.94 1994 178.14 181.47 -3.34 154.75 167.98 -13.23 130.96 146.87 -15.91
Cropping Pattern
Economic Returns, Production and Water Use
Since there are three price scenarios (1992, 1993 and 1994) along with three weather patterns (dry, wet and normal year), there are nine solutions reflecting expected effect of USDA commodity programs on gross and net income for the region, income per irrigated acre, income per acre foot of water pumped, production of program crops and water pumped.
Effect of Weather: Weather patterns had a much greater effect on pumping and economics than the three alternative price scenarios. Typically, gross income, net income, and income per acre foot of water pumped declined from the wet year to the dry year and was higher with the program as compared to no USDA commodity program. This was with increasing pumping as the weather pattern was drier. Government payments for participants of the commodity program increased only slightly going from the dry to the wet year, ranging in the $1.4 million to $2.3 million bracket. Gross income under irrigation for the region declined from $4 to $6 million without the commodity program (15% to 20% decline). Net income declined without the commodity program from less than $1 million to over $2.7 million (about 7% to 21% reduction).
Effect of Price Scenario: In reviewing the implications across the three price, deficiency payment and set-aside scenarios, the per acre shadow price for land (measure of returns to land) ranges from $134 to $149 per acre with the commodity program and from $105 to $133 without a commodity program (reduction of $12 to $28 per acre without a commodity program). The reduction in net income in the absence of a commodity program for a dry year ranges from $1.4 million to $2.8 million over the price scenarios. For a normal year the range is $0.8 million to $2.3 million and for a wet year the range is from $1.3 million to $2.7 million. Thus, market prices are important and significantly affect expected net returns.
The overall implication is that the USDA commodity program contributes to gross income and net income of irrigation farmers. The government payments (deficiency payments) were estimated to be $1.4 to $3.3 million for irrigated crops, highest with 1992 prices and least for 1994 prices. Concentrating on the dry year results, pumping without the USDA commodity program was estimated to increase between 1.8% and 4.3% (or about 3 thousand to 7.5 thousand acre feet per year). Production of commodity crops without the USDA commodity program declined for wheat, cotton and sorghum and increased for oats and corn. Non program crops such as vegetables and hay also increased in acreage. Crops and Water Use
With the general implications of effects of the USDA commodity program, background is needed to illustrate details of changes. The primary result is that under a weather year, one irrigation strategy for a crop is dominant regardless of the USDA commodity program. The only shift due to the absence of the USDA commodity program is some changes in acres of each crop. Typically, with increased rainfall, the level of irrigation is less for a crop. For the vegetables and hay, it was assumed that they must receive a full irrigation, hence there is no change in water use levels across years. It is possible that in high rainfall years, these crops would receive a reduced level of irrigation per acre.
In the cropping pattern shifts due to no USDA commodity program, a reduction in acres of cotton, sorghum and wheat are replaced with vegetables and hay that in several cases use more water per acre. When this is aggregated over the study area, the total water pumped was estimated to increase without the commodity program for all price and weather scenarios.
Crop Enterprise Characteristics
lower than for a normal or wet year for all crops except cotton. There are cases where a crop in a dry year has a negative net return. However, the producer selects a cropping pattern based on the overall outlook considering probability of a dry, normal or wet year. Once committed to a cropping pattern, the goal may be to minimize losses. CONCLUSIONS
Application of an economic model for irrigated agriculture in the Edwards Aquifer region suggests that the USDA commodity programs have provided an economic incentive to plant crops that use less water when compared to analysis for a no program alternative. In the absence of commodity programs, irrigators in the Edwards Aquifer area will irrigate less acres of grain sorghum, cotton and wheat, and irrigate more acres of vegetables and hay (which tend to use more water per acre) and more acres of oats and corn. The requirement of a set-aside program or non-cropping of land to be in compliance with the USDA commodity programs further reduces land irrigated. The combined effect will result in more water pumped for irrigation without USDA commodity programs than with these programs regardless of dry, normal or wet weather year conditions.
For alternative assumptions regarding market prices of commodities and pumping costs, pumping rates increased when the USDA commodity program was assumed not available, compared to the option of participating in the program. There were cases where the difference was relatively small. Thus, from this analysis, it is concluded that the USDA commodity program does not cause an increase in pumping from the Edwards Aquifer, even in dry years. This analysis suggests that farmers have adopted a particular cropping pattern and irrigation strategy whether participating in the USDA commodity program or not. Given the reduction in target price levels in recent years and an increasing market price, the influence of USDA commodity programs on farmer decisions seems to have waned in this region. Similar result can be expected from the 1996 farm bill where production decisions will be driven by market forces since farm payments are decoupled from planting of commodity crops.
REFERENCES:
Adams, R.M., S.A. Hamilton and B.A. McCarl. “An Assessment of the Economic Effects of Ozone on U.S. Agriculture.” Journal of the Air Pollution Control Association 33(1985): 938-943.
Anderson, Carl. “Texas Agricultural Cash Receipts and Price Statistics,” Texas Agricultural Extension Service, Department of Agricultural Economics, College Station, TX.
Boisvert, R.N. and B.A. McCarl. “Agricultural Risk Modeling Using Mathematical Programming.” Regional Research Bulletin No. 356, Southern Cooperative Series, 1990.
Davis, Darrel. Personal correspondence. July 1995.
Fernandez, Carlos and Juan Landivar. Personal correspondence to Ron Lacewell and Bruce McCarl providing cotton yields, August 1, 1995.
Hailey, James. Personal correspondence. August 1995.
Joint Committee on the Edwards Aquifer. “Technical Factors in Edwards Aquifer Use and Management.” A Joint Committee of the Texas Senate and House of Representatives, Senator Krier and Representative Smith, Co-chairmen, published by Bureau of Economic Geology, The University of Texas at Austin, 1990 Just, R. E., and N. Bockstael. Commodity and Resource Policy in Agricultural Systems. Springer-Verlag; Berlin,
New York, 1991.
McCarl, B.A. and G.H. Parandvash. “Irrigation Development versus Hydroelectric Generation: Can Interruptible Irrigation Play a Role?” Western Journal of Agricultural Economics 13(1988): 267-276.
McCarl, B.A. “Cropping Activities in Agricultural Sector Models: A Methodological Proposal” American Journal of Agricultural Economics 64(1982): 768-772.
Moore, Joe G., Jr. and Todd H. Votteler. “Revised Emergency Withdrawal Plans for the Edwards Aquifer.” The U.S. District Court, Western District of Texas, Midland-Odessa Division, The Honorable Lucius Bunton, Presiding, March 31, 1995. Taken from U.S. Geological Survey, July 12, 1994.
Onal, H. and B.A. McCarl. “Exact Aggregation in Mathematical Programming Sector Models.” Canadian Journal of Agricultural Economics 39(1991): 319-334.
Onal, H. and B.A. McCarl. “Aggregation or Heterogeneous Firms in Mathematical Programming Models.”
European Journal of Agricultural Economics 16-4(1989):499-513.
Pena, Joe. “Crop and Livestock Enterprise Budgets for Southwest Texas District, Projected for 1995, 1995.” Texas Agricultural Extension Service B-1241(C10), 1995b.
Pena, Joe. “Local Market Prices for 1992-95.” Cotton prices from Cany Valley, Inc. and other prices from Chapman Feed, Seed and Grain Company, Hondo, Texas 1995a.
Texas Agricultural Statistics Service. “Texas Agricultural Facts, Annual Summary.” U.S.D.A., SM-04-95, Dennis S. Findley, State Statistician, February 24, 1995.
Texas Water Development Board. Surveys of Irrigation in Texas - 1958, 1964, 1969, 1974, 1979, 1984, 1989, 1991, and 1994. Unpublished, 1995.
USDA-Natural Resources Conservation Service, Agriculture Program of the Texas A&M University System, and Texas State Soil and Water Conservation Board. "Water Supply and Use Management for the Edwards Aquifer-Cooperative Solutions to Promote Sustainability." February 1996.
Ziari, H.A. and B.A. McCarl. “A Nonlinear Mixed Integer Program Model for Evaluating Runoff Impoundments for Supplemental Irrigation.” 31(1995): 1585-1594.
Manzoor E. Chowdhury received a Ph.D. in Agricultural Economics from Texas A&M University and is currently a Research Scientist at Texas A&M University. His primary research areas are agricultural nonpoint-source pollution and water resource management issues. Dr. Chowdhury is one of the recipients of 1996 Universities Council on Water Resources Dissertation Award.
Ronald D. Lacewell received a B.S. and M.S. degree from Texas Tech University and Ph.D. degree from Oklahoma State University, all in Agricultural Economics. He has taught and done research at Texas A&M since 1970 and is currently Assistant Vice Chancellor, Agriculture and Life Sciences and Associate Director, Texas Agricultural Experiment Station as well as Professor, Department of Agricultural Economics. Research has included water resources, institutions, new crops, energy, environmental issues and integrated pest management. He has authored over 100 peer reviewed journal articles and dozens of bulletins, book chapters and papers for professional associations on these topics.