4(4): 392-403, 2014 SCIENCEDOMAINinternational
www.sciencedomain.org
Identifying Food Consumption Patterns among
Young Consumers by Unsupervised and
Supervised Multivariate Data Analysis
Ulf Hammerling
1*, Eva Freyhult
2, Anna Edberg
1,3, Salomon Sand
4,
Sisse Fagt
5, Vibeke Kildegaard Knudsen
5, Lene Frost Andersen
6,
Anna Karin Lindroos
4, Daniel Soeria-Atmadja
1,7and Mats G. Gustafsson
11Cancer Pharmacology and Computational Medicine, Department of Medical Sciences,
Uppsala University, Uppsala Academic Hospital, SE-75185 Uppsala, Sweden.
2Cancer Pharmacology and Computational Medicine, Department of Medical Sciences,
Bioinformatics Infrastructure for Life Sciences, Science for Life Laboratory, Uppsala University, SE-75185 Uppsala, Sweden.
3Råd and Rön, P.O. Box 38001, SE-10064 Stockholm, Sweden. 4National Food Agency, SE-75126 Uppsala, Sweden. 5Department of Nutrition, National Food Institute, Technical University of Denmark, DK-2860
Søborg, Denmark.
6Department of Nutrition, University of Oslo, NO-0316, Norway. 7Reveal, P.O. Box 22500, SE-10422 Stockholm, Sweden.
Author’s contributions
This work was carried out in collaboration between all authors. Authors UH, DSA and MGG designed the study. Authors AE, EF and DSA conducted the multivariate data analyses. Authors UH, AE, DSA, EF and MGG wrote the paper. Authors SS, SF, VKK, LFA and AKL suggested study refinements and reviewed manuscript drafts. All authors read and approved the final manuscript.
ABSTRACT
Although computational multivariate data analysis (MDA) already has been employed in the dietary survey area, the results reported are based mainly on classical exploratory (descriptive) techniques. Therefore, data of a Swedish and a Danish dietary survey on young consumers (4 to 5 years of age) were subjected not only to modern exploratory MDA, but also modern predictive MDA that via supervised learning yielded predictive classification models. The exploratory part, also encompassing Swedish 8 or 11-year old Swedish consumers, included new innovative forms of hierarchical clustering and bi-clustering. This resulted in several interesting multi-dimensional dietary patterns (dietary prototypes), including striking difference between those of the age-matched Danish and Swedish children. The predictive MDA disclosed additional multi-dimensional food consumption relationships. For instance, the consumption patterns associated with each of several key foods like bread, milk, potato and sweetened beverages, were found to differ markedly between the Danish and Swedish consumers. In conclusion, the joint application of modern descriptive and predictive MDA to dietary surveys may enable new levels of diet quality evaluation and perhaps also prototype-based toxicology risk assessment.
Keywords: Dietary surveys; young consumers; unsupervised MDA; supervised MDA; dietary prototypes; dietary patterns.
1. INTRODUCTION
subsequently used for regression analysis [10,11]. By means of LCA dietary prototypes have been identified in cohorts of modest and large sizes [12,13].
The above-mentioned MDA techniques are, however, all confined to the descriptive modelling category of data analysis, also known as unsupervised multivariate analysis. Although this sort of modelling is indeed helpful to the disentanglement of embedded associations within dietary surveys, the class of MDA techniques known as predictive modelling can enable the unveiling of even deeper entrenched patterns in multi-dimensional data sets [14-16]. Prediction models based on supervised learning are built on observed examples that include a response variable, which may incorporate either a discrete or a continuous value. Some well established examples of such algorithmic families are Artificial Neural Networks (ANN) [17], Decisions Trees (DT) [18,19], Random Forests (RF) [20,21] and Nearest Shrunken Centroids (NSC) [22-25]. Using ANNs and Decision Trees, Hearty and Gibney modelled an Irish food consumption survey to predict each individual’s Health Eating Index, in anyone of five separate categories, with reasonably high accuracy [26]. Nutritional epidemiology, however, let alone dietary surveys, rarely employs predictive modelling.
With a view to this overall background, we applied modern and novel innovative MDA methods to disclose pertinent dietary patterns in data on pre-adolescent consumers and compared them between two countries. Therefore, data used in this study were compiled from two national food consumption surveys of young consumers, one in Sweden and the other in Denmark. The former data set incorporated three age classes, one preschool and two elementary school children, whereas the latter included preschool children only. The material was subjected to various statistical techniques, including two sorts of cluster (unsupervised) analysis as well as two varieties of supervised analysis, RF and NSC, but only results of the latter supervised technique are shown in the present paper. Recently, this work - financed by the Nordic Council of Ministers, Nordic Working Group for Diet, Food and Toxicology (NKMT) - appeared in the form of a TemaNord report [27]. Below, pertinent findings of this study are outlined.
2. DATA SETS AND METHODOLOGY
2.1 Data Sets
The analyses were based on two dietary survey data sets collected in Denmark and Sweden: (i) A fraction of data encapsulating preschool consumers (children of 4-5 years of age, in total 318 subjects), compiled in 2000 through 2008 of the Danish National Survey of Diet and Physical Activity, an ongoing project at the National Food Institute, Technical University of Denmark. (ii) Data collected in Riksmaten - barn 2003, which is an open and estimated food diary across four consecutive days, conducted by the (Swedish) National Food Agency. It encapsulates 2496 children of three age classes: 4, 8 and 11 years of age, with 590 individuals of preschool (4 years) age [28].
2.2 Assignment of Foods into Groups
categories. Mean intakes of each food group were input variables to the various MDA settings. Below, accordingly defined food groups appear in italic font.
2.3 Data Pre-processing
Intake levels were consistently expressed as weight percent, i.e. the consumption of each food group was divided by the total intake of all food groups. Certain analyses were preceded by an additional normalisation-type transformation, either Z-score normalisation (all food group values will have zero mean and unit variance) or by dividing each food group value with its arithmetic mean value.
2.4 MDA
Descriptive/exploratory modelling (unsupervised MDA) and predictive modelling (supervised MDA) were applied to the data sets. A significant part of the descriptive analyses was conducted using a top-down multi-branching hierarchical clustering algorithm developed in-house (OMB-DHC) [29,30]. Each accordingly identified major cluster was represented by its centroid (average), which subsequently was visualized together all the others using bi-clustering (yielding a “heatmap”) and multi-dimenstional Scaling [31]. Finally, the Danish and Swedish age-matched data sets (the original data and not the prototypes) were each subjected to variable selection and training of the Nearest Shrunken Centroid (NSC) classifier, thereby enabling multivariate pattern recognition. The classifiers were built to discriminate between low (below the 20th percentile) and high (above the 80th percentile) consumers of each food category studied, based on their dietary patterns (excluding the food category considered). The MDA was performed in a repeated holdout procedure using 80% of the data to train the model and the remaining 20% to test model performance. The holdout procedure was repeated 100 times and an average performance over all repeats was computed. The NSC modelling included a variable selection step, which yielded counts of how many times each variable (food type) was selected. Null distribution for performance measures and variable selection counts (for each variable) was determined by means of 200 permutations.
2.5 Computational Environments
Data pre-processing and unsupervised MDA were conducted in the Matlab development suite (Mathworks, Inc, Natick, USA), whereas the supervised MDA analysis was conducted in R [32]. The NSC algorithm used was available in the R packagepamr[22].
3. RESULTS AND DISCUSSION
3.1 Descriptive Modelling by Means of Cluster Analysis
outstanding food groups, showed some mutual resemblance: Milk and Soft beverages (sweetened)/Buns & cakes in the Swedish data set, on the one hand, and Milk and Soft beverages (sweetened)/Juice among the Danish children, on the other. Nonetheless, subsequent (hierarchical) bi-clustering of the accordingly derived dietary prototypes revealed a striking discrepancy between age-matched Danish and Swedish children's consumption patterns. The resulting “heatmap” discloses an approximately inverse relationship between the two countries (Fig. 1). Another downstream multidimensional analysis of the prototypes unveiled an appreciable data distribution within each national population, but showed nonetheless much larger distance across the nations (Appendix Fig. 2).
Fig. 1. A second level exploratory MDA using 8 dietary prototype profiles obtained in a previous clustering analysis (OMB-DHC) step. Four prototypes were obtained from
Swedish and four from Danish age-matched preschool consumer data. The panel displays results from a conventional bi-clustering procedure. Colours indicate high (red),
intermediate (black) or low (green) consumption levels. The panel was reproduced with permit from the Nordic Council of Ministers
A multidimensional scaling analysis of dietary prototypes, as derived from the entire Swedish data set, identified one divergent prototype in each of the two older age groups (8 and 11 years old consumers, respectively). The two outstanding prototypes, each encapsulating about 20 % of the respective elementary school age population, exhibit obvious mutual similarity and feature low-fat foods - largely with respect to dairy products - and otherwise generally prudent eating profiles. Moreover, each of the Swedish age group housed another and fairly well defined dietary prototype. These prototypes (encompassing 20 % of preschool children and nearly 25 % among each age-class of elementary school consumers in the data set) featured relatively low intake of VegetablesandFruit and berriesas well as rather high consumption of sugar-sweetened soft drinks. A dietetic prototype of the latter was identified also in the Danish data material (representing about 27 % of the children in the national data set), but devoid of association with low consumption ofVegetablesorFruit and berries
(not shown).
3.2 Predictive Modelling Using Classifiers
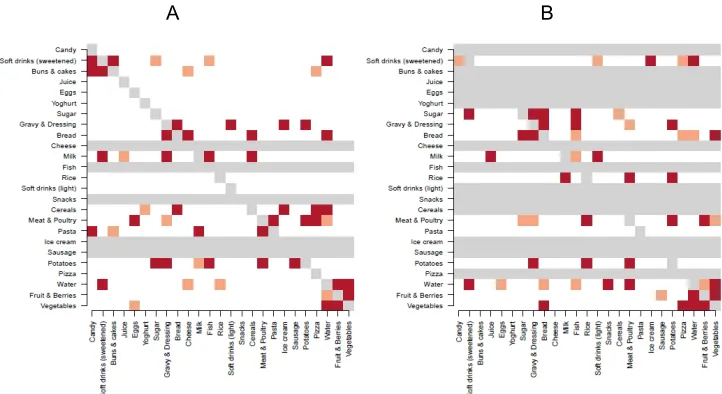
based on NSC classification, using low and high consumers (i.e. the 20% fractions of subjects with lowest and highest consumption) for each food category in the absence of the particular food. For example, a Bread classification model was built to classify High/Low consumers of Bread, based on the consumption pattern across the remaining foods. This procedure was conducted to unveil associations with the respective foods, not readily disclosed by any exploratory methodology. Models were also built in a similar fashion by means of RF, providing results that concurred with those derived from NSC analyses (data not shown). NSC was used in a repeated holdout setting and permutations were conducted to assess results quality [27]. The eating behaviour attached to several food groups showed marked disparity across the national border (Fig. 2). A few observations from the NSC-modelling exercises are as follows: Models for Potato depend heavily onRice and Meat & chickenamong Danish children, but are rather linked to Sausageand Fishin Sweden. The Danish Bread models depend strongly on the consumption of Sugar (i.e. marmalade) and
Vegetables, whereas the Swedish Bread models depend mainly on Cheese, Spreads & Dressing and Cereals for consumers of this age group (Fig. 3). Moreover, predictive classification of Milk showed associations with (fruit) Juice and Soft beverages (without sugar) among the Danish children, but were rather associated withCereals, Fish and Soft beverages (sweetened) in the Swedish data set. Large cross-national difference in terms of food group associations withMeat & chickenwas also observed (not shown).
A B
Fig. 2. Significant variables identified using NSC predictive modelling of the Swedish (A) and Danish (B) dietary survey data sets on preschool children. The NSC technique
applied here attempts, irrespectively of the targeted food (one in each model), to reliably classify the respective (low/high consumption) populations. Thus, each model
was built to predict class Y based on consumption pattern of the remaining food groups X. Notably, NSC performs simultaneous variable selection and model construction. For each food group data was partitioned in training (80 %) and test (20 %) sets. The entire sequence of model-building, followed by testing, was iterated 100 times, ultimately generating a selection frequency of each variable, as appearing in
panels A or B, above. Colour-coded squares indicate significance at either of two separate levels (dark red: 0.99 level; light red: 0.95 level; white: non-significant), whereas consistent non-significant models appear as grey bars. Panels reproduced
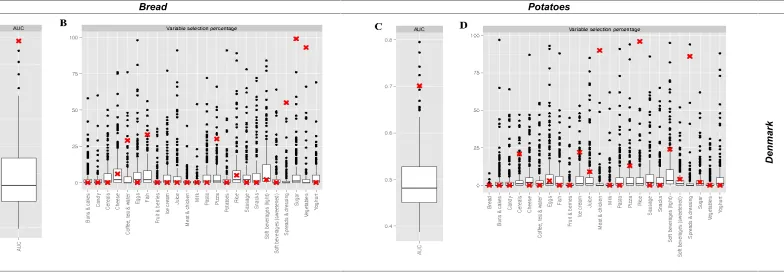
Bread Potatoes
D
en
m
ar
k
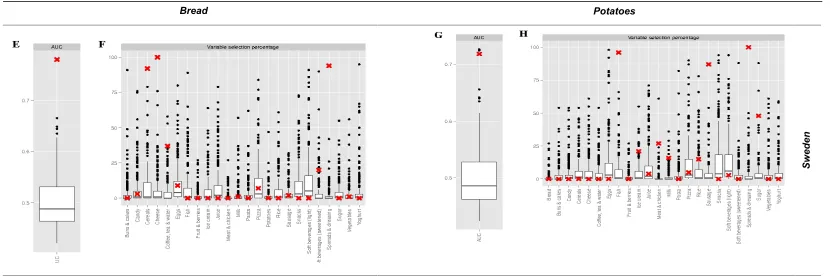
Sw
ed
en
Fig. 3. Graphical display of results derived from Nearest Shrunken Centroid (NSC) modelling for each of two selected pairs of Danish-Swedish consumption patterns, as attached to either of the Bread or Potato food groups. Performance is expressed as AUC (A, C, E, G) and variable selection frequency appears as percent (B, D, F, H), for Danish and Swedish Bread (A, B and E, F, respectively) as well as Danish and Swedish Potato (C, D and G, H, respectively) models. Null distribution, as determined by 200 permutations, is shown as a boxplot for each AUC and variable (food group). The original (un-permuted) model results are indicated by red X marks. Panels A, C, E, and G show that the performance estimates of the four displayed models are significantly higher than expected by chance (at the 0.05 significance level). Panel B clearly shows that Sugar, and Vegetables are the most important variables in the Danish Bread model, whereas panel F shows that Cereals, Cheese and Spreads & dressing are
most essential to the Swedish Bread model. As for the Potato models, panel D highlights Meat & chicken and Rice as most important to the Danish Potato model, whereas panel H indicate that Fish, Sausage and Spreads & dressing are fundamental to the Swedish Potato model
4. CONCLUSION
Embedded multi-dimensional dietary patterns in data from two Nordic dietary surveys of young consumers have been disclosed through joint application of modern descriptive and predictive MDA modelling [27]. The descriptive modelling involved cluster analysis and multi-dimensional scaling, which were used to identify interesting consumer prototypes in the dietary data sets. More intricate patterns were unveiled through a second round of exploratory data analysis based on the consumer prototypes identified in the first step.
In the current analysis, two well-known algorithms for supervised MDA (random forest and nearest shrunken centroid) were employed to identify eating preferences tied to each of a panel of food groups. Several such dietary associations were found to be strikingly dissimilar between Danish and Swedish young consumers. For instance,Potato,Bread,MilkandMeat and poultry emerged as connected to quite distinct food groups among the respective national preschool consumers, as disclosed by supervised data interrogation [27].
Outstanding observations made in this study include: i) Two prudent and mutually similar dietary prototypes, located remotely from all counterparts in each age group, appeared among elementary school children in the Swedish material. ii) Seemingly, Danish and Swedish children (4-5 years) consumption patterns are strikingly different, in part owing to many individual foods being linked to different eating habits and iii) dietary prototypes with significant elements of Soft beverages (sweetened) appeared in the Danish data on preschool children and in each age class of the Swedish material.
Findings summarized in the present paper, outlined in more detail in a recently published TemaNord report, show that the joint application of clustering techniques and supervised (machine) learning techniques provide a promising framework for deepened understanding of intricate eating habit patterns [27]. Rather than relying solely on assessments based mainly on independent uni-variate distributions, reflecting the consumption of particular food categories across the whole population (e.g., WHO/IPCS, 2009) [33], the consumer prototypes (and/or associated multivariate correlation patterns) should also be taken into account. A consumer prototype view, which allows for e.g. prototype specific exposure assessment, seemingly enables more adequate analysis of the explicit impact of differences in diet on the intake of nutritional or hazardous substances, thus potentially allowing for more accurate delineation of potential risk groups. Lastly, predictive modelling enables exhaustive characterisation of eating habits, thereby providing a powerful technique in dietary pattern analysis.
ACKNOWLEDGEMENTS
The study was funded by the Nordic Council of Ministers, Nordic Working Group for Diet, Food and Toxicology (NKMT).
COMPETING INTERESTS
REFERENCES
1. EFSA. General principles for the collection of national food consumption data in the view of a pan-European dietary survey. The EFSA Journal. 2009;7(12):1435.
2. Newby PK, Tucker KL. Empirically derived eating patterns using factor or cluster analysis: A review. Nutr Rev. 2004;62(5):177-203.
3. Moeller SM, Reedy J, Millen AE, Dixon LB, Newby PK, Tucker KL, et al. Dietary patterns: challenges and opportunities in dietary patterns research an Experimental Biology workshop, April 1, 2006. J Am Diet Assoc. 2007;107(7):1233-9.
4. Reedy J, Wirfalt E, Flood A, Mitrou PN, Krebs-Smith SM, Kipnis V, et al. Comparing 3 dietary pattern methods-cluster analysis, factor analysis and index analysis--With colorectal cancer risk: The NIH-AARP Diet and Health Study. Am J Epidemiol. 2010;171(4):479-87.
5. Tucker KL. Dietary patterns, approaches and multicultural perspective. Appl Physiol Nutr Metab. 2010;35(2):211-8.
6. Pryer JA, Rogers S. Dietary patterns among a national sample of british children aged 1 1/2-4 1/2 years. Public Health Nutr. 2009;12(7):957-66.
7. Smith AD, Emmett PM, Newby PK, Northstone K. A comparison of dietary patterns derived by cluster and principal components analysis in a UK cohort of children. Eur J Clin Nutr. 2011;65(10):1102-9.
8. Grieger JA, Scott J, Cobiac L. Cluster analysis and food group consumption in a national sample of Australian girls. J Hum Nutr Diet. 2012;25(1):75-86.
9. Fahey MT, Ferrari P, Slimani N, Vermunt JK, White IR, Hoffmann K, et al. Identifying dietary patterns using a normal mixture model: Application to the EPIC study. J Epidemiol Community Health. 2012;66(1):89-94.
10. Patterson BH, Dayton CM, Graubard BI. Latent class analysis of complex sample survey data: Application to dietary data. J Am Stat Assoc. 2002;97(459):721-9.
11. Vermunt JK, Magidson J. Latent class models for classification. Comput Stat & Data Anal. 2003;41:531-7.
12. Padmadas SS, Dias JG, Willekens FJ. Disentangling women's responses on complex dietary intake patterns from an Indian cross-sectional survey: A latent class analysis. Public Health Nutr. 2006;9(2):204-11.
13. Sotres-Alvarez D, Herring AH, Siega-Riz AM. Latent class analysis is useful to classify pregnant women into dietary patterns. J Nutr. 2010;140(12):2253-9.
14. Soeria-Atmadja D, Lundell T, Gustafsson MG, Hammerling U. Computational detection of allergenic proteins attains a new level of accuracy with in silico variable-length peptide extraction and machine learning. Nucleic Acids Res. 2006;34(13):3779-93.
15. Andersson CR, Gustafsson MG, Strombergsson H. Quantitative chemogenomics: machine-learning models of protein-ligand interaction. Curr Top Med Chem. 2011;11(15):1978-93.
16. McGuire MF, Iyengar MS, Mercer DW. Computational approaches for translational clinical research in disease progression. J Investig Med. 2011;59(6):893-903.
17. Zou J, Han Y, So SS. Overview of artificial neural networks. Methods Mol Biol. 2008;458:15-23.
18. Hammann F, Drewe J. Decision tree models for data mining in hit discovery. Expert Opin Drug Discov. 2012;7(4):341-52.
19. Stiglic G, Kocbek S, Pernek I, Kokol P. Comprehensive decision tree models in bioinformatics. PLoS One. 2012;7(3):33812.
21. Chen X, Ishwaran H. Random forests for genomic data analysis. Genomics. 2012;99(6):323-9.
22. Tibshirani R, Hastie T, Narasimhan B, Chu G. Diagnosis of multiple cancer types by shrunken centroids of gene expression. Proc Natl Acad Sci USA. 2002;99(10):6567-72.
23. Geurts P, Irrthum A, Wehenkel L. Supervised learning with decision tree-based methods in computational and systems biology. Mol Biosyst. 2009;5(12):1593-605. 24. Suarez-Farinas M, Shah KR, Haider AS, Krueger JG, Lowes MA. Personalized
medicine in psoriasis: Developing a genomic classifier to predict histological response to alefacept. BMC Dermatol. 2010;10:1.
25. Christin C, Hoefsloot HC, Smilde AK, Hoekman B, Suits F, Bischoff R, et al. A critical assessment of feature selection methods for biomarker discovery in clinical proteomics. Mol Cell Proteomics. 2013;12(1):263-76.
26. Hearty AP, Gibney MJ. Analysis of meal patterns with the use of supervised data mining techniques-artificial neural networks and decision trees. Am J Clin Nutr. 2008;88(6):1632-42.
27. Edberg A, Freyhult E, Sand S, Fagt S, Kildegaard-Knudsen V, Frost Andersen L, et al. Discovery and characterisation of dietary patterns in two Nordic countries. Using non-supervised and non-supervised multivariate statistical techniques to analyse dietary survey data. Copenhagen: Nordic Council of Ministers. 2013;548.
28. Enghardt Barbieri H, Pearson M, Becker W. Riksmaten - barn 2003. Livsmedels- och näringsintag bland barn i Sverige. Uppsala: Livsmedelsverket; 2006.
29. Soeria-Atmadja D, Onell A, Borga A. IgE sensitization to fungi mirrors fungal phylogenetic systematics. J Allergy Clin Immunol. 2010;125(6):1379-86e1.
30. Maddah F, Soeria-Atmadja D, Malm P, Gustafsson MG, Hammerling U. Interrogating health-related public databases from a food toxicology perspective: Computational analysis of scoring data. Food Chem Toxicol. 2011;49(11):2830-40.
31. Hastie T, Tibshirani R, Friedman J. The Elements of Statistical Learning: Data Mining, Inference and Prediction. New York: Springer-Verlag; 2001.
32. R. R Development Core Team. R: A language and environment for statistical computing. R Foundation for Statistical computing. Vienna; 2012.
Available from: http://www.R-project.org/.
APPENDIX
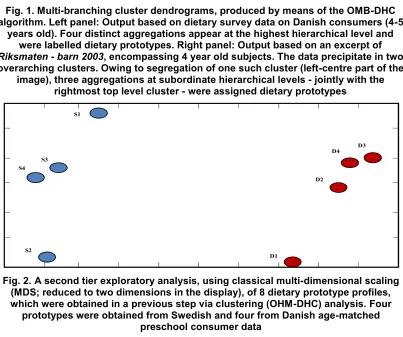
Fig. 1. Multi-branching cluster dendrograms, produced by means of the OMB-DHC algorithm. Left panel: Output based on dietary survey data on Danish consumers (4-5
years old). Four distinct aggregations appear at the highest hierarchical level and were labelled dietary prototypes. Right panel: Output based on an excerpt of Riksmaten - barn 2003, encompassing 4 year old subjects. The data precipitate in two overarching clusters. Owing to segregation of one such cluster (left-centre part of the
image), three aggregations at subordinate hierarchical levels - jointly with the rightmost top level cluster - were assigned dietary prototypes
Fig. 2. A second tier exploratory analysis, using classical multi-dimensional scaling (MDS; reduced to two dimensions in the display), of 8 dietary prototype profiles, which were obtained in a previous step via clustering (OHM-DHC) analysis. Four
prototypes were obtained from Swedish and four from Danish age-matched preschool consumer data
_________________________________________________________________________
© 2014 Hammerling et al.; This is an Open Access article distributed under the terms of the Creative Commons
Attribution License (http://creativecommons.org/licenses/by/3.0), which permits unrestricted use, distribution, and
reproduction in any medium, provided the original work is properly cited.
2H16262H14512H15902H15432H11172H12422H15482H13532H11012H14682H16222H13072H16042H13542H16782H12412H15752H14582H11792H17042H15122H15102H15402H15802H15192H16252H16732H16852H12722H13042H15362H15862H15992H17202H12912H13572H15412H15812H16312H16702H12552H16912H14742H14622H17182H15322H15452H11152H12402H16772H14772H16052H16062H15382H16072H11752H12762H13172H15792H13082H11042H13602H11772H13062H14482H12372H12512H15222H14542H14692H13152H14452H16182H12712H17262H14662H16212H10562H16632H17132H17242H14502H16722H16202H16792H15872H16102H16802H12952H16812H15132H16352H15442H16362H15392H17172H12892H17252H16712H15962H14602H10492H12732H15292H16602H16282H16612H15842H12942H17302H17312H17122H17372H15152H16652H13562H17322H17332H14632H16942H12812H13492H16642H14802H16272H16742H16112H14702H14672H16342H13022H17272H14552H16232H10462H15972H11092H12432H12852H13112H13142H14642H15252H12362H17162H13122H16892H11062H11702H15922H15052H16142H16982H11692H17002H14652H11722H14472H10422H11652H11052H15082H15952H12772H10652H11032H10622H13512H15332H11782H14562H11082H15772H17352H15472H16082H11132H15302H12352H16672H16682H12822H12452H12592H16322H16662H17362H10602H13162H15742H13012H13502H12802H10642H13522H11612H13002H12752H13132H13052H16242H15492H16862H10442H16762H11022H12562H12742H14762H17142H13092H16972H15782H16032H15202H16692H12572H10472H10542H15212H10612H14522H11162H11662H12582H13592H15242H11182H15272H10632H12652H16302H12902H15372H14592H13582H16092H11742H17152H13182H12982H16832H17032H12392H12522H10482H12782H10502H14712H16752H14532H15142H11672H12442H16962H10522H12502H14732H12492H15422H11142H11112H17082H12932H14782H16922H12532H16332H16132H15832H10572H14792H12972H14462H15172H17072H15852H15882H11682H16372H16932H13102H13552H14492H15342H12662H13032H11122H15112H15312H16822H10592H16992H15932H10512H14812H16842H11622H11762H10452H17232H16872H12632H12842H11632H11072H14752H12542H16902H15162H10582H15912H12962H12472H14722H12922H12792H1612 0 0.02 0.04 0.06 0.08 0.1 0.12 0.14 0.16 -1 -0.8 -0.6 -0.4 -0.2 0 0.2 0.4 0.6 0.8 1
4H3324V1164H3584H7174V1614V0024H2454H3934H5664V1664V1854H1334H2074H1834H1064H5374H1324V2104H1104H2044H5384H1914H2754V2264H1844H4964V0544H1504H2094H2284V0644H1034H2084H5684V2004H1344V1224H0344V1174V0704V1334H1854H3364H0284H2904V0094H4794H5004H1524H3234H3064H4834H1184H2444H0564H2724H1624H0864H2134H4564V0654H3394H1514H5714H2304H2434H7014H3164V0924H2804H5044H0064H0044H4804H7404H2614H5074H0924H0984H5124H0274H2744H5144H3004V1974V1754H0244H0694V1524H5034H1864H1154V1124H2784H3094H0164V1934H0184H7434H1354H3464H7234V0624V1284V0564H2344H5284V0154H1174H0644V2234V1194H3954H4144H1074H7244H1384H2874H7304H1144H4214H4704H2914H0554H1734H0394H4654H1374H2844H2484V1104H0514V0764H4344H4614H1944H5244H5584H0804V1774H4694H2834H2934H4084H1744V0104H5724H3284H2154V1364H1814H4724H5214V1534V0824H5504V0964H1784H2824H5444V0694H4184H0764H3264H1124H2814H2104V0074H2984H5264V0674H1314H0194H3174H5324H1874H3864H0774H4774H7134V0064H0364H0854H7164H0914H3404H7034V1054H2494V0684H7044V0494V1304H1954H1424H7254H7084V1474H4714V1434H2244V0594H4364V1594V1694H0304H3974H5524V2174H0634H1644H7194H5194H7054H2334H4164H4744H5744H4414H0814H1694V0534H4674V0604V0234H2144H5704H3154H1594V0744H0714H0404H5024H2384H2794H2234V2084H4174H4114H3124H4354V0404H3454V1994H1134H1634H7144V0384H3244V1154H0604H2124V2144H2294H2704H4494V1864H1054H0504H5304H2054H2564V1604H1674H2364H2064H3274H2114H5054H2254H7424H0204V0574V2164V0264H7214H4224H2024H1664H3984H2944V0394H1254H4894H2474H3804H4974H3914H5514H1244H7274V2024H1114H3034H2504H4884H1194H1724H0844V1064H2014H5484H2554V1554H4034H2164H2624H3384V1344H0724H1994H1564H1614H2714V1244H1264H3304H5564H1804V1714V1484H3224H3254H3854H0254H3014V1384H1704H2654H1604H7154H1904H1884V2124H5274H5414V0194H4204H1714H0654H1454H3054V2284V0344V1584H0794H3104H5674V0034H0544H5394H5654V1234H5204H7184V0934H3144H0834H4584H4064V1744V1944H2374H2414H3844H5134H1204H4524V1414V1834H3294H5574H2684V0834V2074H0174V1564H0594V0314H1284H2354H3114H3434H4194V2064H2774H0824H5624V1784H4534V1274H3444H4784H7124V0354V0114V1464V1544H5064V0124H0424V1734H3814H4874H1004H0954V1764V1654V0724V1874H2964V0324V2134H0214H0534H5474H2464H3904H7444H0884H7064H3354H7104H5314H7114H5554H1974V0474H5094H0464H4594V0294V0334V0914H5084V2034H7094H3194V0054H3834V0664V0844H1464H1984H1554H5104V1494V1184H4944H7204H1304H1894H5254H4044V0904V0274V1394H1044V0014H0354V1204H4924H3184H4854V0454H3074H4484H1224H1584V0434V0734V1084V1254H5234H2034H1164H0574H1414H4544H2854V0364V1354H2314V1894H4054H4644H4334V1374V0414V1724H1534H4574H5604H0494H4024H4754V0464H1484H1474H4864H2644H3944H7264V1644H2394H7024H0754V1444H0234H1404H0894V1424H3734H0454V1824H4504H3134H4304V2184H1934H4824H2664H0314H1794H4734H2424V1134H1274V1314H2974H5184H0674V0814H5164V1264H3084V0284H4684H7224H3924V0204H3334V1294H0134H0974H3994H4984V1094H2604H0444H1824H1684H4664V0634H2924V0044H5364H3874H7284H2004V0514H3024V2114H3424H7294H4104V2044H5754H1434H5534H1364V0714H1444H5594V0954H0384H2544H0524V1404V1984V1514H2734V0944H2764V1674V1324H3824V0804H1494V191 0 0.05 0.1 0.15 0.2 0.25 0.3 -1 -0.8 -0.6 -0.4 -0.2 0 0.2 0.4 0.6 0.8 1 S1 S2 S3 S4 D1 D2 D3 D4 Peer-review history: