http://dx.doi.org/10.22161/ijeab/3.6.13 ISSN: 2456-1878
Effect of Irrigation Intervals on forage
production and quality of different alfalfa
varieties under semi-arid conditions
Nasratullah Ehsas
*1, Muhammad Asif Iqbal
1, Saleh Muhammad Ahmadi
21Department of Agronomy, University of Agriculture, Faisalabad, Pakistan 2Department of Plant Breeding and Genetic, University of Agriculture, Faisalabad, Pakistan
*Email: [email protected]
Abstract— Alfalfa (Medicago sativa L) is a well-k nown and most important forage crop throughout the worldwide, its yield and quality can be enhanced by well -managed irrigation and improved varieties. These two factors have significant changeable role among quantity and quality of the alfalfa crop. During the winter season of 2016-17, an investigation was performed at the University of Agriculture, Faisalabad to evaluate the effect of irrigation intervals on forage production and quality of different alfalfa varieties under semi -arid conditions. three irrigation intervals (10, 20 and 30 days after sowing) on three varieties of alfalfa (Supersonic, Sultana and Lucerne 2002) were used to study its effect on agronomic parameters (plant density, plant height, fresh and dry weights per plant, leaf area, fresh forage and dry matter yields per hectare) and quality parameters (crude protein, crude fiber and total ash content). The research was arranged in a randomized complete block design (RCBD) with split plot arrangement and having 3 replications. Data of the Crop growth, yield and the quality related traits was recorded by applying standard procedure. For statistical analysis of the recorded data, Fisher’s ANOVA technique was used and the Treatments mean values were compared at 5% probability level using the least significant difference (LSD) test. Result of the field experiment revealed that the maximum green forage yield of 26.80 t ha-1 and protein percentage 21.05 was obtained when crop was irrigated 20 days interval and variety Lucerne 2002 was used. Therefore, irrigation with 20 days interval and using Lucerne 2002 variety proved to be best under agroecological conditions of Faisalabad.
Keywords— Alfalfa varieties, Forage production, Forage quality Irrigation, Irrigation Intervals.
I. INTRODUCTION
The main source of feeding for livestock in Pakistan is fodder, and it is the cheapest form for the nourishment of livestock. The scarcity of fodder is the most essential factor which is accountable for the low productivity of
http://dx.doi.org/10.22161/ijeab/3.6.13 ISSN: 2456-1878
without using more nitrogen fertilizer. Moreover, alfalfa is best in palatable energy and also protein, which helps to make a very valuable nutrition when alfalfa is embraced in a livestock daily ration; alfalfa can decrease or dispel the necessity to protein complements while providing high amount of digestible energy. Despite on it, it’s relatively high ranks of calcium, phosphorus and magnesium assist to reduce supplementation price of minerals. Alfalfa is a multipurpose crop which is using as silage, hay and green chop or for pasture. Due to the outcome of its versatility, quality and production potential, alfalfa can be used effectively in various kinds of livestock nourishing programs. This crop is also a good fruitful cash crop. Alfalfa also perform a significant role in crop rotations since it provides considerable quantities of organic nitrogen to the next crops and has abundant positive influences on soil structure, soil fertility and soil health. (Lacefield, et al., 2009).
In Pakistan, various reasons cause to depress the production of alfalfa which are irrigation, weeds infestation, the substandard method of cultivation, malnutrition, level of high yielding and disease resistant varieties. Another problem which is facing our farmer is the level of high yielding and resistant varieties. Mostly pure varieties are not available. Most key yield -limiting factor in western states is the management of irrigation. Using more amount of water, water stress, and absence of good drainage are main problems for Alfalfa production. Water stress often enhances the quality of forage, since the ratio of leaf-stem is boosting due to lack of the stem component’s growth (Marble, 1990). However, yields are linearly associated with the availability of water and are dramatically decreased by water stress. The loss in yield linked with the stress of water is so great to rationalize stressing the alfalfa for water as a means of enhancin g the quality of the forage crops. Increased irrigation interval cause to boost deeper roots that improve absorption huge quantity of nutrients per plant and assembling of these nutrients in the crop (stems and leaves) (Adam, 2015). For improving a good forage-production system; choosing the best varieties of alfalfa is an important issue. Actually choosing the alfalfa variety is an investment for more than 5 years. It is very important to find high quality and certified varieties. Cultivation of highly pro ductive and adapted varieties not only necessary for the good production of alfalfa but also helps to have healthy and forceful stands. (Shroyer et al., 1998).
1.2 Objectives
Keeping in view the above facts, this field experiment was performed with the objective to determine the yield and quality of different varieties of alfalfa as affected by different irrigation intervals under the agroecological condition of Faisalabad.
II. MATERIALS AND METHODS
2.1 Information about the experimental region
The field research was undertaken at the Agronomy Department experimental region, University of Agriculture, Faisalabad (31° 25́ 10˝ N and 73° 5́ 25˝ E) above the sea level of 184.4 m height during the year 2016-2017.
The climate condition of the research area was classified into the sub-tropical zone with the mean temperature (17.41 c°), mean humidity (60.66 %) and mean rainfall (6.36 mm) during the research period. The soil pH of experimental area was 7.6 with having sandy loam texture.
2.2 Experimental Details
The research was planned in a split-plot arrangement of RCBD (Randomized Complete Block Design) while it had three replications and (8 m x 3.6 m) net size of plots. Land was well prepared and leveled. Three Alfalfa varieties (Supersonic, Sultana, and Lucerne 2002) were sown in a good-pulverized condition of soil through the using of hand drill. The seeding depth was half an inch and Nitrogen was applied 60 kg per hectare. Thirty Kilogram of nitrogen together with complete amount of Phosphorus and Potassium were applied to the field while the crop was sowing and the remained 30 kg of nitrogen was used at the time of first irrigation. The NPK (Nitrogen, Phosphorus and Potassium) fertilizers were applied to the crop field in the Urea, Diammonium phosphate (DAP) and SOP forms. Irrigation was applied in three intervals (10 days, 20 days and 30 days) and after every cut hand weeding was done in row spacing to keep the crop free from weeds. The crop was harvested twice. First cutting was done 70 days after planting and second cutting was done after 40 days from the first cut. At the time of each harvest; the crop was cut five centimeter above from the ground surface. The experiment was comprised of following treatments.
Factor A = Different Varieties (Main plot)
V1 = Super Sonic V2 = Sultana V3 = Lucerne 2002
Factor B = Irrigation Intervals (Sub plot)
I1 = 10 days I2 = 20 days I3 = 30 days
2.3 Observations and Data collection:
http://dx.doi.org/10.22161/ijeab/3.6.13 ISSN: 2456-1878
For measuring plant density (m-2) the number of plants counted at the time of first harvest in one square meter (m2) area of each plot at three randomly places and their average was calculated. The plant height data was taken randomly from five plants within each single plot through using measuring tape. Each of the plants were carefully gauged from the bottom part of the plant to the apical point of plant leaf, afterward the mean height was calculated. For recording fresh weight per plant, five plants were chosen arbitrarily in every plot at the stage of cutting and were weighted. Then the average fresh weight per plant was calculated and for measuring the dry weight per plant, 300 g sample of green forage was taken and then dried. The forage samples were dried under shade fo r 48 hours and after that samples were dried at 64° in an oven for 24 hours, till it reached to the constant weight. After drying the dry weight per plant in grams was calculated. For measuring green forage yield the entire plot was harvested and then weight was measured carefully in kilograms through using a springy scale directly after harvesting the crop and then changed to tons per hectare. A sample of 300 g forage from each plot was taken and then dried. The samples were dried under shade for 48 hours and after that samples were dried at 64° in an oven for 24 hours, till it reached to the constant weight. After this the electrical scale was used to measure the dry weight of each sample and then by using the following formula the percentage of dry matter was estimated. Dry matter percentage= (Dry weight of the plant)/ (fresh weight of the plant) x 100
Thereafter, the percentage of dry matter was used for changing the amount of the fresh forage yield in to the dry matter yield of the crop. In each plot, the calculated percentage of dry matter was used for conversion the amount of fresh forage yield in to the dry matter yield of the crop. The quality analysis (Crude protein, crude fiber and total ash contents) was performed by the methods as recommended by AOAC (1990). The collected data were analyzed by using the Fisher’s analysis of variance technique (ANOVA) and for the comparison of treatments mean values the least significant difference (LSD) test was used. (Steel et al., 1997).
III. RESULTS AND DISCUSSION
3.1 Plant density (m-2)
The result indicated that the impact of irrigation intervals and different varieties was significant over plant density. The maximum plant density (245.56 plants per square meter) was detected at 20 days irrigation interval and lowest plant density (211.44 and 169.22 plants per square meter) was recorded at 30 and 10 days irrigation intervals respectively. Maximum plant density (237.22 plants m-2) was recorded in Sultana variety and minimum plant
density (207.11 and 181.89 plants m-2) was recorded statistically in Lucerne 2002 and Supersonic varieties respectively. The irrigation intervals and different varieties interaction effect on plant density (m-2) was found significant which showed that 20 days irrigation interval with Sultana variety produced maximum plant density (313 plants m2). While 10 days irrigation interval with supersonic variety produced minimum plant density (131.67 plants m2). The rest of treatment combinations were intermediate.
3.2 Plant Height (cm-2)
The height of plant was non-significantly influenced by the irrigation intervals which were used in the experiment. The plant height of alfalfa was affected significantly by the different varieties of alfalfa. Statistically, the Lucerne 2002 variety had the supreme plant height (33.78 cm) but the minimum plant height (30.44 and 24.22 cm) was recorded in Sultana and Supersonic varieties respectively.
3.3. Fresh weight plant-1 (g)
The result declared that fresh weight per plant (g) was affected significantly by the irrigation intervals. Irrigation interval with 20 days produced the supreme amount of fresh weight per plant (3.60 g). It was followed by the fresh weight plant-1 (2.61 and 2.32 g) at 10 days and 30 days irrigation intervals respectively. The fresh weight plant-1 (g) was affected non-significantly by the different varieties of alfalfa. The irrigation intervals and different varieties interaction effect was found statistically non-significant. However, fresh weight per plant ranged from 1.77 to 4 g in different treatment combination.
3.4. Dry weight plant-1 (g)
The dry weight plant-1 (g) was affected significantly by the irrigation intervals. Statistically, the irrigation interval with 20 days produced the supreme amount of dry weight per plant ( 0.99 g) and the irrigation intervals with 30 days and 10 days produced the minimum amoun t of dry weight per plant (0.70 and 0.61 g) respectively which were statistically at parity with one another. The alfalfa dry weight per plant (g) was not affected significantly by the different varieties of alfalfa. The irrigation intervals and different varieties interaction effect on dry weight per plant (g) was found statistically non-significant. However, dry weight per plant ranged from 0.47 to 1.13 g in different treatment combinations.
3.5 Fresh forage yield (t ha-1)
http://dx.doi.org/10.22161/ijeab/3.6.13 ISSN: 2456-1878
significantly by the different varieties of alfalfa. The irrigation intervals and different varieties interaction effect was statistically significant which showed that the Lucerne 2002 variety produced more fresh forage yield (t ha-1) at 20 days irrigation interval and the less fresh forage yield (t ha-1) was given by the Supersonic variety at 10 days irrigation interval.
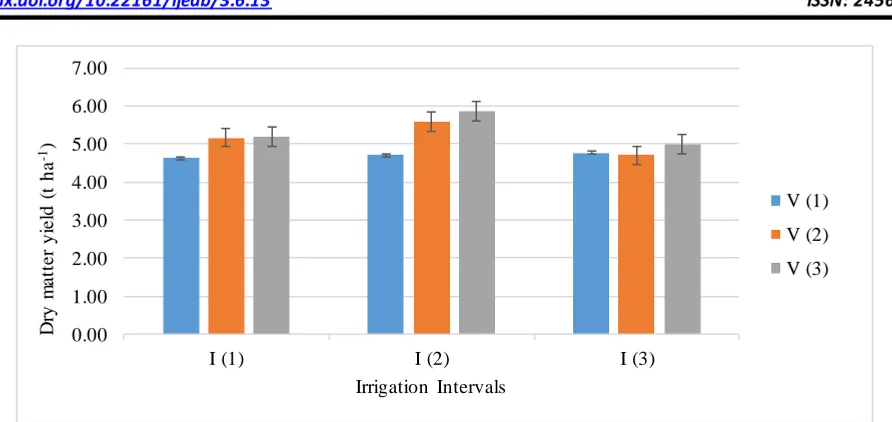
3.6 Dry matter yield (t ha-1)
The irrigation intervals or different alfalfa varieties did not affect significantly the dry matter yield per hectare. The irrigation intervals and different varieties interaction effect on the dry matter yield of alfalfa was not found statistically significant.
Table.1: Mean values for plant density (m2), plant height (cm), fresh weight plant-1(g), dry weight plant-1(g), fresh forage yield (t ha-1) and dry matter yield (t ha-1).
Irrigation intervals
Plant density (m2)
Plant height (cm)
Fresh weight plant-1 (g)
Dry weight plant-1 (g)
Fresh forage yield (t ha-1)
Dry matter yield (t ha-1)
I1 (10 days) 169.22 c 27. 89 2.61 b 0.61 b 21.62 b 5
I2 (20 days) 245.56 a 30. 78 3.60 a 0.99 a 25.19 a 5.38
I3 (30 days) 211.44 b 29. 78 2.32 b 0.70 b 23.39 ab 4.82
Varieties
V1 (Supersonic) 181.89 b 24.22 b 2.67 0.70 21.5 4.7
V2 (Sultana) 237.22 a 30.44 ab 2.34 0.66 23.4 5.14
V3 (Lucerne 2002) 207.11 ab 33.78 a 3.52 0.94 25.3 5.36
Note: Means having the same letter case are statistically non -significant at 5% level of Probability.
Fig.1: Irrigation intervals and different varieties Interaction effects on the plant density (m-2) of Alfalfa. 0.00
50.00 100.00 150.00 200.00 250.00 300.00 350.00 400.00
I (1) I (2) I (3)
P
la
n
t
d
e
n
s
it
y
(
m
-2)
Irrigation Intervals
V (1)
V (2)
V (3)
0 5 10 15 20 25 30 35 40 45
I (1) I (2) I (3)
P
la
n
t
H
e
ig
h
t
(c
m
)
Irrigation Intervals
V (1)
V (2)
http://dx.doi.org/10.22161/ijeab/3.6.13 ISSN: 2456-1878
Fig.2: Irrigation intervals and different varieties interaction effects on the plant height (cm) of Alfalfa.
Fig.3: Irrigation intervals and different varieties interaction effects on the fresh weight plant-1 (g) of Alfalfa
Fig.4: Irrigation intervals and different varieties interaction effects on the dry weight plant-1 (g) of Alfalfa.
Fig.5: Irrigation intervals and different varieties interaction effect s on the fresh forage yield (t ha-1) of Alfalfa. 0.00
0.50 1.00 1.50 2.00 2.50 3.00 3.50 4.00 4.50 5.00
I (1) I (2) I (3)
F
re
s
h
w
e
ig
h
t
p
la
n
t-1
(
g
)
Irrigation Intervals
V (1)
V (2)
V (3)
0.00 0.20 0.40 0.60 0.80 1.00 1.20 1.40
I (1) I (2) I (3)
D
ry
w
e
ig
h
t
p
la
n
t-1
(
g
)
Irrigation Intervals
V (1)
V (2)
V (3)
0.00 5.00 10.00 15.00 20.00 25.00 30.00
I (1) I (2) I (3)
F
r
e
s
h
f
o
r
a
g
e
y
ie
ld
(
t
h
a
-1)
Irrigation Intervals
V (1)
V (2)
http://dx.doi.org/10.22161/ijeab/3.6.13 ISSN: 2456-1878
Fig.6: Irrigation intervals and different varieties interaction effects on the dry matter yield (t ha-1) of Alfalfa.
Note: Factor A: Irrigation intervals (I1=10 days, I2= 20 days and I3= 30 days), Factor B: Varieties (V1= Supersonic, V2= Sultana, V3= Lucerne 2002)
3.7 Crude Protein (% )
The percentage of alfalfa crude protein was affected significantly by the irrigation intervals but it was not affected significantly by the different alfalfa varieties. Statistically, the irrigation interval with 20 days produced alfalfa with the supreme amount of Crude protein (21.05 %) and the irrigation intervals with 10 and 29 days produced alfalfa with the minimum amount of Crude Protein (20.45 and 19.34 %) respectively which similar result also reported by (El Din and Assaeed, 1993). The irrigation intervals and different varieties interaction effect was found statistically non-significant.
3.8 Crude Fiber (% )
The impact of irrigation intervals and different varieties on the Crude fiber percentage was significant. Statistically, the highest amount of Crude fiber (29.93 %) was recorded at 10 days irrigation interval and the minimum Crude fiber (29.37 and 28.30 %) was recorded at 20 and 30 days irrigation intervals respectively . Similar
type of result were also reported by (Kandil and Shareif, 2016). Statistically, maximum Crude fiber (29.32 %) was recorded in Supersonic variety and the minimum Crude fiber (29.25 and 29.04%) was recorded in Sultana and Lucerne 2002 varieties respectively both were existing statistically similar with each other. The irrigation intervals and different varieties interaction effect was found statistically non-significant.
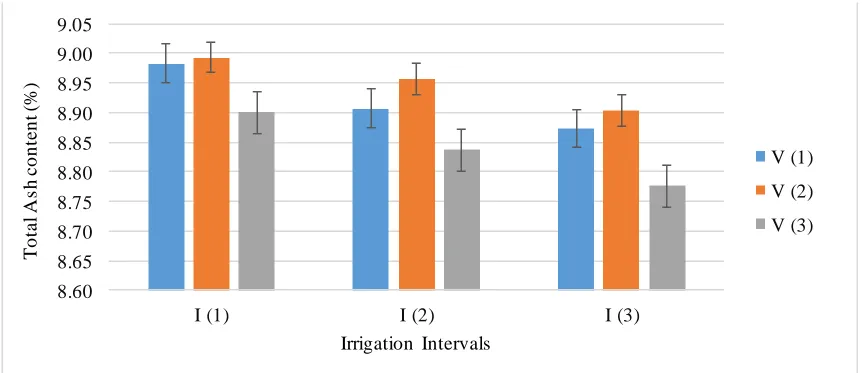
3.9 Total Ash (% )
The irrigation intervals effect on the Ash (%) was significant. Statistically, maximum Ash (8.96 %) was recorded at 10 days irrigation interval and the minimum Ash (8.90 and 8.85 %) was recorded at 20 and 30 days irrigation intervals respectively both were existing statistically similar with each other. similar result also reported by (Kandil and Shareif, 2016). The effect of different varieties on the Ash (%) was non-significant. The irrigation intervals and different varieties interaction effect was found statistically non-significant.
Table 2: Mean values for Crude protein (%), Crude fiber (%) and Total ash (%),
Irrigation Intervals Crude protein (% ) Crude fiber (% ) Total ash (% )
I1 (10 days) 20.45 b 29.93 a 8.96 a
I2 (20 days) 21.05 a 29.37 b 8.90 ab
I3 (30 days) 19.34 b 28.30 c 8.85 b
Varieties
V1 (Supersonic) 20.32 29.32 a 8.92
V2 (Sultana) 20.20 29.25 a 8.95
V3 (Lucerne 2002) 20.32 29.04 b 8.84
Note: Means having the same letter case are statistically non -significant at 5% level of Probability. 0.00
1.00 2.00 3.00 4.00 5.00 6.00 7.00
I (1) I (2) I (3)
D
ry
m
a
tt
e
r
y
ie
ld
(
t
h
a
-1)
Irrigation Intervals
V (1)
V (2)
http://dx.doi.org/10.22161/ijeab/3.6.13 ISSN: 2456-1878
Fig. 7: Irrigation intervals and different varieties interaction effect s on the Crude protein (%) of Alfalfa.
Fig. 8: irrigation intervals and different varieties interaction effects on the Crude fiber (%) of Alfalfa
Fig. 9: Irrigation intervals and different varieties interaction effects on the Total Ash content (%) of Alfalfa
Note: Factor A: Irrigation intervals (I1=10 days, I2= 20 days and I3= 30 days), Factor B: Varieties (V1= Supersonic, V2= Sultana, V3= Lucerne 2002).
17.00 17.50 18.00 18.50 19.00 19.50 20.00 20.50 21.00 21.50 22.00
I (1) I (2) I (3)
C
ru
d
e
P
ro
te
in
(
%
)
Irrigation Intervals
V (1)
V (2)
V (3)
26.00 26.50 27.00 27.50 28.00 28.50 29.00 29.50 30.00 30.50 31.00
I (1) I (2) I (3)
C
ru
d
e
f
ib
e
r
(%
)
Irrigation Intervals
V (1)
V (2)
V (3)
8.60 8.65 8.70 8.75 8.80 8.85 8.90 8.95 9.00 9.05
I (1) I (2) I (3)
T
o
ta
l
A
s
h
c
o
n
te
n
t
(%
)
Irrigation Intervals
V (1)
V (2)
http://dx.doi.org/10.22161/ijeab/3.6.13 ISSN: 2456-1878
IV. CONCLUSION
On the basis of results it was concluded that variety Lucerne 2002 irrigated 20 days interval seems to be best than other treatment combinations under the agro -ecological conditions of Faisalabad.
REFERENCES
[1] Adam, M.Y. (2015). Effect of seed rate and nitrogen on growth and yield of Teff Grass (Eragrostis teff, zucc.) Trotter, UOFK.
[2] Agric. Statistic. of Pakistan. (2009-10). Govt. of Pakistan. Ministry of National food security and Research, Economic Wing, Islamabad.
[3] Agric. Statistic. of Pakistan. (2014-15). Govt. of Pakistan. Ministry of National food security and Research, Economic Wing, Islamabad.
[4] A.O.A.C.(1990). Official methods of analysis. Association of Official Agricultural Chemists. 15th Ed. Arlington, Virginia, USA.
[5] Economic Survey. (2016-17). Govt. of Pakistan. Ministry of Finance, Economic Advisor’s Wing, Islamabad.
[6] El Din, S. S. T., and A. A. M. Assaeed. (1993). Effect of Phosphorus fertilizer and Irrigation Frequency on Yield and Protein Content of Alfalfa. [7] Kandil, A.A., and A. E. Shareif. (2016). Evaluating
productivity of some forage crops under different irrigation intervals in newly reclaimed soils. International Journal of Contemporary Applied Science. 3:
[8] Lacefield, G., D. Ball, D. Hancock, J. Andrae and R. Smith. 2009. Growing Alfalfa in the South. National Alfalfa and Forage Alliance.
[9] Marble, V.L. (1990). Factors to Optimize Alfalfa Production in the 1990s. California Alfalfa Symposium, Dept. of Agronomy and Range Science, University of California Cooperative Extension. UC Davis, CA 95616.
[10]Steel, R. G. D., J. H. Torrie, and D. A. Dickey. (1997). Principles and procedures of statistics: a biometric approach, 3rd ED. McGraw Hill Book Co. In., New York. USA.