Abstract—Identification of faults in a transformer using Dissolved Gas Analysis (DGA) method is very common. The conventional DGA methods are easy to use, but their diagnosis accuracies need improvement. The proposed work presents a Support Vector Machine (SVM) based faults diagnosing method in the transformer. SVM has been successfully used for classification problem of nonlinear in nature with limited samples. Cat Swarm Optimization (CSO) is a new optimization algorithm in the field of swarm intelligence finding the best global solution. SVM parameters would be optimized by applying CSO method. Most research studies reviewed that the performance of CSO and convergence speed of CSO is significantly better than that of Ant Colony Optimization (ACO), Particle Swarm Optimization (PSO). It is found that, CSO is the best performing algorithm as it finds the lowest fitness value for the most of the problems. Hence, this method will be applied to Power transformer fault diagnosis based on Dissolved Gas Analysis results. SVM method requires less data set for programming in Matlab. The SVM method applied to transformer fault identification can give higher accuracy.
IndexTerms—Transformer, Dissolved Gas Analysis (DGA), Support Vector Machine (SVM), Cat Swarm Optimization (CSO)
I.INTRODUCTION
It is well known that power transformer is one of the most important and the most critical electrical equipment in the power system, its safety and reliability is related to power system security and stability. Therefore, it is very important to diagnosis latent fault of power transformer as early as possible. When the transformer go wrong, a number of gases such as hydrogen, methane, ethane, ethylene, acetylene and other gases will be produced, the type of transformer fault can be determined by according to analysis the content of these gases. In the past several decades, many scholars analysis transformer oil dissolved gas by using three ratio method, BP neural network, fuzzy algorithm and genetic algorithm, they got some research result ,however, the diagnostic accuracy and reliability should been improved further.
Manuscript received Feb, 2016.
J. Jefrin wilfred, UG Student, Department of EEE, PSN College of Engg. and Tech., Tirunelveli, Tamilnadu.
A. Sundar
,
UG Student, Department of EEE, PSN College of Engg. and Tech., Tirunelveli, Tamilnadu.V. Kapil Raja
,
UG Student, Department of EEE, PSN College of Engg. and Tech., Tirunelveli, Tamilnadu.A.Saravanan, Assistant Professor, Department of EEE, PSN College of Engg. and Tech., Tirunelveli, Tamilnadu.
M. Muneeswaran, Assistant Professor, Department of EEE, PSN College of Engg. and Tech., Tirunelveli, Tamilnadu.
Support vector machine (SVM) is a novel machine learning method based on statistical learning theory, which implements the principle of structural risk minimization in place of experiential risk minimization to ensure maximum generalization ability of model under the circumstances of small sample. Its local optimal solution is globally optimal solution because it is a convex optimization problem.
II.THE FAULT DIAGNOSIS MODEL BASED ON
SUPPORTVECTOR MACHINE AND CAT SWARM OPTIMIZATION
WhereverTimesisspecified,TimesRomanorTimesNewRoman maybeused.Ifneitherisavailableonyourwordprocessor,pleaseu sethefontclosestinappearancetoTimes.Avoidusingbit-mapped fonts.TrueType1orOpenTypefontsarerequired.Pleaseembed all fonts, in particular symbol fonts, as well, form a th,etc.
A.Support Vector Machine
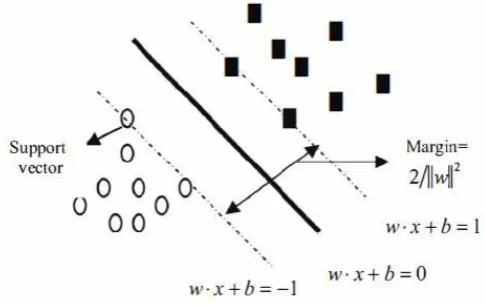
The classify algorithms of support vector machine include linear classify algorithm and nonlinear classify algorithm. When the sample data are linear, the sample data are fitted by linear classify function f (x) = w. X + b = 0; the optimal separating hyper plane can be shown in Figure 1:
Fig. 1.The optimal separating hyper plane.
Where w is the weight vector, b is the bias term.
When the sample data are nonlinear, the basic concept of SVM classify is to map nonlinearly the original data X into a higher dimensional feature space, and then build optimal separating hyper plane in high dimensional space, by which maximize the distance between training sample point and the optimal separating hyper plane to separate the training samples. Hence, given the sample data:
is the input vector, is corresponding output value and Ɩ is the total number of sample data, the SVM classification function is:
Transformer Fault Diagnosis Based on Support
Vector Machine and Cat Swarm Optimization
Where is the non-linear mapping function, w is the weight vector and b is the bias term. The optimal hyper plane should also satisfy the following constraint:
When the slack vector ξi is introduced, the optimal hyper plane problem is transformed into the following optimization problem:
is the regularization item, which controls the complexity of the Classification function and the model generalization ability. is the empirical risk item. C is a penalty factor, which is considered to strike a balance between the regularization item and empirical risk item. Because the equation (3) is a convex quadratic programming problem, it can be solved by the Lagrange method. So when Lagrange multiplier is introduced into the optimization problem, equation (3) is transformed into its dual problem:
When the kernel function is
introduced into the optimization problem, the equation (4) is transformed into the following constrained form:
Where are the lagrangian multipliers. In order to avoid the curse of dimensionality, the inner product calculation is replaced by the kernel function, so, the objective function is optimized as follows:
Where is called the kernel function, The value of the kernel function equals the inner product of and which are produced by mapping two vectors and into the higher dimensional feature space, that is . In this paper, radial basis kernel
function is adopted to replace
the inner product calculation. In sum, the basic object of the classification function is just to find a set of optimum parameters, such as penalty factor C and kernel function
B.The Review of Selecting parameters C and γ
In this paper, the cross-validation technology is used to choose the model parameters, and its main steps are asf ollows: firstly, the range of C and γis set to [2-10, 210 ] ;secondly, the three free parameters are gotten by conducting a grid search; thirdly, the mean square error(MSE ) is calculated by the "leave-one-out" cross-validation, in which one of the training samples is taken as validation set in turn, others are taken as training set, then each training sample is validated once; finally, the parameters are a scertained according to the global minimum criteria of the mean square error to evaluate the model generalization capacity. The MSE formula is defined as:
Where n is the total number of sample, Gi, is the test samples et in which the sample i is validation sample, and yi is the actual output value of the sample is predictive value of the sample.
C.Cat swarm optimization
Cat swarm Optimization (CSO) is a newly risen optimization algorithm based on computational intelligence, which is observing the common behaviour of the cats. Consequently, two major characteristics are modelled for CSO, i.e., seeking and tracing mode. These two mode respectively show the traits of cats are during resting time but still alerting of its' environment for next move and tracking target to catch it.
III.THE TRANSFORMER FAULT DIAGNOSIS MODEL AND
DIAGNOSTIC PROCEDURE
The solution set design and system architectures forth proposed feature selection method using cat swarm optimization and parameter determination for support vector machines are given below.
A.Solution set design
This research adopts RBF as the kernel function to establish SVM classifier because that RBF kernel could map the non-linearly samples into a higher dimensional space. Besides, it has less numerical difficulties and hyper-parameters could reduce the complexity of model selection. Therefore, the solution set intend to separate two types that consist of kernel parameters (C and γ) and feature subset. When the mode flag of cat, is denoting seeking mode, the solution set comprise three segments. Figure 2illustrates the solution representation in seeking mode. In Figure 2, C1 ~Cnc represent the parameter value C, γ1~ γng represent the value of parameter γ and F1 ~ Fnf represent the feature subset. nc, ng and nf are the length of these decision variables . Hence, the ranges of these variables are defined between 0 and 1. If each value off variables is greater than 0.5 and then its homologous feature is chosen. Otherwise, the value isles or equal than 0.5, it means the homologous
coding system could convert into kernelparameter (i.e., limitary decimal value of SVM) forutilizing in SVM classifiers by equation (4).
C1 …Ci… Cnc γ1 …γi… γng F1 …Fi… Fnf
Fig. 2. The solution representation in seeking mode.
Where Pk and l are individually stand for limitarydecimal value and length of ng or nf decisionvariables. maxp and minp denote the maximum andminimum value of the kernel parameters respectively.d is decimal value of virtual binary coding system.
Another type of solution set occurs in mode flag ofcat, is denote tracing mode that illustrated with Figure3. In Figure 3, C and y represent the RBF kernelparameters that can immediate utilizing in SVMclassifiers, F1 ~ Fnf act as the same purpose in seekingmode. However the mode flag is seeking or tracingmode, its maximum and minimum value of theparameter is determined by user.
C γ F1 …Fi… Fn
Fig. 3. The solution representation in tracing mode.
B.System architecture
Figure 4 illustrates the main procedures forimplementing the proposed CSO-based method to findoptimized feature subset and RBF kernel parameters(Cand y) for SVM. The first step is data pre-processingthat recommend linearly scaling the dataset torange [-1, +1] or [0, 1]. This step can preventnumerical difficulties during calculating and thefeatures in greater numeric ranges dominate those insmaller numeric ranges. Secondly, separate the datasetto training and testing set with selected feature subset.And then put the training part, parameter C and γ intoSVM classifiers for building the excellent model. Nextstep is put the testing part for evaluatingaccommodation of the fitness function. Therefore, eachsolution set has a fitness value. If the terminateconditions are satisfied, then optimized C and γ andfeature subset are determined. Otherwise, implementthe CSO operators (i.e., mutative ration in seeking andtracing mode) again to generate new kernel parametersand feature subset.
C.The Transformer Fault Diagnosis Model.
In the paper, the transformer state are divided into normal, high energy discharge fault, low energy discharge fault, high thermal fault, middle and low thermal fault according to train four support vector models, the transformer fault diagnosis model is built by binary classification principle of SVM, based on the characteristics of different transformer fault types, four SVM classifiers are developed to identify the five fault types: normal state, high thermal heating, middle and low thermal heating, low-energy discharge, high-energy discharge. With all training samples of four types, the first SVM (SVMI) classifier is trained to separate normal state from other four fault types
Fig. 4. The system architecture of the proposed
CSO+SVM method.
(high thermal heating, middle and low thermal heating, low-energy discharge and high-energy discharge).
Fig. 5. The model of transformer fault diagnosis.
D.The Diagnosis Step of Transformer Fault
1. The analytical base of diagnosis is some diagnostic gas content obtained by DGA. These diagnostic gases include H2, CH4, C2H6, C2H4 and C2H2. Then, training set and testing set are established according to the measured DGA data in the transformer;
2. In order to get much better train result, the training set data and testing-set data should be normalized, it is shown as follows:
where, fs (s = 1,2 .. . 5) is the volume fraction of the five characteristics gases ; us is the normalized value of the five gases;
3. The kernel function is fixed as:
4. The parameters C and γ are ascertained according to the cross-validation technology and grid search technology; 5. The support vector machine model is gained according to train the entire training set by using best parameters C and γ;
6. The testing set is tested according to the model, and the test result and the diagnostic accuracy are got.
IV.THE ANALYSIS FOR DIAGNOSING DISSOLVED GASES
CONTENT IN POWER TRANSFORMER OIL
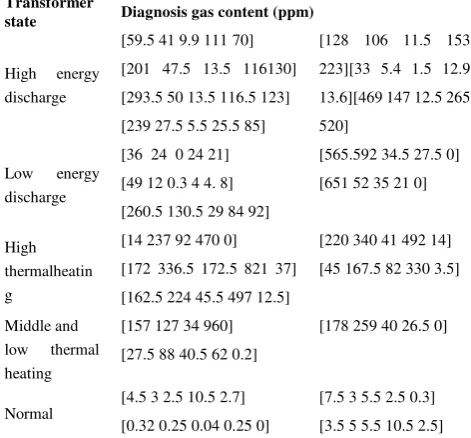
The dissolved gas analysis (DGA) is the effective way for latent faults diagnosis of power transformer. In the study, the dissolved gases content data were collected in June 2009 and were measured by oil chromatography on-line monitoring device. In the paper, 60 significant features history data of transformer oil dissolved gases are extracted, the 36 data are the training set (shown in Table 1), other 24 data are the testing set (shown in Table 2), According to test the forecasting model, the selection results of C, r and the diagnosis accuracy are shown in Table3. It be seen from the test result, the diagnosis accuracy of SVMl, SVM2, SVM3 is 100%, only the diagnosis accuracy of SVM4 is 91.6667%. However, the diagnosis accuracy of BP network is only 78.5%, so, the SVM has a greater diagnosis accuracy than BP network.
TABLE I. THE ORIGINAL DATA OF GAS CONTENT OF THE
TRANSFORMERFORTRAININGSET
Transformer
state Diagnosis gas content (ppm)
High energy
discharge
[21 7.6 4.7 96.3 26.73]
[48.3 47.4 7.3 52.2 7.3]
[65 26.1 10.1 41.657.8]
[421 135 27.7 351 374]
[2054 370 26 535 805]
[49 41.625.1 124 15.7]
[335 67 18 143 170]
[443 85 9.5 103 174]
Low energy
discharge
[4.1 3.5 0.68 1.2 5.2]
[43 36 41 47 13]
[49.1 12.2 0.3 3.9 4.8]
[316 36.1 37.3 109 440]
[26.5 29.8 0 69.3 8.6]
[46.7 8.2 1.8 5.1 4.1]
[72 116 36 70 19]
[42 59 8 28 8]
High thermalheatin g
[45 168 82 330 3.1]
[6.9 80.6 47.4 351 4.9]
[56 144 36 164 1.8]
[80 243 274 1348 8.4]
[143 305 78 721 2]
[76202 275 3216 16]
[7.8 111 129 701 2.8]
[58 103 51 251 6]
[82 161 79 4068.9]
[279 487 109 708 4.4]
Middle and
low thermal
heating
[44.2 101 13 11. 8 0.45]
[11 31 26 52 0]
[46 98 41.3 26.3 0]
[140 173 45 17 0]
[18 20 6 12 2]
[77.5 160 984 352 9]
Normal
[5.6 1.6 l . l 0.5 3.3]
[2 1.5 0.60.7 0.5]
[4.5 2.45 0.75 4 3.2]
[3.5 1.7 1.4 8.8 3.1]
Data in every grid is content ofH2, CH4, C2H6, C2H4 and C2H2, respectively
TABLE II. THE ORIGINAL DATA OF GAS CONTENT OF THE
TRANSFORMERFORTESTINGSET
Transformer
state Diagnosis gas content (ppm)
High energy
discharge
[59.5 41 9.9 111 70]
[201 47.5 13.5 116130]
[293.5 50 13.5 116.5 123]
[239 27.5 5.5 25.5 85]
[128 106 11.5 153
223][33 5.4 1.5 12.9
13.6][469 147 12.5 265
520]
Low energy
discharge
[36 24 0 24 21]
[49 12 0.3 4 4. 8]
[260.5 130.5 29 84 92]
[565.592 34.5 27.5 0]
[651 52 35 21 0]
High thermalheatin g
[14 237 92 470 0]
[172 336.5 172.5 821 37]
[162.5 224 45.5 497 12.5]
[220 340 41 492 14]
[45 167.5 82 330 3.5]
Middle and
low thermal
heating
[157 127 34 960]
[27.5 88 40.5 62 0.2]
[178 259 40 26.5 0]
Normal
[4.5 3 2.5 10.5 2.7]
[0.32 0.25 0.04 0.25 0]
[7.5 3 5.5 2.5 0.3]
[3.5 5 5.5 10.5 2.5]
Data in every grid is content of H2, CH4, C2H6, C2H4 and C2H2, respectively.
TABLE III. THETESTRESULTANDDIAGNOSISACCURACY
Classifier C
γ
The number ofSupport vector Accuracy
SVM1 64 64 1 92.667%
SVM2 1024 0.25 5 90.226%
SVM3 64 0.03125 5 91.558%
SVM4 64 0.25 5 91.667%
VCONCLUSIONS AND FUTURE SCOPE
SVM is a novel machine learning method based on SLT. It is powerful for the practical problem with small sampling, nonlinear and high dimension. In this paper, SVM is applied for diagnosing dissolved gases content in power transformer oil. To investigate its feasibility in diagnosing power transformer fault, the real data sets are used. The experimental results indicate that SVM has more excellent performance than BP network in diagnosing power transformer fault. Several causes make SVM have a superior forecasting performance. Firstly, Support vector machine (SVM) is the statistical theory, which implements the principle of structural risk minimization in place of experiential one to ensure maximum generalization ability of model under the circumstance of small samples. Secondly, SVM can change a nonlinear learning problem into a linear learning problem in order to reduce the complexity of algorithm by using the kernel function. Thirdly, the cross-validation technique is used to select the most suitable parameters to forecast dissolved gases, which ensure the generalization ability and diagnosis accuracy of SVM. The proposed method has a large potential in practice according to the experimental results, however, since it is seldom applied to the fault diagnosis of power transformer, there still remain some problems, such as the selection of kernel function and the optimization of parameters, which need to be studied in the future study.
ACKNOWLEDGMENT
The author would like to thank PSN College of Engineering and Technology, Tirunelveli for their technical expertise and support in developing this paper.
REFERENCES
[1] G.V.Duraisamv, N. Devarajan, D.Somasundareswari, A.Antoy Maria Vasanth, S.N.Sivanandam, "Neuro fuzzy schemes for fault detectionin power transformer", Applied Soft Computing, 7(2007) 534-539
[2] CAO Yu-ping,TIAN Xue-min, "Nonlinear fault prognosis based on SVM and Kalman prediction", Control and Dcision,2009,24(3):477-480.
[3] ZOU Min, "Research on Fault Diagnosis for Hydro-turbine Generating Units Based on Support Vector Machines", Wu Han:Huazhong University of science &Technology, 2007. [4] Zhang Chao, "Research on intelligent fault diagnosis of turbine
shafting base on support vector machine", North China ElectricPower University, 2009.
[5] Ganyun LV,Haozhong cheng, Haibao Zhai, Lixin Dong, "Fault diagnosis of power transformer based on multi-layer SVM classifier",Electric Power Systems Research 75 (2005) 9-15. [6] Sheng-wei Fei,Xiao-bin Zhang. "Fault diagnosis of power
transformer based on support vector machine with genetic algorithm",Expert Systems with Applications 36 (2009) 11352-11357.
[7] Bernd. H, Thomas. S, Sam.P, &Tomaso.P, "Hierarchical classification and feature reduction for fast face detection with support vectormachines", Pattern Recognition, 36(9), 2007-2017.
[8] M.N.Wang. "A novel extension method for transformer faultdiagnosis. IEEE Trans", Power Del. 18 ( I) (2003) 164-169
[9] W.C.Chan, C.W.Chan, K.C.Cheng,C.J.Harris. "On the modeling ofnonlinear dynamic systems using support vector neural networks", Eng. Appl.Aritif.Intell.l4 (2001) 105-113. [10]V.N.Vapnik. "The nature of Statistical Learning
Theory",Springer-Verlag,New York, 1995.
[11]S. C. Chu and P. W. Tsai, "Computational Intelligence Based on the Behavior of Cats," International Journal of Innovative Computing, Informationand Control, vo1.3,no.1, 2007, pp.163-173.