670
Copyright © 2011-15. Vandana Publications. All Rights Reserved.
Volume-5, Issue-2, April-2015
International Journal of Engineering and Management Research
Page Number: 670-674
Economic Reforms and Status of SMEs in India- A Study
Dr. Ajay Kumar Sharma1, Suganya. S2, Kavitha. N. A3
1
Assistant Professor, VIT University, Vellore, INDIA
2,3
Research Scholar,VIT University, Vellore, INDIA
ABSTRACT
The discussion on small and medium enterprises is rather ritualistic in India. The litany of positives as often been used as a cover up. But the picture of SMEs at the end of 2005 remains rather blurred. Two critical areas however stand out- SSI credit and micro finance. Both areas have significance, not simply by their strategic importance, but in practice, from their back ended relationship. There has been significant debate on the contribution of the micro finance movement. This movement in India, despite its social relevance, is yet to build economic rationale. The bandwagon effect of micro finance is such that targeted lending by commercial banks has got equated with micro finance. The government has announced several policies for Small and Medium Enterprises/Industries in the wake of the removal of Quantitative Restrictions as the WTO requires. It has decided to maintain the Foreign Direct Investment (FDI) limit for Small and Medium Enterprises/Industries at 24 per cent (not raise the limit as recommended by the study group), retain export obligations for large units producing items reserved for Small and Medium Enterprises/Industries (at 50 per cent), continue with the price preference policy for Small and Medium Enterprises/Industries, and finally set up a technology, up gradation and modernization fund. Through this paper an attempt was made to evaluate the economic reforms which were made for the SMEs.
Keywords---- Economic reforms, Globalization, SMEs, SSI.
I.
INTRODUCTION
Among the worst affected by the slowdown, SMEs need credit support not just for working capital but also technology upgrade. It is hardly surprising that small and medium enterprises (SMEs) in India are the worst affected by the slowdown. Facing severe contraction of orders and credit since September, a number of them have been forced to shut operations. Those SMEs that relied heavily on export orders, as for instant textile units, have been particularly hit. Even though a good many of them
fighting off closure prospects through nifty changes in production processes and trimming of expenses, the fact remains that in this climate of risk aversion by banks, the ones that hung on the coattails of large companies have been badly hurt. This is a matter of concern because SMEs are said to contribute around 8 percent to the GDP and employ more than 40 million. Credit squeeze for this vital sector can strain not just the labor market but also affect the ancillary sector of the organized economy that supply components and intermediate products. Against this backdrop, the recent report on credit delivery of SME by the Reserve Bank of India focuses policy attention at the opportune time. Headed by Dr. K. C. Chakrabarty, Chairman, Punjab National Bank, the report submits proposals for three levels of facilities: the central and state governments and banks. These are meant to facilities not just credit for the SMEs experiencing both start-up difficult and working capital but also finance for technology upgrade. The last is crucial: SMEs have some advantages of size that allows them to innovate more freely than large businesses do, as the National Knowledge Commission has noted.
II.
PRESENT POSITION OF SMALL
AND MEDIUM ENTERPRISE SECTOR
TABLE-1
SUMMARY RESULTS OF THIRD CENSUS FOR THE PREVAILING POSITION
Characteristics
Registere d SSI Sector
Unregistered Sector
Total SSI Sector Size of the sector 13,74,974 91,46,216 1,05,21,190 No. of rural units 6,09,537
(44.33)%
51,98,822 (56.8%)
58,08,359 (55%) No of SSIs 9,01,291
(65.55%)
35,44,577 (38.75%)
44,45,868 (42.26%) No. of Small Scale
Service & Business 4,73,683 (34.45%)
56,01,639 (61.25%)
671
Copyright © 2011-15. Vandana Publications. All Rights Reserved.
(Industry related) Enterprises
No. of ancillary units (%age of no. of SSIs)
45,797 (5.08%) 86,516 (2.44%) 1,32,313 (2.98%) No. of tiny units of SSIs 8,82,496
(97.9%)
35,43,091 (99.9%)
44,25,587 (99.5%) No. of women enterprises 1,37,534
(10%)
9,26,187 (10.13%)
10,63,721 Nature of activity:
Manufacturing/Assembli ng/Processing Repairing & Maintenance Services 8,72,449 (63.45%) 28,843 (2.10%) 4,73,682 (34.45%) 33,03,366 (36.12%) 16,92,663 (18.50%) 41,50,187 (45.38%) 41,75,815 (39.69%) 17,21,506 (16.36%) 46,23,869 (43.95%) Type of organization:
Proprietary Partnership Pvt. Company Co-operative Others 12,21,702 (88.85%) 99,190 (7.21%) 33,284 (2.42%) 4,715 (0.34%) 16,083 (1.17%) 88,62,548 (96.9%) 1,03,662 (1.13%) 38,153 (0.42%) 9,854 (0.11%) 1,31,999 (1.44%) 1,00,84,250 (95.8%) 2,02,852 (1.9%) 71,437 (0.68%) 14,569 (0.14%) 1,48,082 (1.41%) No. of units managed by:
SC ST OBC Others 1,07,934 (7.85%) 48,560 (3.53%) 5,29,406 (38.50%) 6,89,074 (50.12%) 9,43,969 (10.32%) 4,74,271 (5.19%) 38,11,372 (41.67%) 39,16,604 (42.82%) 10,51,903 (10%) 5,22,831 (4.97%) 43,40,778 (41.26%) 46,05,678 (43.8%) No. of units managed by
women 1,14,361 (8.32%) 8,80,780 (8.37%) 9,95,141 (9.46%) Main source of power:
No power needed Coal Oil LPG Electricity Non-Conventional energy Traditional energy/Firewood 3,60,611 (26.23%) 28,841 (2.10%) 40,401 (2.94%) 7,222 (0.53%) 8,99,657 (65.43%) 7,142 (0.52%) 31,100 (2.26%) 38,55,035 (42.15%) 2,95,165 (3.23%) 5,55,416 (6.07%) 55,237 (0.60%) 40,25,262 (44.01%) 60,539 (0.66%) 2,99,562 (3.28%) 42,15,646 (40%) 3,24,006 (3.1%) 5,95,817 (5.66%) 62,459 (4.59%) 49,24,919 (46.8%) 67,681 (0.64%) 3,30,662 (3.14%) No of units having
outstanding loan as on 31-03-2002 2,76,333 (20.1%) 5,01,306 (5.48%) 7,77,639 (7.39%) No of units having
outstanding loan with institutional sources 1,96,137 (14.26%) 2,82,267 (3.09%) 4,78,404 (4.55%) No of sick units (with
erosion of net-worth by more than 50% or delay in re-payment of institutional loan by more than 12 months)
46,431 (3.38%) 58,338 (0.64%) 1,04,769 (1%)
No of incipient sick units (declined in gross output over 3 consecutive years)
1,58,023 (11.5%) 5,92,899 (6.48%) 7,50,922 (7.14%) No of sick units as per 38,403 46,887 85,290
RBI criteria, i.e., those that are sick among units having outstanding loan with institutional sources
(19.6%) (16.61%) (17.8%)
No of sick/incipient sick units (with erosion of net-worth by more than 50% or delay in repayment of institutional loan by more than 12 months or declined in gross output over 3 consecutive years)
1,92,328 (13.98%) 6,30,568 (6.89%) 8,22,896 (7.82%) Reasons for sickness/incipient sickness: Lack of demand Short of working capital
1,11,508 (58%) 1,09,844 (57%) 4,35,151 (69%) 2,69,648 (43%) 5,46,629 (66%) 3,79,492 (46%)
Source: Final results, Third all India census of Small Scale Industries 2001-02, P-2
III.
COVERAGE
In the third census, the prevailing units permanently registered up to 31.3.2001 were covered on complete enumeration basis. A total of 22,62,401 units were surveyed. Out of these, 13,74,974 units were found to be working and the remaining 8,87,427 units were found closed. Thus, the number of working units works out to be 60.77% and those of closed 39.23%, are given in the figure no. 1 below.
Figure No.-1
Percentage of working and closed units in Registered SSI Sector
Source: Final results, Third all India census of Small Scale Industries 2001-02, P-2
IV.
COMPREHENSIVE POLICY
PACKAGE
672
Copyright © 2011-15. Vandana Publications. All Rights Reserved.
limit from Rs. 50 lakh to Rs. One crore to improve in competitiveness of small scale sector; (ii) providing credit linked capital subsidy of 12 per cent against loans for technology up gradation in specified industries; (iii) Conducting of the third Census of small scale industries; (iv) raising the limit of investment in industry related service and business enterprises from Rs. 5 lakh to Rs. 10 lakh; (v) Continuation of the ongoing scheme of granting Rs. 75,000 to each small-scale enterprises for obtaining ISO 9000 certification till the end of Tenth plan; (vi) SSI association encouraged to develop and operate testing laboratories. One time capital grant of 50 per cent will be given on reimbursement basis to such association after detailed examination of each case; (vii) Raising of the limit for composite loans from Rs. 10 lakh to Rs. 25 lakh; (viii) Constitution of group under the cabinet secretary to suggest /recommend streamlining of inspection and repeal of redundant laws and regulations applicable to the sector; (ix) Increasing the coverage of ongoing Integrated Infrastructure Development (IID) scheme to progressively cover all areas in the country with 50 per cent of plots earmarked for the tiny sector; and (x) Raising the family income eligibility limit from Rs. 24,000 to Rs. 40,000 per annum under the Prime Minister’s Rozgar Yojana (PMRY) which finances setting up of micro enterprises and generates employment for the educated unemployed.
V.
ECONOMIC REFORMATION AND
ITS IMPACT ON SMEs
Despite on elaborate and dynamic policy framework, the progress of Indian SSIs continues to be hindered by some of the basic constraints as product reservations, regulatory hassles—both at the entry and exit stages, insufficient finance at affordable terms, inflexible labour markets and infrastructure related problems-like high power tariff, and insufficient export infrastructure. The present study analyzes the impact of liberalization on India small scale industries, performance of SSI in pre and post liberalized period and focuses on policy changes which have opened new opportunities for this sector. The Central Statistical Organization (CSO) in the Ministry of Statistics & Programme Implementation has been conducting survey every year on organized manufacturing activities. This survey is called ‘Annual Survey of Industries (ASI)’. The ASI covers inter alia all the units registered under sections 2 (m) (i) and 2 (m) (ii) of the Factories Act. The coverage under the ASI includes manufacturing and repair & maintenance activities. Service sector is not covered in ASI.
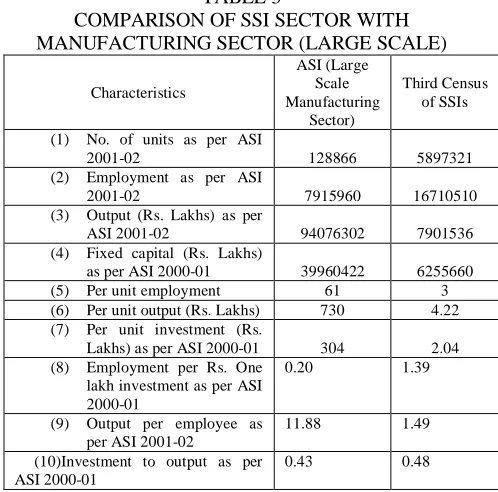
The results of Third census of SSIs in respect of manufacturing and repair & maintenance activities are compared with the ASI results in the following table 3. The latest final results available of ASI are of ASI 2000-01. However the CSO released Quick Estimates of ASI 2001-02. The quick Estimates covered information on
number of units, employment and output which could be compared with Third Census. With regard to fixed capital and other ratios relating to that, comparison with Third Census was made on the basis of results of ASI 2000-01.
The comparison of SSI Sector with large scale manufacturing sector covered through ASI reveals that the SSI sector is a better employment generating sector. Third Census showed that the employment generated by the SSI sector per Rs. One lakh investment was 1.39, as against only 0.20 in respect of ASI. This means that the organized sector requires an investment of Rs. 5 lakhs to generate employment to one person whereas the SSI sector generates employment for 7 persons with the same investment. With regard to investment-output ratio also, the SSI sector fared almost on par with the organized sector. The following table shows that an investment of about Rs. 43,000 was required in the organized sector to generate an output worth Rs. One lakh, whereas in SSI sector, marginally higher investment of Rs. 48,000 would be required to generate the same amount of output.
TABLE 3
COMPARISON OF SSI SECTOR WITH MANUFACTURING SECTOR (LARGE SCALE)
Characteristics
ASI (Large Scale Manufacturing
Sector)
Third Census of SSIs (1) No. of units as per ASI
2001-02 128866 5897321 (2) Employment as per ASI
2001-02 7915960 16710510 (3) Output (Rs. Lakhs) as per
ASI 2001-02 94076302 7901536 (4) Fixed capital (Rs. Lakhs)
as per ASI 2000-01 39960422 6255660 (5) Per unit employment 61 3 (6) Per unit output (Rs. Lakhs) 730 4.22 (7) Per unit investment (Rs.
Lakhs) as per ASI 2000-01 304 2.04 (8) Employment per Rs. One
lakh investment as per ASI 2000-01
0.20 1.39 (9) Output per employee as
per ASI 2001-02
11.88 1.49 (10)Investment to output as per
ASI 2000-01
0.43 0.48
Source: Final Results, Third All India Census of Small Scale Industries 2001-02, p-68.
673
Copyright © 2011-15. Vandana Publications. All Rights Reserved.
While it is natural to have a crisis perception among the SMEs in line with major changes in the economy, this need not lead to a real crisis situation in the short-run. The key to arresting the spread of such a crisis is the effectiveness of the policy instrument. The liquidity crisis, which is the more visible today, will naturally affect the whole company. However, the experience so far indicates that the SMEs are more affected than others. The regulatory instruments of the RBI and of the government, if properly implemented, can ensure that the pains of the crisis do not get transmitted significantly to the SMEs in the short run. While effects on the user industry, in others such as plastics, prices of basic raw materials have gone up prohibitively. Another critical area is infrastructure. Several states have a serious power crisis, with power cuts going up to 6 hours a day or even more. Policymakers in the government and Reserve Bank of India may be forced to choose selective Bank of India may be forced to choose selective measures to restrain the flow of capital that is beginning to disturb trade and commerce. And Foreign Funds are eyeing to swallow the record $22-billion F11 investments in the booming stock markets this years 2010, the RBI said it will “intervene if the inflows are lumpy and volatile.
Reasons for Sickness/Incipient Sickness: It is essential to know the reasons for sickness/incipient sickness for better policy information. Units satisfying one or more of the above criteria were treated by the enumerators as not having run satisfactorily and reasons were elicited. About 66% of the sick/incipient sick units were facing lack of demand, followed by 46% facing shortage of working capital and 36% facing marketing problems as given in table-4. The following table indicates the reasons given by the units suffering from sickness/incipient sickness.
TABLE-4
REASONS FOR SICKNESS/INCIPIENT SICKNESS
Reasons for Sickness/incipient sickness
Proportion of sick/incipient sick units Total SSI
Sector
Regd. SSI Sector
Unregd. SSI sector Lack of demand 66% 58% 69% Shortage of working
capital 46% 57% 43%
Non-availability of raw
materials 12% 12% 12%
Power shortage 13% 17% 12% Labor problems 5% 6% 4% Marketing problems 36% 37% 36% Equipment problems 11% 9% 12% Management problems 4% 5% 3%
Source: Final Results, Third All India Census of Small Scale Industries 2001-02, p-67.
VI.
SUGGESTIONS
1. Innovation Leads to Technological Development : “A nation has to evolve as a knowledge centre through innovation and creativity”, said the former president, Mr. A.P.J. Abdul kalam, at an event to mark the completion of 25 years of the networking solutions company MRO-TEK. “Innovation leads to technological development. One must innovate to differentiate, integrate society and bridge divide between people. Creativity involves reapplying existing ideas, accepting change and being flexible in outlook.” 2. Protecting Indigenous: NRDC: Having a unique
intellectual property right (IP) is the best way to start out on your entrepreneurial journey. But, not having one isn’t deterrent either. Now, specialize technologies developed by government R&D organizations and grow their businesses. The National Research Development Corporation (NRDC), a part of the ministry of Science and Technology, has got the mandate to develop and promote indigenous technology developed by universities, individual inventors and national R&D organizations.
3. To meet the challenges of Infrastructural Services: Infrastructure services that were affected by the slowdown in general economic activity during the previous year have gradually revived in the current fiscal with casing of supply bottlenecks in certain sectors and with demand recovery in others. However, considering the dimensions of the infrastructure capacity and services will need to be accelerated on big scale. 4. Clusterisation – key to economic progress: It is
seen that clusterisation in small-scale industries in the rural and semi urban areas, has a very important role to play in the economic development of those areas. Clusterisation provides economies of scale in business operations herby attracting efficient service providers for raw materials, transport, marketing etc. Clusterisation also facilitates provision of infrastructure, training facilities, information, technology and human resources. Interaction among the members of a cluster encourages innovation and competition leading to quicker response to market requirements.
674
Copyright © 2011-15. Vandana Publications. All Rights Reserved.
6.
Needed, More than FDI in Retail forEnhancement of FMCG: The Planning commission, the consumer affairs ministry and the agriculture ministry all agree that multi-brand retail must be opened to foreign investment. Let us hope the finance ministry too will make up its mind soon and the government will be in position to put a closure to the debate and allow foreign investment in organized retail. But the government would be deluding itself were it to believe that a policy on foreign investment in the sector would suffice to galvanize the supply, chain, excising layers of avoidable intermediation, waste, rent-seeking and inefficiency.
REFERENCES
[1] Mia shanley & Partrick Lannin, Stockholm—“Three share noble price in economics”,The Economic Times, New Delhi,Dt. 12 october 2010, p-1, c-1,2,3..
[2] P.N Dhar and H.F. Lydall, “The Role of small Enterprises in Economic Development Oxford University Press New Delhi, 1961, p-210.
[3] J.C.Sandesara, Size and Capital Intnsity in Indian Industry (Oxford University press Bombay, 1969). Also J.C.Sandesara, “The Small Industry Questions: Issues,Evidence and Suggestions” in A.K.Bagchi and N.Banerjee (eds.) Change and Choice in Indian Industry (Oxford University Press Calcutta, 1981).
[4] Bishwanath Goldar, “Relative Efficiency of Modern Small Scale Industries in India”, in K.B.Suri(ed.), Small-Scale Enterprises in Industrial Development: The Indian Experience (JOURNAL OF INDIAN SCHOOL OF POLITICAL ECONOMY, VOL-III, No.2 1988)
[5] Ramsinha K Asher, “Small Scale and Cottage Industries in India” in J.S Uppal (ed). India’s Economic Problems (Oxford University Press, delhi, (1987). See particularly P185-9+Table9.6/2.14/2.15/2.16.
[6] Small Industries Development Bank of India, SIDBI Report on Small Scale Industries Secotr 1999 (Lucknow, 1999).