Swapna et al. World Journal of Pharmaceutical and Life Sciences
FORMULATION AND EVALUATION OF FLOATING MICROSPHERES OF DIACEREIN
BY IONIC GELATION METHOD
Swapna S.*, V. Ananthnag, B. Meena, A. Manikya Veena, A. Snigha, A. Prasanna, Dr. Dibyalochan Mohanty and Dr. Vasudha Bakshi
Department of Pharmaceutics, Anurag Group of Institutions (Formerly Lalitha College of Pharmacy), Venkatapur, Medchal – 500088, Telangana, India.
Article Received on 03/05/2018 Article Revised on 24/05/2018 Article Accepted on 14/06/2018
INTRODUCTION
Oral route of drug administration is the most suitable and commonly used method of drug delivery but this route more often produces gastric emptying rate that varies from person to person with a short stomach transit time and the existence of large absorption window in the upper small intestine for several drugs.[1] Floating systems are low-density systems that have adequate buoyancy to float over the gastric content and remain buoyant in the stomach without affecting gastric emptying rate for a extended period of time, which results in a augmented gastric retention time and a better control of fluctuation in plasma drug concentration. After release of drug, the residual system is emptied from the stomach. These difficulties have encouraged researchers to design a drug delivery system which can stay in the stomach for prolonged and predictable period.[2] Attempts are being made to develop a drug delivery system which can provide therapeutically effective
plasma drug concentration for a longer period, thereby reducing the dosing frequency and minimizing fluctuation in plasma drug concentration at steady state by delivering the drug in a controlled and reproducible manner.
Diacerein is an anthrquimone drug that works by blocking the actions of interleukin-1 beta, a protein involved in the inflammation and destruction of cartilage that play a role in the development of symptoms of degenerative joint diseases such as osteoarthritis.
MATERIALS AND METHODS
Materials
Diacerein was procured as a gift sample from Azico Pharmaceutical Pvt Ltd., Hyderabad. HPMC K100 M, Calcium Chloride, Sodium bicarbonate, Sodium alginate was procured from SD Fine chem. Ltd., Mumbai.
World Journal of Pharmaceutical and Life Sciences
WJPLS
www.wjpls.org SJIF Impact Factor: 5.088
*Corresponding Author: Swapna S.
Department of Pharmaceutics, Anurag Group of Institutions (Formerly Lalitha College of Pharmacy), Venkatapur, Medchal – 500088, Telangana, India.
[1]
ABSTRACT
Background: Floating microspheres containing Diacerein were prepared by ionotropic gelation technique by using
HPMC (K 100 M), and sodium alginate as polymers, sodium bicarbonate as gas generating agent and calcium chloride as cross linking agent. Objective: To formulate a system to remain in the stomach for controlled and predictable period in order to enhance the drug bioavailability. Method: Totally 12 different formulations of Diacerein were prepared by using the above polymers. All formulations were evaluated for percentage yield, particle size, swelling index, entrapment efficiency, floating time and total floating time, Morphology of the microspheres and in-vitro drug release. Results: The percentage yield was found to be in the range of 45.0% to 80.62%.The average particle size was found to be in the range of 816 to 1292.7 μm. % Drug entrapment efficiency of Diacerein floating microspheres ranged from 27 % to 110 %. From the observations the total floating time was high for formulations F7, F8, F9.The swelling index of different formulations from F1 to F12 was found to be from 5 to 40%. The cumulative percent drug release of Optimized formulation F9 was found to be 95.42 % at 180 min. SEM study showed that pores were found on the surface of microspheres with a possible indication that the drug is released by diffusion mechanism. The ideal formulation, F9 followed first order kinetics and kosemeyers-peppas release model and value of "n," is calculated to be 0.7187 indicated that the drug release shows Non-Fickian diffusion. The formulation was stable at the end of 30 days with stability study. Conclusion: The optimized formulation showed good floating for > 3hrs. The formulation was stable at the end of 30 days with stability study.
KEYWORDS: Diacerein, Ionotropic gelation method, HPMC (K 100 M), Sodium Alginate, floating lag time,
Preparation of Floating Microspheres of Diacerein
For preparation of floating microspheres of Diacerein, HPMC K100 and Sodium alginate were passed through the sieve no 40. All the ingredients were mixed in the proportions shown in table 1. The floating microspheres
were prepared by ionotropic gelation method.[3] It was then collected by filtration and allowed to dry in a desiccator for about 24 hours. The formed microspheres were then subjected to evaluation studies.
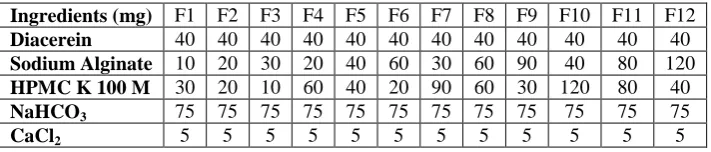
Table 1: Formulation Chart of Floating Microspheres of Diacerein.
Ingredients (mg) F1 F2 F3 F4 F5 F6 F7 F8 F9 F10 F11 F12
Diacerein 40 40 40 40 40 40 40 40 40 40 40 40
Sodium Alginate 10 20 30 20 40 60 30 60 90 40 80 120
HPMC K 100 M 30 20 10 60 40 20 90 60 30 120 80 40
NaHCO3 75 75 75 75 75 75 75 75 75 75 75 75
CaCl2 5 5 5 5 5 5 5 5 5 5 5 5
I. Pre formulation Parameters Drug purity studies
The purity of the obtained drug sample was determined by comparing the melting point of the obtained sample with that of the official standards.[4] The melting point of the drug was found to be 230oC.
Drug-Excipient Interaction studies
The infrared spectra of Diacerein pure drug, excipients, physical mixture of drug and excipients (optimised formula) were recorded between 500-4000cm-1. The FTIR spectra were obtained using KBr disk method using an Fourier transform Infrared spectroscopy (FTIR) spectrophotometer [5].
II. Post formulation parameters Percentage yield
The percentage yield of Diacerein in the formulated product is determined by using the formula:
Weight of the formulation
X 100
Theoretical weight of drug and polymer
Particle size
The test is performed to determine the uniformity of the prepared formulation. The particle size of the each formulation was determined using optical microscopy technique were diameter of 100 particles each was recorded to determine the average particle size of each formulation.[6]
Floating lag Time
The time taken by the microspheres to emerge onto the surface of the liquid after adding to the dissolution medium simulated gastric fluid without pepsin, at pH 1.2, temperature 37oC with paddle rotation at 50 rpm it is measured using stopwatch.[7]
Total floating time: The time taken by the microspheres
to float constantly on the surface of the gastric fluid without pepsin, at pH 1.2, temprature37oC, paddle rotation at 50 rpm, it is measured using stopwatch.[8]
Determination of swelling index
The swelling index of a dosage unit was measured by studying its weight gain. The swelling index of a
microspheres was determined by placing the microspheres in 10ml 0.1N HCl in a petri dish.[9] After every one hour up to 12 hours, each microspheres was removed and blotted with tissue paper to remove the excess water and weighed on the balance. The experiment was performed in triplicate for each time point. The swelling index is expressed as a percentage and was calculated from the equation
Swelling index (S.I) = {(Wt-Wo/Wo} x 100
Where, Wt = Weight of microspheres at time t Wo = weight of microspheres before immersion.
Drug Entrapment Efficiency
The drug entrapment efficiency of the prepared formulations was determined by taking 20mg of the prepared microspheres and triturating with 100ml of 0.1N HCl and allowed to stand.[10] The concentration of the drug present is calculated by recording the absorbance and concentration of each formulation. The total drug entrapment efficiency was determined using the formula,
Concentration of drug in sample
X100
Total concentration of drug
Drug Dissolution studies
Dissolution test was carried out using USP XX1V (model DISSO, M/s. Labindia) rotating paddle method (apparatus 2). The stirring rate was 50 rpm. 0.1 N HCL was used as dissolution medium (900ml). It was maintained at 37 + 5 c .samples of 5 ml were withdrawn at predetermined time intervals, filtered and replaced with 5ml of fresh dissolution medium[11]. The collected samples were suitably diluted with dissolution fluid, wherever necessary and were analyzed for the Diacerein 268nm by using a double beam UV spectrometer (Labindia-3000). Each dissolution study was performed for three times and the mean values were taken. % drug release was calculated using simultaneous equation method.
Shape and Surface Morphology (SEM)
Kinetics and Mechanism of Release Analysis
To study the release kinetics, the data obtained from in
vitro drug release studies were plotted in various order of
reactions and kinetic models such as Zero order, First order and Higuchi’s model, Hixson-Crowell cube root law, Korsmeyer peppas model.[13]
Stability Studies
The stability studies of optimized formulations F9 was carried out at accelerated condition of 40˚C ± 2˚C, 75% RH conditions for a period of 1 months.[14] The microspheres were withdrawn at every week and evaluated for the percent entrapment efficiency. Samples were analyzed after 1 month for their entrapment efficiency.
RESULTS AND DISCUSSION
Microspheres of Diacerein were formulated using Sodium alginate and HPMC K100M by ionotropic
gelation method. The determination of purity was determined using a simple melting point apparatus and compared with that of the official standards. The melting point of the sample drug Diacerein was found to be 230oC.
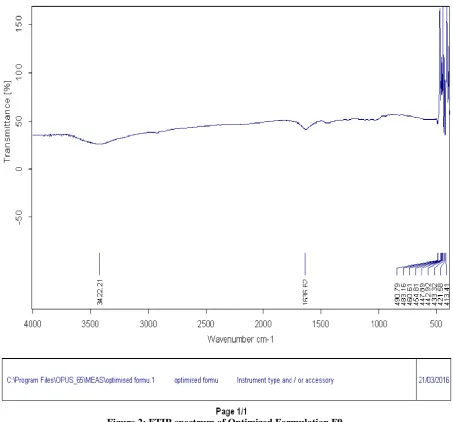
The spectral observations indicated that the principle IR absorption peaks observed in the spectra of the drug were close to those in the spectra of the microspheres indicates that there is no interaction between the drug and the polymer (Figure 1 & 2). The identical peaks corresponding to the functional groups and features confirm that neither the polymer nor the method of preparation has affected the drug stability.
Figure 2: FTIR spectrum of Optimized Formulation F9.
Percentage yield of all formulations from F1 to F12 were calculated and it was observed that as the polymer ratio in the formulation increases, the product yield also increases. The percentage yield was found to be in the range of 45.0% to 80.62% (Table 2).
Particle size analysis of different formulations was done by optical microscopy. The average particle size was found to be in the range of 816 to 1292.7 μm (Table 2). The mean particle size was significantly varied according to type of polymer used for the preparation of microspheres; this may be due to the fact that difference in the viscosity of the polymer solution. Since high viscosity of the polymer solution requires high shearing energy for breaking of droplets of the emulsion.
% Drug entrapment efficiency of Diacerein floating microspheres ranged from 27 % to 110 %. The drug entrapment efficiency of the prepared microspheres increased progressively with an increase in proportion of the polymers (Table 2).
The swelling index of different formulations from F1 to F12 was found to be from 5 to 40% (Table 2). Maximum swelling was observed with the F12 formulation containing sodium alginate and HPMC as polymers.
Table 2: Results of Percentage yield, Average particle size, % EE, % Swelling Index, Floating lag time, Total floating time.
Formulation Code
Percentage Yield
Average
Particle Size % EE
% Swelling Index
Floating Lag
Time Total Floating Time
F1 13.70% 797.6µm 75% 5 5 sec 45 minutes F2 13.90% 956.0 µm 95% 15 7sec 40 minutes F3 17.80% 819.2 µm 27.5% 5 5sec 1 hour 25 minutes F4 24.08% 862.0 µm 56.25% 5 No floating -
F5 16.37% 849.0 µm 29.75% 0 5sec 48 Minutes F6 19.80% 906.0 µm 42.5% 0 5sec 2 hours51 minutes F7 24.20% 764.6 µm 50% 35 5sec >3 hours F8 17.90% 767.3 µm 40% 30 5sec >3 hours F9 26.70% 816.2 µm 56% 10 5sec >3 hours F10 21.80% 1292.7 µm 110% 20 No floating - F11 13.80% 1112.0 µm 45% 10 No floating - F12 28.60% 1216.7 µm 37.5% 40 No floating -
Morphology of the microspheres was investigated by Scanning Electron Microscopy. The results from SEM studies revealed that the microspheres of formulation F9 were spherical in shape with a rough outer surface morphology which might be due to surface associated
drug (Figure 3). SEM study showed that pores were found on the surface of microspheres with a possible indication that the drug is released by diffusion mechanism.
Figure 3: SEM photograph of Optimized Formulation F9.
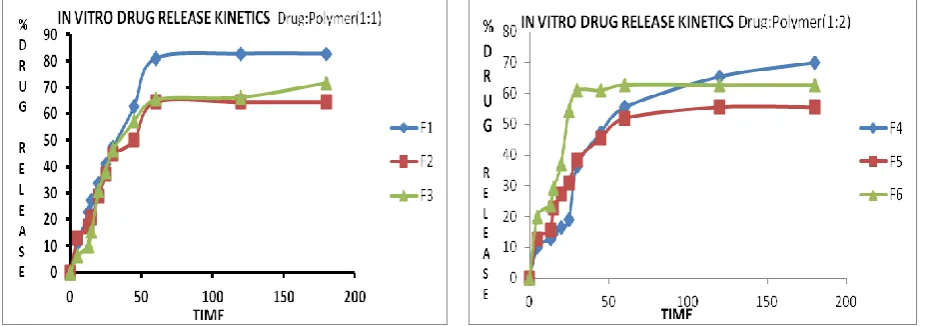
In-vitro dissolution study of Diacerein from prepared
microspheres exhibited a biphasic mechanism. The release of Diacerein from microspheres was characterized by an initial phase of burst effect (higher release), which was due to the presence of drug particles on the surface of the microspheres followed by a second phase of moderate release. The initial burst effect may be
attributed as a desired effect to ensure initial therapeutic plasma concentration of the drug. It has been observed that the sustained release action was higher in formulations containing higher concentration of the rate controlling polymers. The cumulative percent drug release of Optimized formulation F9 was found to be 95.42 % at 180 min.
Figure 4-7: Invitro release profile of Diacerein floating microspheres of F1-F12.
The release data of Diacerein were processed into graphs to understand the linear relationship, i.e., Kinetic principles. The data were processed for regression analysis using MS-Excel statistical functions. Considering the correlation coefficient (R2) values obtained showed that all the formulations (F1 to F12) had highest R2 values for First order plots indicating that the dissolution data fits into First order equation (Table
3). To study the release mechanisms of Diacerein from the formulations the data of in- vitro drug release was verified using Higuchi’s, Korsmeyer- Peppas, and Hixson-Crowell cube root law models. The drug release from the most of the all formulations (F1 to F12) was found to follow kosemeyers-peppas release model. The formulation was stable at the end of 30 days with stability study.
Table 3: Mechanism of Drug Release.
Formulation Code
Regression coefficient of Higuchi Model
Regression coefficient of Hixson Crowell model
Korsemeyer Peppas model
Order of release Regression
coefficient n value
F9 0.772 0.733 0.819 0.718 Non-Fickian diffusion
CONCLUSION
Formulation F9 showed good results with respect to the various evaluation parameters, so it was selected as the optimized formulation. From the Pre-formulation studies for drug excipient compatibility it was observed that there was no physical incompatibility between the drug and other excipients. All formulations were evaluated for percentage yield, particle size, swelling index, entrapment efficiency, floating time and total floating time. The results indicated that the final blend of both drugs and excipients showed sustained release characters. All formulations were tested for drug content and drug release, all estimated parameters were found to be within the limits, thus indicating that all the prepared formulations were good. All formulations were tested for buoyancy properties like floating lag time & total floating time. All formulations showed satisfactory results except for F4, F10, F11, F12 showed no floating. The formulation was stable at the end of 30 days with stability study
ACKNOWLEDGEMENT
With a deep sense of appreciates, we acknowledge the Anurag Group of Institutions (AGI), Venkatapur, Ghatkesar, Telangana State. It was an inspirational
practice to work under Institute and we shall remain grateful to the Dr.Vasudha Bakshi, Dean of Pharmacy and P.Rajeshwar Reddy, Chairman of AGI.
REFERENCES
1. Kumar KR. Floating Microspheres: A Novel Approach in Drug Delivery. J Drug Delivery Res., 2012; 1(4): 1-20.
2. Manivannan R, Baig MA, Purushothaman M, Kumar NS. Formulation and Evaluation of Eletriptan Hydrobromide Microspheres by using Natural Polymers. Int J Pharm Drug Analysis, 2014; 2(3): 347-53.
3. Revathi S, Madhulatha V, Dhanaraju MD. Formulation and Evaluation of Stavudine loaded Sodium Alginate Beads by Ionotropic Gelation Method. Int Res J Pharm, 2014; 5(9): 706-12. 4. Fries A, Anthony RW, Cseko A, Gaither CC,
Schulman E .The price and purity of illicit drugs: IDA-P-4332. Institute for Defense Analyses, Virginia, USA, 1981-2007.
6. Lachman L, Liberman HA, Kang JL. The theory and practice of industrial pharmacy. 3rd ed. Varghese publication house, 1991; 296-302.
7. Rouge N, Buri P, Doelker E. Drug absorption sites in the gastrointestinal tract and dosage forms for site-specific delivery. Int J Pharm, 1996; 136: 117-139.
8. Bulgarelli E, Forni F, Bernabei MT. Effect of matrix
composition and process conditions on casein-gelatin beads floating properties. Int J Pharm, 2000; 198: 157-165.
9. Singh BM, Kim KH. Floating drug delivery
systems: an approach to oral controlled drug delivery via gastric retention. J Control Rel, 2000; 63: 235- 259.
10. Amit Kumar Nayak, Ruma Maji, Biswarup Das. Gastro retentive drug delivery systems: a review, Asian Journal of Pharmaceutical and Clinical Research, 2010; 3(1): 2-10.
11. Manisha P, Ranjava G, Ashok R, Kymonil KM, Subhini SA. Controlled release theophylline loaded buoyant sodium alginate microbeads for prolonged drug delivery to gastric mucosa. J pharm Res., 2010; 3: 758-762.
12. Choi, B. Y., Park, H. J., Hwang, S. J., & Park, J. B. Preparation of alginate beads for floating drug delivery system: effects of CO2 gas-forming agents.
International Journal of Pharmaceutics, 2002; 239: 81–91.
13. Ma, N., Xu, L., Wang, Q., Zhang, X., Zhang, W., Li, Y. & Li, S. Development and evaluation of new sustained-release floating microspheres. International Journal of Pharmaceutics, 2008; 358: 82–90.