The Thirty-Third AAAI Conference on Artificial Intelligence (AAAI-19)
A Novel Framework for Robustness Analysis of Visual QA Models
Jia-Hong Huang,
1,2Cuong Duc Dao,
1,*Modar Alfadly,
1,*Bernard Ghanem
1 1King Abdullah University of Science and Technology,2National Taiwan University*Authors contributed equally to this work
[email protected], [email protected], [email protected], [email protected]
Abstract
Deep neural networks have been playing an essential role in many computer vision tasks including Visual Question An-swering (VQA). Until recently, the study of their accuracy was the main focus of research but now there is a trend toward assessing the robustness of these models against adversarial attacks by evaluating their tolerance to varying noise levels. In VQA, adversarial attacks can target the image and/or the
proposedmain questionand yet there is a lack of proper
anal-ysis of the later. In this work, we propose a flexible frame-work that focuses on the language part of VQA that uses
se-mantically relevant questions, dubbedbasic questions, acting
as controllable noise to evaluate the robustness of VQA mod-els. We hypothesize that the level of noise is negatively corre-lated to the similarity of a basic question to the main question. Hence, to apply noise on any given main question, we rank a pool of basic questions based on their similarity by casting
this ranking task as aLASSOoptimization problem. Then,
we propose a novel robustness measureRscoreand two
large-scale basic question datasets (BQDs) in order to standardize robustness analysis for VQA models.
1
Introduction
Visual Question Answering (VQA) is one of the most chal-lenging computer vision tasks in which an algorithm is given a natural language question about an image and tasked with producing an answer for that image-question pair. Re-cently, various VQA models (Antol et al. 2015; Malinowski, Rohrbach, and Fritz 2015; Noh, Hongsuck Seo, and Han 2016; Wu et al. 2016; Lu et al. 2016; Li and Jia 2016; Ben-younes et al. 2017; Fukui et al. 2016; Kim et al. 2017) have been proposed to tackle this problem, and their main performance measure is accuracy. In general, any model must have in some sense few aspects of quality relevant to the problem it solves. Accuracy, robustness, stubbornness, and myopia are some examples of such qualities for VQA models that were studied by the community (Agrawal, Ba-tra, and Parikh 2016). Obviously, some qualities are more important than others and an overall evaluation of a model should rationalize the interactions of these qualities if pos-sible. In this work, we are interested only in the robustness of VQA models to smallnoiseorperturbationto the input question, dubbed main question (MQ).
Copyright c2019, Association for the Advancement of Artificial
Intelligence (www.aaai.org). All rights reserved.
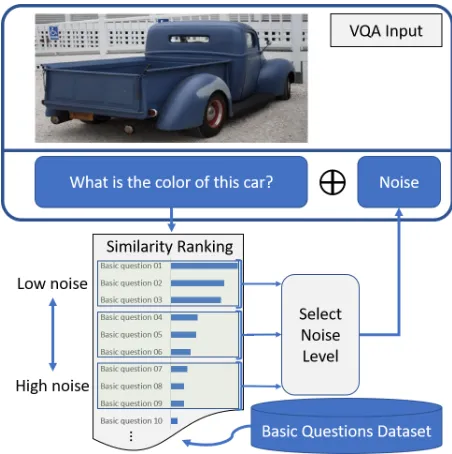
Figure 1: More robust models tolerate larger noise levels. Thus, To assess the robustness of VQA models, we apply noise at a controllable level to the main question. We sort a dataset of basic questions based on their similarity to the main question and append three basic questions at a time as noise. The robustness is then measured byRscore as the deterioration in accuracy over a given testing dataset.
Motivation
Assumptions
Robustness to some noises (e.g., motion blur in images) is more important than others (e.g., salt and pepper) because they are more common. Additionally, some noises have con-trollable strength, which allows for more sophisticated ro-bustness measures (e.g., area under the performance curve versus noise level). In this work, we are establishing a frame-work for analyzing robustness against a type ofcontrollable additive noisethat is relevant to VQA but is not common. Namely, plain-text concatenation of the MQ with semanti-cally similar questions, dubbed basic questions (BQs); refer to Figure 1 for a visual illustration. The approach, of consid-ering those BQs as noise, and similar concepts have merit to them and they are studied in-depth in psychology under “de-ductive reasoning in human thinking” despite being a con-troversial topic (Rips 1994). For instance, a person quizzed on the “color of the bus” in an image of a car will write down the color of the car while acknowledging the discrepancy. Comparably, if they were asked multiple similar questions, they might be unhinged but answer correctly nevertheless.
Robustness Evaluation Framework
Figure 1, depicts the noise generation part of our robustness evaluation. Given a plain-text question (i.e., the MQ) and a plain-text basic questions dataset (BQD), we start by ranking the BQs in BQD by their similarity to the MQ using some text similarity ranking method; we formulate this ranking as LASSO optimization problem. Then, depending on the re-quired level of noise, we take the top,e.g.n = 3, ranked BQs and we append them one after the other. The concatena-tion of these BQs with MQ is the generated noisy quesconcatena-tion. To measure the robustness of any VQA model, the accuracy over a testing dataset with and without adding this generated noise is compared using our proposedRscore.
This framework is posed such that extrapolating to other types of noise is straightforward. For example, question-words-shuffling noisecan be controlled by the hamming dis-tance (e.g., the larger the hamming distance the higher level of noise) whereasquestion-rephrasingis a noise that is not trivially controllable. We apply the noise of choice to the questions in a testing dataset, then evaluate the deterioration in accuracy usingRscore. A more comprehensive robustness evaluation of a VQA model should employ multiple types of noise, possibly ones that could be jointly applied on the image and the MQ at the same time.
Contributions
i We propose a novel framework to measure the robust-ness of VQA models and test it on six different models.
ii We propose a new text-based similarity ranking method, i.e. LASSO, and compare it against BLEU-1, BLEU-2, BLEU-3, BLEU-4 (Papineni et al. 2002), ROUGE (Lin 2004), CIDEr (Vedantam, Lawrence Zitnick, and Parikh 2015) and METEOR (Banerjee and Lavie 2005).
iii We provide the similarity ranking of two large-scale BQDs to test the robustness of VQA models: Gen-eral Basic Question Dataset (GBQD) and Yes/No Basic Question Dataset (YNBQD).
2
Related Work
There is a big effort from the community to tackle the prob-lem of VQA (Kiros, Salakhutdinov, and Zemel 2014; Gao et al. 2015; Xiong, Merity, and Socher 2016; Huang, Alfadly, and Ghanem 2017a; 2017b). It is a multidisciplinary task that involves natural language progressing (NLP), computer vision and machine learning.
Sentence Evaluation Metrics
Sentence evaluation metrics have been widely used in dif-ferent areas such astext summarizationandmachine trans-lation. In our work, we exploit these metrics to measure the similarity between the MQs and the BQs. BLEU (Pa-pineni et al. 2002) is one of the most popular metrics in machine translation that is based on precision. However, its effectiveness was questioned by (Elliott and Keller 2013; Kulkarni et al. 2011). METEOR (Banerjee and Lavie 2005), however, is based on precision and recall. In addition, ROUGE (Lin 2004) is a popular recall-based metric in the text summarization. It tends to reward longer sentences with higher recall. Moreover, a consensus-based metric, CIDEr (Vedantam, Lawrence Zitnick, and Parikh 2015), rewards a sentence for being similar to the majority of descriptions written by a human. In our experiments, we take all of the aforementioned metrics to rank BQDs, and our experimen-tal results show that our proposed LASSOranking method achieves better ranking performance.
Sentence Embedding
There exists many method that analyze the relationship be-tween words, phrases and sentences by mapping text into some latent vector spaces (Pennington, Socher, and Man-ning 2014; Kiros et al. 2015; Mikolov et al. 2013). It was shown that if two phrases share the same context in the cor-pus, their embedded vectors will be close to each other in the latent space. Skip-thoughts (Kiros et al. 2015) can map text to embedding space using an encoder-decoder architec-ture of recurrent neural networks (RNNs). The encoder is an RNN with gated recurrent unit (GRU) activation (Chung et al. 2014). While the decoder is an RNN with a conditional GRU. We use this model because it performs well on em-bedding long sentences.
Attention Mechanism in VQA
Attention-based VQA models can attend to local image re-gions related to the query question (Shih, Singh, and Hoiem 2016; Chen et al. 2016; Yang et al. 2016; Li and Jia 2016). In the pooling step of (Li and Jia 2016), the authors use an image-attention mechanism to help determine the relevance of updated question representations to the original. As far as we know, no work has tried to apply the mechanism of language attention to VQA models before (Lu et al. 2016). They propose a mechanism of co-attention that jointly per-forms language and image attention.
Multiple Modality Fusion Approaches in VQA
task. The authors of (Kiros, Salakhutdinov, and Zemel 2014; Ben-younes et al. 2017; Fukui et al. 2016; Kim et al. 2017) have tried to focus on modeling the interactions between two different embedding spaces. In (Kiros, Salakhutdinov, and Zemel 2014), the authors demonstrate the success of the bilinear interaction between two embedding spaces in deep learning for fine-grained classification and multimodal language modeling. Multimodal Compact Bilinear (MCB) pooling (Fukui et al. 2016) exploits an outer product be-tween visual and textual embedding. Moreover, Multimodal Low-rank Bilinear (MLB) pooling (Kim et al. 2017) uses a tensor to parametrize the full bilinear interactions between question and image spaces. MCB and MLB are efficiently generalized in (Ben-younes et al. 2017).
Robustness of Neural Network
In (Fawzi, Moosavi Dezfooli, and Frossard 2017), the au-thors analyze the robustness of deep models by adding some perturbations into images and observe how the prediction re-sult is affected. In (Kafle and Kanan 2017), the authors men-tion that VQA models can produce different answers by us-ing slight variations of a query question implyus-ing that VQA models do not actually comprehend the asked question.
3
Methodology
Our goal is to evaluate the robustness of VQA models over the MQs in the testing set of the popular VQA dataset (An-tol et al. 2015). For each (image, MQ) pair in the testing set, we concatenate to MQ the most three similar questions (i.e., BQs) to MQ, obtained by a certain similarity ranking method, over a large-scale basic questions dataset (BQD) as in Figure 1. Finally, we compute the accuracy before and af-ter adding this noise and compare them usingRscore. In this section, we will go through the details of this procedure.
Datasets Preparation
Our BQD is the combination of only unique questions from the training and validation sets of “real images” inthe VQA dataset(Antol et al. 2015), which is a total of186027 ques-tions. However, because there will be questions in the testing set of244302questions that is also in this BQD, we will ex-clude them only when executing the similarity ranking.
We will need feature representations of our questions in both the testing set and the BQD. We will use the Skip-thought vector (Kiros et al. 2015) which exploits an RNN encoder with GRU (Chung et al. 2014) activation to map any English sentence to a feature vectorv∈R4800.
Similarity Ranking
We can project the problem of finding similar questions to a given MQ using this BQD and a similarity ranking method. We will consider two categories of question similarity rank-ing methods;direct similarityandsparse combination.
Direct Similarity We will need a text similarity (or dis-similarity) scoring method, that takes two sentences and re-turn a similarity (or dissimilarity) score of how “close” (or “far”) are those two semantically from each other. By com-puting the score of a given MQ to all BQs in the BQD we can
directly rank the questions from the most to the least similar. Here, we will use seven scoring methods; 1, BLEU-2, BLEU-3, BLEU-4, ROUGE, CIDEr and METEOR.
Sparse Combination We will need the feature represen-tations of all the questions and a distance measure to de-termine a sparse combination of BQs needed to represent a given MQ. This can be modelled as follows:
min
x distance(Ax,b) +λkxk1, (1) wherebis the feature vector of the MQ,Ais the matrix of feature vectors of all questions in BQD as its columns, and λis a trade-off parameter that controls the sparsity of the solution. Note that all these vectors are normalized to a unit `2-norm. To cast this as aLASSOoptimization problem
distance(q,p) = 1
2kq−pk
2 2
Different distance metric could give different results espe-cially if they make sense for the latent embedding space. The ith element of the solutionxis the similarity score of the BQ encoded in theithcolumn ofA. We reiterate the im-portance of making sure thatbis not one of the columns of A. Otherwise, and because we are encouraging sparsity, the ranking will give all other BQs a zero similarity score.
Robustness Evaluation
In the VQA dataset (Antol et al. 2015), a predicted answer can be considered partially correct if it matched the answers of less than three human annotators. The overall accuracy is:
AccuracyVQA= 1
N N X
i=1
min
P
t∈TiI[ai=t] 3 ,1
(2)
whereI[·] is the indicator function,N is the total number
of examples, ai is the predicted answer, andTi is human
annotators answer set of theithimage-question pair.
TheRscore of VQA Models First, we measure the accu-racy of the model on the clean testing set and denote it as AccVQA. Then, we append the top rankedkBQs to each of the MQs and recompute the accuracy of the model on this noisy dataset and we call it AccBQD. Finally, we compute the absolute difference Accdiff = |AccVQA−AccBQD|and report the robustness
Rscore=clamp10
√m−√Acc
diff
√ m−√t
(3)
Here, we apply this min-max clipping of the score
clampba(x) = max (a,min (b, x))
Basic Questions Datasets
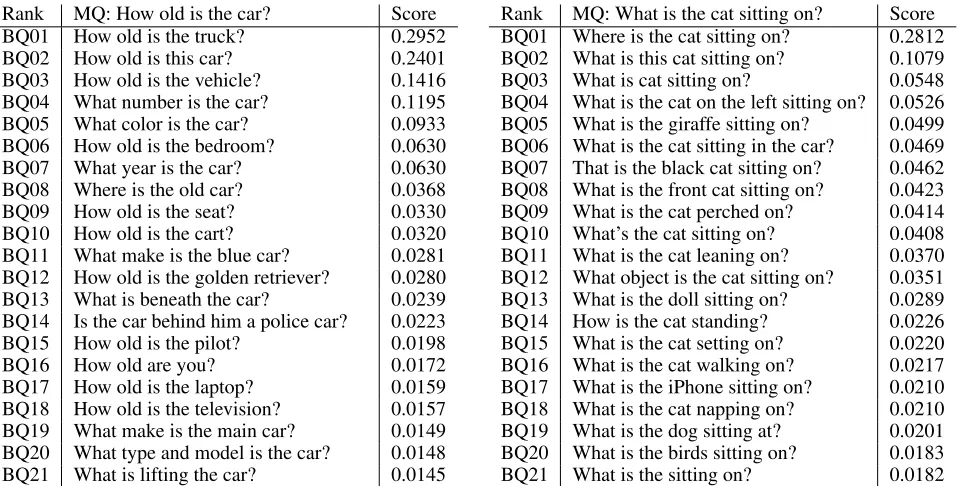
The size of the BQD has a great impact on the noise gen-eration method. Basically, the more questions we have, the more chance it has to contain similar questions to any given MQ. On the other hand, solving Eq 1 for each question in the VQA testing set of 244302 questions for the 186027 unique questions in both training and validation set can be-come computationally expensive. Luckily, we need to do it at most once. We setλ= 10−6and keep the top-kBQs for each MQ produced by solving Eq 1, wherek = 21. The resultant BQD will have244302instance of this format:
{Image, M Q, 21 (BQ+corresponding similarity score)}
We keep the same output 10 answers, annotated by differ-ent workers through AMT (Amazon Mechanical Turk), for each instance as specified by the VQA dataset (Antol et al. 2015) in the open-ended and multiple-choice (18 choice) tasks. Approximately90%of the answers only have a sin-gle word and98%of the answers have no more than three words. In addition, these datasets contain81434testing im-ages from the MS COCO dataset (Lin et al. 2014).
Because most of the VQA models have the highest ac-curacy performance in answering yes/no questions, we have collected two BQDs; Yes/No Basic Question Dataset (YN-BQD) and General Basic Question Dataset (G(YN-BQD). Now, in practice, our proposed BQDs can be used directly to test the robustness of VQA models without running theLASSO ranking method again. In our experiments, we will compare usingLASSO(i.e.,sparse combination) to using other seven direct similaritymetrics in building BQDs.
4
Experiments and Analysis
To analyze our proposed framework, we will perform our experiments on six VQA models; LQI denoting LSTM Q+I (Antol et al. 2015), HAV denoting HieCoAtt (Alt, VGG19) and HAR denoting HieCoAtt (Alt, Resnet200) (Lu et al. 2016), MU denoting MUTAN without Attention and MUA denoting MUTAN with Attention (Ben-younes et al. 2017), and MLB denoting MLB with Attention (Antol et al. 2015). On top of that, we will limit ourselves to the open-ended task on the test-dev partition from the 2017th VQA Challenge (Antol et al. 2015), denoted here as dev, unless otherwise specified like using the test-std partition, denoted std.
Comparing Similarity Ranking Methods
In addition to building GBQD and YNBQD usingLASSO, we also generate them using the other similarity metrics (i.e., BLEU-1, BLEU-2, BLEU-3, BLEU-4, ROUGE, CIDEr and METEOR) as described in the Methodology section. Then, for each MQ, we split the top-21 ranked BQs into seven par-tition each of which contains three consecutive BQs to con-trol the noise level. More concretely, partition 1, which is (BQ1, BQ2, BQ3), has smaller noise than partition 7, which is (BQ19, BQ20, BQ21), as illustrated in Figure 1, with par-tition 0 being the empty parpar-tition. Finally, some VQA mod-els limit the number of words in the MQ, which might lead to trimming the appended noise (i.e.the BQs in the partition).
0 1 2 3 4 5 6 7
0 2 4 6 8 10 12 14 16 18 20
Accuracy decrement (%)
0 = MQ only ; 1 = First top 3 ; 2 = Second top 3 ; ... ; 7 = Seventh top 3
LSTM Q+I MUTAN witout Attention MUTAN with Attention MLB with Attention HieCoAtt-Alternating-Res200 HieCoAtt-Alternating-VGG19
0 1 2 3 4 5 6 7
35 40 45 50 55 60 65 70 Accuracy (%)
MLB with Attention MUTAN with Attention HieCoAtt-Alternating-Res200 HieCoAtt-Alternating-VGG19 MUTAN witout Attention LSTM Q+I
(a) LASSO GBQD
0 1 2 3 4 5 6 7
0 2 4 6 8 10 12 14 16 18 20
Accuracy decrement (%)
0 = MQ only ; 1 = First top 3 ; 2 = Second top 3 ; ... ; 7 = Seventh top 3
LSTM Q+I MUTAN with Attention MUTAN witout Attention MLB with Attention HieCoAtt-Alternating-VGG19 HieCoAtt-Alternating-Res200
0 1 2 3 4 5 6 7
35 40 45 50 55 60 65 70 Accuracy (%)
MLB with Attention HieCoAtt-Alternating-Res200 HieCoAtt-Alternating-VGG19 MUTAN with Attention MUTAN witout Attention LSTM Q+I
(b) LASSO YNBQD
Figure 2: Compares the accuracy of six VQA models with increasing noise levels from both GBQD and YNBQD. The x-axis is the partition index with 0 meaning MQ without noise. We can see a monotonous trend as the noise increases.
Figure 2 shows the accuracy of the six VQA models with the noise coming from GBQD and YNBQD generated by our proposedLASSOsimilarity ranking method. We can see that the accuracy is decreasing as the partition index in-creases,i.e.confirming our assumption of treating these BQs as noise and that the noise level is increasing as the similarity score of the BQs decreases. However, we repeated the same experiments on GBQD generated by the other similarity ranking methods in Figure 3 and we couldn’t see this trend anymore. The plots became less monotonous and acting ran-domly as we move from partition 1 to partition 7. Also, we observe a big drop in accuracy starting from partition 1 ren-dering these similarity measures ineffective in this context. In spite of that, various work (Xu et al. 2015; Mostafazadeh et al. 2016; Karpathy and Fei-Fei 2015; Vinyals et al. 2015; Fang et al. 2015) still use them for sentence similarity evalu-ation because of their simple implementevalu-ation. This fact sig-nifies the need to develop better similarity metrics, which in turn can be directly evaluated using this flexible framework.
Evaluating
R
scorewith
LASSO
Ranking
(a) ROUGE, BLEU-4, BLEU-3, BLEU-2 and BLEU-1
1 2 3 4 5 6 7
9 9.5 10 10.5 11 11.5 12
Accuracy (%)
MUTAN with Attention MLB with Attention HieCoAtt-Alternating-Res200 HieCoAtt-Alternating-VGG19 MUTAN witout Attention LSTM Q+I
1 2 3 4 5 6 7
0 5 10 15
Accuracy (%)
1 = Partition-1 ; 2 = Partition-2 ; ... ; 7 = Partition-7
MUTAN with Attention MLB with Attention HieCoAtt-Alternating-Res200 HieCoAtt-Alternating-VGG19 MUTAN witout Attention LSTM Q+I
(b) CIDEr (c) METEOR
Figure 3: Compares the accuracy of six VQA models with increasing noise levels from GBQD generated by BLEU-1, BLEU-2, BLEU-3, BLEU-4, ROUGE, CIDEr and METEOR. We could not observe a trend as the noise level increase like in Figure 2.
Rank MQ: How old is the car? Score BQ01 How old is the truck? 0.2952
BQ02 How old is this car? 0.2401
BQ03 How old is the vehicle? 0.1416 BQ04 What number is the car? 0.1195 BQ05 What color is the car? 0.0933 BQ06 How old is the bedroom? 0.0630 BQ07 What year is the car? 0.0630 BQ08 Where is the old car? 0.0368
BQ09 How old is the seat? 0.0330
BQ10 How old is the cart? 0.0320
BQ11 What make is the blue car? 0.0281 BQ12 How old is the golden retriever? 0.0280 BQ13 What is beneath the car? 0.0239 BQ14 Is the car behind him a police car? 0.0223 BQ15 How old is the pilot? 0.0198
BQ16 How old are you? 0.0172
BQ17 How old is the laptop? 0.0159 BQ18 How old is the television? 0.0157 BQ19 What make is the main car? 0.0149 BQ20 What type and model is the car? 0.0148 BQ21 What is lifting the car? 0.0145
Rank MQ: What is the cat sitting on? Score BQ01 Where is the cat sitting on? 0.2812 BQ02 What is this cat sitting on? 0.1079 BQ03 What is cat sitting on? 0.0548 BQ04 What is the cat on the left sitting on? 0.0526 BQ05 What is the giraffe sitting on? 0.0499 BQ06 What is the cat sitting in the car? 0.0469 BQ07 That is the black cat sitting on? 0.0462 BQ08 What is the front cat sitting on? 0.0423 BQ09 What is the cat perched on? 0.0414 BQ10 What’s the cat sitting on? 0.0408 BQ11 What is the cat leaning on? 0.0370 BQ12 What object is the cat sitting on? 0.0351 BQ13 What is the doll sitting on? 0.0289 BQ14 How is the cat standing? 0.0226 BQ15 What is the cat setting on? 0.0220 BQ16 What is the cat walking on? 0.0217 BQ17 What is the iPhone sitting on? 0.0210 BQ18 What is the cat napping on? 0.0210 BQ19 What is the dog sitting at? 0.0201 BQ20 What is the birds sitting on? 0.0183 BQ21 What is the sitting on? 0.0182
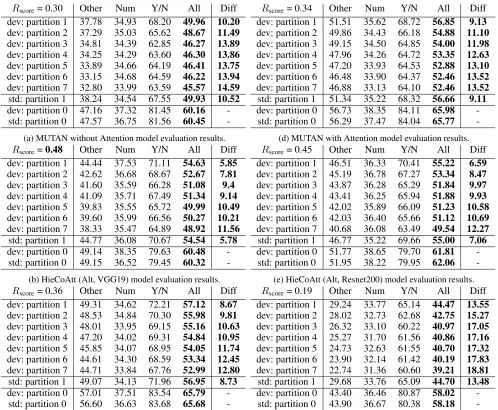
Rscore= 0.30 Other Num Y/N All Diff dev: partition 1 37.78 34.93 68.20 49.96 10.20
dev: partition 2 37.29 35.03 65.62 48.67 11.49
dev: partition 3 34.81 34.39 62.85 46.27 13.89
dev: partition 4 34.25 34.29 63.60 46.30 13.86
dev: partition 5 33.89 34.66 64.19 46.41 13.75
dev: partition 6 33.15 34.68 64.59 46.22 13.94
dev: partition 7 32.80 33.99 63.59 45.57 14.59
std: partition 1 38.24 34.54 67.55 49.93 10.52
dev: partition 0 47.16 37.32 81.45 60.16 -std: partition 0 47.57 36.75 81.56 60.45
-(a) MUTAN without Attention model evaluation results.
Rscore=0.48 Other Num Y/N All Diff dev: partition 1 44.44 37.53 71.11 54.63 5.85
dev: partition 2 42.62 36.68 68.67 52.67 7.81
dev: partition 3 41.60 35.59 66.28 51.08 9.4
dev: partition 4 41.09 35.71 67.49 51.34 9.14
dev: partition 5 39.83 35.55 65.72 49.99 10.49
dev: partition 6 39.60 35.99 66.56 50.27 10.21
dev: partition 7 38.33 35.47 64.89 48.92 11.56
std: partition 1 44.77 36.08 70.67 54.54 5.78
dev: partition 0 49.14 38.35 79.63 60.48 -std: partition 0 49.15 36.52 79.45 60.32
-(b) HieCoAtt (Alt, VGG19) model evaluation results.
Rscore= 0.36 Other Num Y/N All Diff dev: partition 1 49.31 34.62 72.21 57.12 8.67
dev: partition 2 48.53 34.84 70.30 55.98 9.81
dev: partition 3 48.01 33.95 69.15 55.16 10.63
dev: partition 4 47.20 34.02 69.31 54.84 10.95
dev: partition 5 45.85 34.07 68.95 54.05 11.74
dev: partition 6 44.61 34.30 68.59 53.34 12.45
dev: partition 7 44.71 33.84 67.76 52.99 12.80
std: partition 1 49.07 34.13 71.96 56.95 8.73
dev: partition 0 57.01 37.51 83.54 65.79 -std: partition 0 56.60 36.63 83.68 65.68
-(c) MLB with Attention model evaluation results.
Rscore= 0.34 Other Num Y/N All Diff dev: partition 1 51.51 35.62 68.72 56.85 9.13
dev: partition 2 49.86 34.43 66.18 54.88 11.10
dev: partition 3 49.15 34.50 64.85 54.00 11.98
dev: partition 4 47.96 34.26 64.72 53.35 12.63
dev: partition 5 47.20 33.93 64.53 52.88 13.10
dev: partition 6 46.48 33.90 64.37 52.46 13.52
dev: partition 7 46.88 33.13 64.10 52.46 13.52
std: partition 1 51.34 35.22 68.32 56.66 9.11
dev: partition 0 56.73 38.35 84.11 65.98 -std: partition 0 56.29 37.47 84.04 65.77
-(d) MUTAN with Attention model evaluation results.
Rscore= 0.45 Other Num Y/N All Diff dev: partition 1 46.51 36.33 70.41 55.22 6.59
dev: partition 2 45.19 36.78 67.27 53.34 8.47
dev: partition 3 43.87 36.28 65.29 51.84 9.97
dev: partition 4 43.41 36.25 65.94 51.88 9.93
dev: partition 5 42.02 35.89 66.09 51.23 10.58
dev: partition 6 42.03 36.40 65.66 51.12 10.69
dev: partition 7 40.68 36.08 63.49 49.54 12.27
std: partition 1 46.77 35.22 69.66 55.00 7.06
dev: partition 0 51.77 38.65 79.70 61.81 -std: partition 0 51.95 38.22 79.95 62.06
-(e) HieCoAtt (Alt, Resnet200) model evaluation results.
Rscore= 0.19 Other Num Y/N All Diff dev: partition 1 29.24 33.77 65.14 44.47 13.55
dev: partition 2 28.02 32.73 62.68 42.75 15.27
dev: partition 3 26.32 33.10 60.22 40.97 17.05
dev: partition 4 25.27 31.70 61.56 40.86 17.16
dev: partition 5 24.73 32.63 61.55 40.70 17.32
dev: partition 6 23.90 32.14 61.42 40.19 17.83
dev: partition 7 22.74 31.36 60.60 39.21 18.81
std: partition 1 29.68 33.76 65.09 44.70 13.48
dev: partition 0 43.40 36.46 80.87 58.02 -std: partition 0 43.90 36.67 80.38 58.18
-(f) LSTM Q+I model evaluation results.
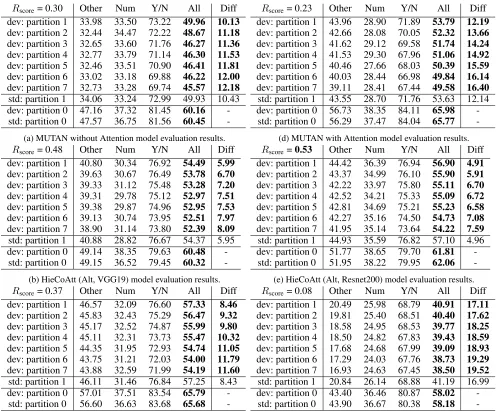
Rscore= 0.30 Other Num Y/N All Diff dev: partition 1 33.98 33.50 73.22 49.96 10.13
dev: partition 2 32.44 34.47 72.22 48.67 11.18
dev: partition 3 32.65 33.60 71.76 46.27 11.36
dev: partition 4 32.77 33.79 71.14 46.30 11.53
dev: partition 5 32.46 33.51 70.90 46.41 11.81
dev: partition 6 33.02 33.18 69.88 46.22 12.00
dev: partition 7 32.73 33.28 69.74 45.57 12.18
std: partition 1 34.06 33.24 72.99 49.93 10.43 dev: partition 0 47.16 37.32 81.45 60.16
-std: partition 0 47.57 36.75 81.56 60.45
-(a) MUTAN without Attention model evaluation results.
Rscore= 0.48 Other Num Y/N All Diff dev: partition 1 40.80 30.34 76.92 54.49 5.99
dev: partition 2 39.63 30.67 76.49 53.78 6.70
dev: partition 3 39.33 31.12 75.48 53.28 7.20
dev: partition 4 39.31 29.78 75.12 52.97 7.51
dev: partition 5 39.38 29.87 74.96 52.95 7.53
dev: partition 6 39.13 30.74 73.95 52.51 7.97
dev: partition 7 38.90 31.14 73.80 52.39 8.09
std: partition 1 40.88 28.82 76.67 54.37 5.95 dev: partition 0 49.14 38.35 79.63 60.48
-std: partition 0 49.15 36.52 79.45 60.32
-(b) HieCoAtt (Alt, VGG19) model evaluation results.
Rscore= 0.37 Other Num Y/N All Diff dev: partition 1 46.57 32.09 76.60 57.33 8.46
dev: partition 2 45.83 32.43 75.29 56.47 9.32
dev: partition 3 45.17 32.52 74.87 55.99 9.80
dev: partition 4 45.11 32.31 73.73 55.47 10.32
dev: partition 5 44.35 31.95 72.93 54.74 11.05
dev: partition 6 43.75 31.21 72.03 54.00 11.79
dev: partition 7 43.88 32.59 71.99 54.19 11.60
std: partition 1 46.11 31.46 76.84 57.25 8.43 dev: partition 0 57.01 37.51 83.54 65.79
-std: partition 0 56.60 36.63 83.68 65.68
-(c) MLB with Attention model evaluation results.
Rscore= 0.23 Other Num Y/N All Diff dev: partition 1 43.96 28.90 71.89 53.79 12.19
dev: partition 2 42.66 28.08 70.05 52.32 13.66
dev: partition 3 41.62 29.12 69.58 51.74 14.24
dev: partition 4 41.53 29.30 67.96 51.06 14.92
dev: partition 5 40.46 27.66 68.03 50.39 15.59
dev: partition 6 40.03 28.44 66.98 49.84 16.14
dev: partition 7 39.11 28.41 67.44 49.58 16.40
std: partition 1 43.55 28.70 71.76 53.63 12.14 dev: partition 0 56.73 38.35 84.11 65.98
-std: partition 0 56.29 37.47 84.04 65.77
-(d) MUTAN with Attention model evaluation results.
Rscore=0.53 Other Num Y/N All Diff dev: partition 1 44.42 36.39 76.94 56.90 4.91
dev: partition 2 43.37 34.99 76.10 55.90 5.91
dev: partition 3 42.22 33.97 75.80 55.11 6.70
dev: partition 4 42.52 34.21 75.33 55.09 6.72
dev: partition 5 42.81 34.69 75.21 55.23 6.58
dev: partition 6 42.27 35.16 74.50 54.73 7.08
dev: partition 7 41.95 35.14 73.64 54.22 7.59
std: partition 1 44.93 35.59 76.82 57.10 4.96 dev: partition 0 51.77 38.65 79.70 61.81
-std: partition 0 51.95 38.22 79.95 62.06
-(e) HieCoAtt (Alt, Resnet200) model evaluation results.
Rscore= 0.08 Other Num Y/N All Diff dev: partition 1 20.49 25.98 68.79 40.91 17.11
dev: partition 2 19.81 25.40 68.51 40.40 17.62
dev: partition 3 18.58 24.95 68.53 39.77 18.25
dev: partition 4 18.50 24.82 67.83 39.43 18.59
dev: partition 5 17.68 24.68 67.99 39.09 18.93
dev: partition 6 17.29 24.03 67.76 38.73 19.29
dev: partition 7 16.93 24.63 67.45 38.50 19.52
std: partition 1 20.84 26.14 68.88 41.19 16.99 dev: partition 0 43.40 36.46 80.87 58.02
-std: partition 0 43.90 36.67 80.38 58.18
-(f) LSTM Q+I model evaluation results.
5
Conclusion
In this work, we propose a novel framework, a semantic similarity ranking method, two large-scale basic question datasets and robustness measure (Rscore) as a benchmark to help the community build accurateandrobust VQA models.
6
Acknowledgments
This work was supported by the King Abdullah Univer-sity of Science and Technology (KAUST) Office of Spon-sored Research and used the resources of the Supercomput-ing Laboratory at KAUST in Thuwal, Saudi Arabia.
References
Agrawal, A.; Batra, D.; and Parikh, D. 2016. Analyzing the
behavior of visual question answering models. arXiv preprint
arXiv:1606.07356.
Antol, S.; Agrawal, A.; Lu, J.; Mitchell, M.; Batra, D.; Lawrence Zitnick, C.; and Parikh, D. 2015. Vqa: Visual question
answering. InCVPR, 2425–2433.
Banerjee, S., and Lavie, A. 2005. Meteor: An automatic metric for mt evaluation with improved correlation with human judgments. In ACLW, volume 29, 65–72.
Ben-younes, H.; Cadene, R.; Cord, M.; and Thome, N. 2017. Mu-tan: Multimodal tucker fusion for visual question answering. In ICCV.
Chen, K.; Wang, J.; Chen, L.-C.; Gao, H.; Xu, W.; and Nevatia, R. 2016. Abc-cnn: An attention based convolutional neural network
for visual question answering. InCVPRW.
Chung, J.; Gulcehre, C.; Cho, K.; and Bengio, Y. 2014. Empirical evaluation of gated recurrent neural networks on sequence
model-ing.arXiv preprint arXiv:1412.3555.
Elliott, D., and Keller, F. 2013. Image description using visual
dependency representations. InEMNLP, 1292–1302.
Fang, H.; Gupta, S.; Iandola, F.; Srivastava, R. K.; Deng, L.; Doll´ar, P.; Gao, J.; He, X.; Mitchell, M.; Platt, J. C.; et al. 2015. From
captions to visual concepts and back. InCVPR, 1473–1482.
Fawzi, A.; Moosavi Dezfooli, S. M.; and Frossard, P. 2017. A ge-ometric perspective on the robustness of deep networks. Technical report, IEEE.
Fukui, A.; Park, D. H.; Yang, D.; Rohrbach, A.; Darrell, T.; and Rohrbach, M. 2016. Multimodal compact bilinear pooling for
visual question answering and visual grounding. InEMNLP.
Gao, H.; Mao, J.; Zhou, J.; Huang, Z.; Wang, L.; and Xu, W. 2015. Are you talking to a machine? dataset and methods for multilingual
image question. InNIPS, 2296–2304.
Huang, J.-H.; Alfadly, M.; and Ghanem, B. 2017a. Robustness
analysis of visual qa models by basic questions. arXiv preprint
arXiv:1709.04625.
Huang, J.-H.; Alfadly, M.; and Ghanem, B. 2017b. Vqabq: Visual
question answering by basic questions.CVPRW.
Kafle, K., and Kanan, C. 2017. Visual question answering:
Datasets, algorithms, and future challenges.CVIU.
Karpathy, A., and Fei-Fei, L. 2015. Deep visual-semantic
align-ments for generating image descriptions. InCVPR, 3128–3137.
Kim, J.-H.; On, K.-W.; Lim, W.; Kim, J.; Ha, J.-W.; and Zhang, B.-T. 2017. Hadamard product for low-rank bilinear pooling. In ICLR.
Kiros, R.; Zhu, Y.; Salakhutdinov, R. R.; Zemel, R.; Urtasun, R.;
Torralba, A.; and Fidler, S. 2015. Skip-thought vectors. InNIPS,
3294–3302.
Kiros, R.; Salakhutdinov, R.; and Zemel, R. S. 2014. Multimodal
neural language models. InIcml, volume 14, 595–603.
Kulkarni, G.; Premraj, V.; Dhar, S.; Li, S.; Choi, Y.; Berg, A. C.; and Berg, T. L. 2011. Baby talk: Understanding and generating
image descriptions. InCVPR. Citeseer.
Li, R., and Jia, J. 2016. Visual question answering with question
representation update (qru). InNIPS, 4655–4663.
Lin, T.-Y.; Maire, M.; Belongie, S.; Hays, J.; Perona, P.; Ramanan, D.; Doll´ar, P.; and Zitnick, C. L. 2014. Microsoft coco: Common
objects in context. InECCV, 740–755. Springer.
Lin, C.-Y. 2004. Rouge: A package for automatic evaluation of
summaries. InACLW, volume 8. Barcelona, Spain.
Lu, J.; Yang, J.; Batra, D.; and Parikh, D. 2016.
Hierarchi-cal question-image co-attention for visual question answering. In NIPS, 289–297.
Malinowski, M.; Rohrbach, M.; and Fritz, M. 2015. Ask your neurons: A neural-based approach to answering questions about
images. InICCV, 1–9.
Mikolov, T.; Sutskever, I.; Chen, K.; Corrado, G. S.; and Dean, J. 2013. Distributed representations of words and phrases and their
compositionality. InNIPS, 3111–3119.
Mostafazadeh, N.; Misra, I.; Devlin, J.; Mitchell, M.; He, X.; and Vanderwende, L. 2016. Generating natural questions about an
image.arXiv preprint arXiv:1603.06059.
Noh, H.; Hongsuck Seo, P.; and Han, B. 2016. Image question answering using convolutional neural network with dynamic
pa-rameter prediction. InCVPR, 30–38.
Papineni, K.; Roukos, S.; Ward, T.; and Zhu, W.-J. 2002. Bleu: a
method for automatic evaluation of machine translation. InACL,
311–318. ACL.
Pennington, J.; Socher, R.; and Manning, C. D. 2014. Glove:
Global vectors for word representation. InEMNLP, volume 14,
1532–1543.
Rips, L. J. 1994.The psychology of proof: Deductive reasoning in
human thinking. Mit Press.
Shih, K. J.; Singh, S.; and Hoiem, D. 2016. Where to look: Focus
regions for visual question answering. InCVPR, 4613–4621.
Vedantam, R.; Lawrence Zitnick, C.; and Parikh, D. 2015. Cider:
Consensus-based image description evaluation. InCVPR.
Vinyals, O.; Toshev, A.; Bengio, S.; and Erhan, D. 2015. Show and
tell: A neural image caption generator. InCVPR, 3156–3164.
Wu, Q.; Wang, P.; Shen, C.; Dick, A.; and van den Hengel, A. 2016. Ask me anything: Free-form visual question answering based on
knowledge from external sources. InCVPR, 4622–4630.
Xiong, C.; Merity, S.; and Socher, R. 2016. Dynamic memory
networks for visual and textual question answering.arXiv1603.
Xu, K.; Ba, J.; Kiros, R.; Cho, K.; Courville, A. C.; Salakhutdinov, R.; Zemel, R. S.; and Bengio, Y. 2015. Show, attend and tell:
Neural image caption generation with visual attention. InICML,
volume 14, 77–81.
Xu, H.; Caramanis, C.; and Mannor, S. 2009. Robustness and
regularization of support vector machines. JMLR10(Jul):1485–
1510.
Yang, Z.; He, X.; Gao, J.; Deng, L.; and Smola, A. 2016. Stacked