74
ISSN: 2250 – 2688Received: 26/08/2016 Revised: 08/09/2016 Accepted: 22/09/2016
Moovi Nema, H K Sharma College of pharmacy, Sri Satya Sai University of Technology and Medical Sciences, Sehore, Madhya pradesh
Avinash Gawali, S B Wagh Department of pharmacy, N.D.M.V.P’ s Samaj College of Pharmacy, Nashik, Maharashtra
Correspondence H K Sharma
College of pharmacy, Sri Satya Sai University of Technology and Medical Sciences, Sehore, Madhya pradesh
E mail: [email protected]
Synthesis and Characterization of Impurities of Eletriptan and its
HPLC Method Development and Validation
Moovi Nema, Avinash Gawali, S B Wagh and H K Sharma
ABSTRACT
A simple, precise, rapid and accurate HPLC method was developed and validated for the identification and evaluation of N-acetyl 5- (phenyl sulfonyl ethen 2-yl) indole and 5- (phenyl sulfonyl ethen2-yl)-1H-indole impurities of eletriptan formed during Eletriptan Synthesis. The synthesis of the impurity standard with the proposed structure is the important step in impurity profiling. Characterization of these impurities are done by using instruments like GC-MS ,NMR and FTIR. Separation was carried on a Waters 1525 HPLC system with Breeze software, Waters 2489 UV/Visible detector and Waters Xterra Phenyl C18 analytical column (250mm x4.6mm: 5 µ) was operated in a gradient mode at a flow rate of 1 ml/min with detection wavelengh of 225nm by an injection volume of 10ul. The method is Validated as per ICH guidelines by determining its specificity, accuracy, precision, linearity, ruggedness, robustness and system suitability.
Key Words: GC-MS, NMR, FTIR, Validation, Eletriptan
1. INTRODUCTION
Eletriptan, 3-((R)-1-methyl-2-pyrrolidinyl) Methyl)-5-_2-(phenylsulfonyl) ethyl-indole hydrobromide (Fig. 1), is a new orally active 5-HT 1B/1D agonist, for the acute treatment of migraine headache.
Eletriptan Hydrobromide is believed to reduce swelling of the blood vessels surrounding the brain. This swelling is associated with the head pain of a migraine attack. Eletriptan Hydrobromide blocks the release of substance from nerve endings that cause more pain and other symptoms like nausea, and sensitivity to light and sound.1 Impurities in pharmaceuticals are the unwanted chemicals that remain with the active pharmaceutical ingredients (APIs), or develop during formulation, or upon aging of both API and formulated APIs to medicines. The presence of these unwanted chemicals, even in small amounts, may influence the efficacy and safety of the pharmaceutical products. The different Pharmacopoeias, such as the British Pharmacopoeia (BP) and the United States Pharmacopoeia (USP) are slowly incorporating limits to allowable levels of impurities present in the APIs or formulations. 2 The International Conference on Harmonization (ICH) has published guidelines on impurities in new drug substances, products and residual solvents. Impurity profiling (i.e. the identity as well as the quantity of impurity in the pharmaceuticals), is now receiving important critical attention from regulatory authorities.3 The important step in the impurity profiling is the synthesis of the impurity standard with the proposed structure and detection of these impurity using the Thin Layer Chromatography, High-Performance Liquid Chromatography or Gas Chromatography, Mass Spectroscopy and Nuclear Magnetic Resonance.4, 5,6 The retention and spectral matching of the synthesized material with the impurity is useful for analytical method development and validation.
75
Figure 1. Structure of Eletriptan
2. MATERIALS AND METHODS 2.1 Drug and chemicals used
Eletriptan hydrobromide was obtained from Mylan Laboratories Ltd Hyderabad, Acetonitrile and water used was of HPLC grade from E. merck, India. Orthophosphoric acid and triethylamine was of analytical grade from Merck, India. 5-bromo indole from Sampro research lab., Dindori, Nashik.
2.2 Synthesis of Process Related Impurity and Its Spectromertic Characterization
2.2.1 Synthesis of N acetyl 5-(2-(phenylsulfonyl) ethen 2-yl)- Indole 8
N Br
H
N Br
C
O CH3
ACN 1
Acetic anhydride 2
5 - bromo indole N - acetyl - 5 -bromo indole
N C
O CH3
PVS 1-acetyl-5-bromo indole 1-acetyl-5-(phenyl sulphonyl ethan-2-yl) indole
N Br
C
O CH3
S O O S
O
O
Pd (OAc)2
TOTP +
White crystalline powder; M. F. C18H15NSO3; M. W. 325.
IR (KBr, cm-1): 2927 (C-H in -CH2-), 3056 (C-H aromatic), 1593
(C=C aromatic), 1697 (C-O in acetyl), 1305.72 (SO2 asymmetric),
1147 (SO2 symmetric).
P-NMR: 7.8 (d, 2H ArH), 7.6 (m, 2H ArH), 7.4 (m, 5H ArH), 7.1 (m, 2H ArH).
2.2.2 Synthesis of 5(2-(phenylsulfonyl)ethenyl)-indole
Refluxing of N acetyl 5-(2-(phenylsulfonyl) ethenyl)- Indole with sodium carbonate we get 5(2-(phenylsulfonyl)
ethenyl)-Indole
N C
O CH3
1-acetyl-5-(phenyl sulphonyl ethen-2-yl) indole 5-(2-phenyl sulphonyl ethenyl) indole
S O O
Na2CO3
Methanol
N H S
O O
white powder; M. F. C18H13NSO2; M. Wt. 307.
IR (KBr, cm-1): 2927 (C-H in -CH2-), 3056 (C-H aromatic), 1593
(C=C aromatic), 1697 (C-O in acetyl), 1305.72 (SO2 asymmetric),
1147 (SO2 symmetric).
GC-MS m/z: 125 (C6H5SO+), 140 (C6H5SO2+), 167 (C8H8SO2),
283 (C18H13NSO2), 116(C8H7N).
2.3 HPLC Method for Impurity Profiling of Eletriptan
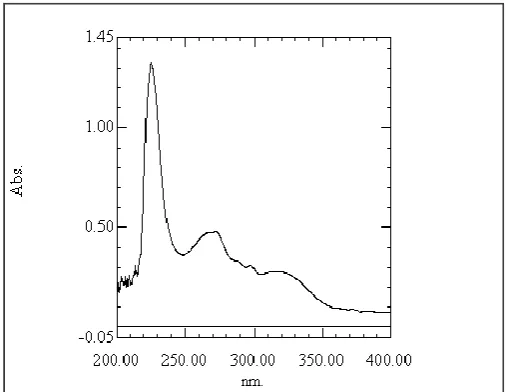
2.3.1 Selection of detection wavelength
Standard stock solution of Eletriptan, and its synthesized impurity was diluted separately with mobile phase to obtain final concentration of 20µg/ml. Each solution was scanned using UV-Visible Spectrophotometer in the spectrum mode between the wavelength range of 400 nm to 200 nm and their spectra were overlaid. It was considered that detection at 225nm would favour sensitivity and precision for the determination of both impurities present in Eletriptan.
Fig.1. UV Specta of Eletriptan
2.3.2 Preparation of mobile phase
Mobile phase A: Buffer, (pH6.8) 0.5ml of triethylamine was dissolved in 1000ml of water and then pH adjusted with Orthophosphoric acid.
76
2.3.3 Chromatographic parametersParameter - Description
Column - X terra phenyl, 250 x 4.6 mm, 5µm
Flow rate - 1.0 ml/min.
Wavelength - 225 nm
Injection volume - 20 µL
Run time - 60 min.
Mode- - Gradient
2.3.4 Preparation of Diluent
The mixture of water and acetonitrile in ratio (50:50 v/v), properly degassed with ultrasonic bath, was used as diluent.
2.4 Preparation of solutions
2.4.1 Impurity stock standard solution
Solution A: 10 mg of N-acetyl 5- (phenyl sulfonyl ethen- 2-yl) indole standard and 10 mg of 5-( phenyl sulfonyl ethen-2-yl)-1H-indole standard was dissolved in in 100 ml diluent, to produce mixed solution of N-acetyl 5- (phenyl sulfonyl ethen -2-yl) indole (100ug/ml) and 5-( phenyl sulfonyl ethen-2-yl)-1H-indole (100 µg/ml).
Mixed stock standard solution of N-acetyl 5-(phenyl sulfonyl ethen-2-yl) indole (10 µg/ml) and 5-( phenyl sulfonyl ethen-2-yl)-1H-indole. (10 µg/ml) was prepared by dissolving 10 ml of ‘solution A’ in 100 ml diluent.
2.4.2 Eletriptan stock standard solution
Stock standard solution of Eletriptan (10mg/ml) was prepared by dissolving 1000 mg Eletriptan standard in 100 ml diluent. Solutions for analyses containing mixtures of the all three analytes were prepared immediately before use, by appropriate dilution of the stock solutions or accurately weighed analytes with mobile phase.
2.4.3 System suitability solution
It was prepared by mixing 1ml Eletriptan stock standard solution and 1.5ml of impurity stock standard solution in 10 ml volumetric flask and volume was make up to the mark with diluent.
2.4.4 Test solution
Test solution of Eletriptan sample (1mg/ml) was prepared by dissolving 50mg Eletriptan sample in 50ml diluent.
2.4.5 System Suitability Test
For system suitability six replicate of standard solution of Eletriptan Hydrobromide and its impurity was injected into the system and studied the suitability parameter like plate number (N), Tailing Factor (T) and Percentage relative standard deviation (%RSD) were studied.
Fig.2. HPLC chromatogram of Eletriptan and its process impurity
2.5 Validation of HPLC Method for Determination of Eletriptan and its Process Related Impurities
2.5.1 Linearity
The linearity of calibration curve was constructed by plotting the peak area versus concentration. The concentration of Eletriptan impurities present in test solution were determined from their respective linearity curves.
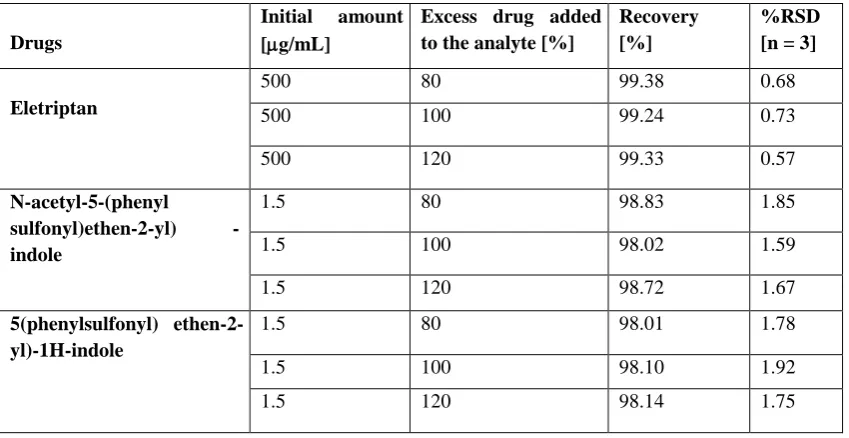
2.5.2 Accuracy (recovery)
To study the Accuracy of method recovery study was carried out by adding 80%, 100% and 120 % level; known amount of standard Eletriptan , N-acetyl 5- (phenyl sulfonyl ethen 2-yl) Indole and 5-( phenyl sulfonyl ethen2-yl)-1H-Indole were added to pre-analyzed sample and, the mixtures were analyzed in triplicate and mean analyte recoveries were calculated.
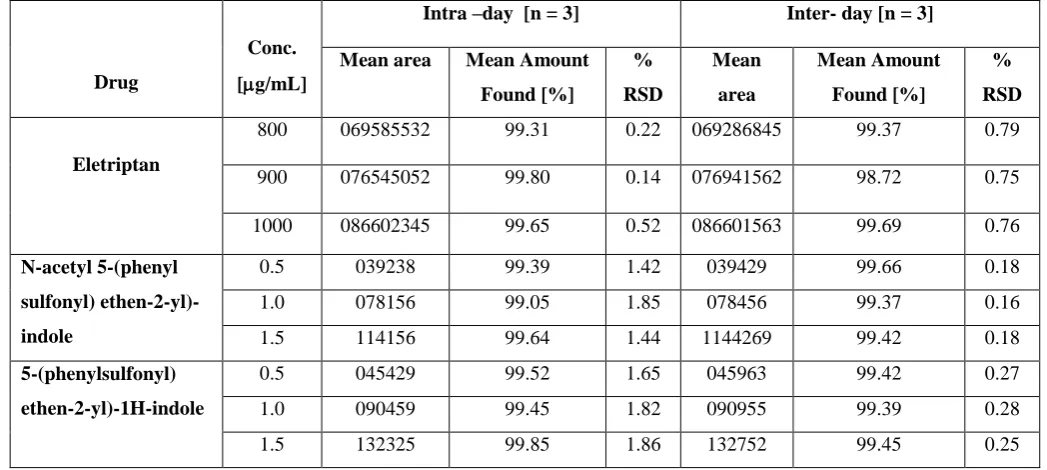
2.5.3 Precision
77
2.5.4 RuggednessSix replicate of the same concentration solution were analyzed by two different analysts using similar operational and environmental conditions. The% amount and % RSDs were calculated.
2.5.5 Robustness
Robustness of the method was studied by making deliberate changes in few parameters viz; change in PH (±0.1) and
flow rate (±0.1 ml/min). The effects on the results were studied six different times by injecting solution containing Eletriptan (1mg/ml), N-acetyl 5-(phenyl sulfonyl ethene-2-yl) Indole (1.5µg/ml) and 5-(phenyl sulfonyl ethen-2-yl)-1H-indole. (1.5
g/ml); one factor was changed at one time to estimate the effect on %RSD, plate count and tailing.
2.5.6 LOD and LOQ
It is used particularly for the determination of impurities and/or degradation products. The limit of detection (LOD) and limit of quantitation (LOQ) were determined using following formulae.
LOD = 3.3 (SD)/S; LOQ = 10 (SD)/S;
Where SD = Standard Deviation of response, S = the slope of the calibration curve.
Fig.3. Linearity Graph for Eletriptan
3. RESULTS AND DISCUSSION
The impurities of Eletriptan such as N acetyl 5-(phenylsulfonyl) ethen 2-yl – indole and 5- 5-(phenylsulfonyl)ethen-2yl-indole was synthesised and characterised by analytical techniques. Separation was carried on a Waters 1525 HPLC system with Breeze software, UV/Visible detector Waters 2489 and Waters Xterra Phenyl C18 analytical column (250mm x4.6mm: 5 µ)
was operated in a gradient mode using mobile phase consisting of
buffer pH 6.8 and Acetonitrile at a flow rate of 1 ml/min with detection wavelengh of 225nm by an injection volume of 10ul. Under the described experimental condition, sharp pH that belong to Eletriptan were obtained at retention time about 12.939 for eletriptan hydrobromide, 8.279 for N acetyl 5-(phenylsulfonyl) ethen-2-yl)- indole, 37.372 for 5-(phenylsulfonyl)ethen-2-yl)-1H-indole. System suitability study was carried out and plate No. (N), Tailing factor (T), and percentage standard deviation (%RSD) was found and are presented ( Table 2). The linearity (Table 5) was obtained in the concentration range 0.8 – 1.2 mg/ml for eletriptan Hydrobromide and 0.5 – 2.5 mg/ml for its impurity with correlation cofficient of 0.999. The accuracy of the method was determined by performing recovery studies at 80%, 100%, 120% were found within the limits (Table 6). The precision of the method was also found to be good. The ruggedness of the method was also found with in limit. The limit of detection (LOD) and limit of quantitation (LOQ) of the developed method were determined by injecting progressively low concentration of standard solution using developed HPLC method.
Fig. 4. Linearity Graph for N acetyl 5-(phenylsulfonyl) ethen-2-yl)- indole
78
Table No. 1: Mobile phase program for gradient elution
Flow (ml/min.) Time (min) Mobile phase A Mobile phase B
1.0 0 75 25
1.0 10 75 25
1.0 30 30 70
1.0 50 30 70
1.0 52 75 25
1.0 60 75 25
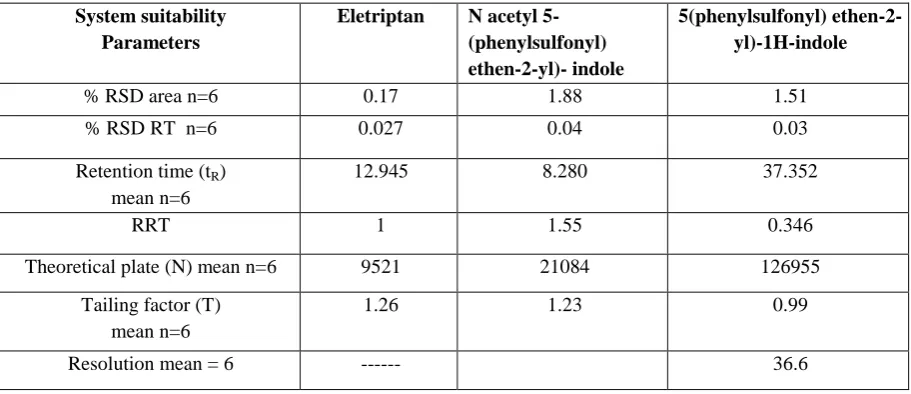
Table No. 2: System suitability test
System suitability Parameters
Eletriptan N acetyl 5-(phenylsulfonyl) ethen-2-yl)- indole
5(phenylsulfonyl) ethen-2-yl)-1H-indole
% RSD area n=6 0.17 1.88 1.51
% RSD RT n=6 0.027 0.04 0.03
Retention time (tR)
mean n=6
12.945 8.280 37.352
RRT 1 1.55 0.346
Theoretical plate (N) mean n=6 9521 21084 126955
Tailing factor (T) mean n=6
1.26 1.23 0.99
Resolution mean = 6 --- 36.6
Table No. 3: Dilution table for linearity
Volume (ml)
Diluents added Up to (ml)
Final concentration
Impurity stock standard solution
Eletriptan stock standard solution
N-acetyl 5- (phenyl sulfonyl ethen 2-yl) indole µg/ml
5-( phenyl sulfonyl ethen2-yl)-1H-indole. µg/ml
Eletriptan mg/ml
0.5 0.8 10 0.5 0.5 0.8
1.0 0.9 10 1.0 1.0 0.9
1.5 1.0 10 1.5 1.5 1.0
2.0 1.1 10 2.0 2.0 1.1
2.5 1.2 10 2.5 2.5 1.2
79
Table No. 4: Dilution preparations
Drugs
Initial amount [g/ml]
Excess drug added to the analyte [%]
Resultant theoretical analyte conc. [g/ml]
Eletriptan
500 80 900
500 100 1000
500 120 1100
N acetyl (5 phenyl sulfonyl
ethen-2-yl)indole
1.5 80 2.7
1.5 100 3.0
1.5 120 3.3
5-(phenyl sulfonyl ethen-2-yl)-1H-indole.
1.5 80 2.7
1.5 100 3.0
1.5 120 3.3
Table No. 5: Linearity of Eletriptan, N acetyl 5-(phenylsulfonyl) ethen-2-yl)- indole and 5(phenylsulfonyl) ethen-2-yl)-1H-indole
Sr. No.
Eletriptan N acetyl 5-(phenylsulfonyl) ethen-2-yl)-
indole
5(phenylsulfonyl) ethen-2-yl)-1H-indole
CONC [g/mL]
Peak area [ Mean ± % RSD; n = 3]
CONC [g/mL]
Peak area [ Mean ± % RSD; n = 3]
CONC [g/ml]
Peak area [Mean ± % RSD; n = 3] 1 800 069285168 ± 0.12 0.5 039659 ±1.88 0.5 045329 ±1.56
2 900 076945074 ±0.18 1.0 078268 ±1.65 1.0 090168 ±1.34
3 1000 086602326 ±0.20 1.5 114861 ±1.34 1.5 132569 ±1.92
4 1100 095268710 ±0.18 2.0 156482 ±1.63 2.0 180364 ±1.22
5 1200 103922062 ±0.14 2.5 195267 ±1.85 2.5 225458 ±1.67
Table No. 6: Recovery studies
Drugs
Initial amount [g/mL]
Excess drug added to the analyte [%]
Recovery [%]
%RSD [n = 3]
Eletriptan
500 80 99.38 0.68
500 100 99.24 0.73
500 120 99.33 0.57
N-acetyl-5-(phenyl sulfonyl)ethen-2-yl) -indole
1.5 80 98.83 1.85
1.5 100 98.02 1.59
1.5 120 98.72 1.67
5(phenylsulfonyl) ethen-2-yl)-1H-indole
1.5 80 98.01 1.78
1.5 100 98.10 1.92
1.5 120 98.14 1.75
80
Table No. 7: Precision studies
Drug
Conc. [g/mL]
Intra –day [n = 3] Inter- day [n = 3]
Mean area Mean Amount
Found [%]
% RSD
Mean area
Mean Amount Found [%]
% RSD
Eletriptan
800 069585532 99.31 0.22 069286845 99.37 0.79
900 076545052 99.80 0.14 076941562 98.72 0.75
1000 086602345 99.65 0.52 086601563 99.69 0.76
N-acetyl 5-(phenyl sulfonyl) ethen-2-yl)- indole
0.5 039238 99.39 1.42 039429 99.66 0.18
1.0 078156 99.05 1.85 078456 99.37 0.16
1.5 114156 99.64 1.44 1144269 99.42 0.18
5-(phenylsulfonyl) ethen-2-yl)-1H-indole
0.5 045429 99.52 1.65 045963 99.42 0.27
1.0 090459 99.45 1.82 090955 99.39 0.28
1.5 132325 99.85 1.86 132752 99.45 0.25
Table No. 8: Ruggedness study
Drug Conc.
[g/ml]
% mean Amount Found [n = 6] % RSD
Analyst I Analyst II Analyst I Analyst II
Eletriptan 1000 98.25 98.33 0.49 0.29
N acetyl 5-(phenylsulfonyl) ethen-2-yl)- 1-indole 1.5 98.29 98.24 1.34 1.52
5(phenylsulfonyl) ethen-2-yl)-1H-indole 1.5 98.27 98.49 1.55 1.62
Table No. 9: Robustness studies
Drug
% mean Amount Found [n = 6] % RSD
pH change(+0.1)
Flow rate change(+0.1ml/mn)
pH change (+0.1)
Flowrate change (+0.1ml/mn)
Eletriptan 98.61 98.60 0.24 0.25
N acetyl 5-(phenylsulfonyl) ethen-2-yl)-1-indole
98.23 98.36 0.28 0.29
5(phenylsulfonyl) ethen-2-yl)-1H- indole 98.52 98.95 0.26 0.22
Table No. 10: LOD and LOQ values
Drugs LOD (µg/ml) LOQ (µg/ml)
Eletriptan 5.411 16.423
N acetyl 5-(phenylsulfonyl) ethen-2-yl)- Indole. 0.098 0.291
81
4. CONCLUSION
A simple and rapid HPLC method was developed for characterisation of the two impurities of Eletriptan. The proposed method was thoroughly validated, demonstrating to be selective, precise, linear, accurate and robust in the specified concentrations range.The method was accurate and robust for determining Eletriptan and their impurities which may be present at low levels in the bulk drug. LOQ values for the impurities confirmed method’s ability to quantify trace amount of these contaminants. The method can be used for the routine analysis as well as to monitor the stability studies.
5. ACKNOWLEDGEMENTS
I would like to thank my guide Dr S. B. wagh , my colleagues for support and Mylan laboratories for giving gift sample .
REFERENCES
1. Tripathi KD . Essentials of medical pharmacology fifth edition. Jaypee brothers medical publishers(p) Ltd, New Delhi, 139 -143.
2. Roy J. Pharmaceutical Impurities A Mini-Review. AAPS PharmSciTech 2002; 3 (2) article 6:1-8
3. Rao KS et al. synthesis and characterization of related impurities of Eletriptan Hydrobromide. international Research journal of pharmacy,2012;3(10):119-122
4. International Conferences on Harmonization, Draft Revised Guidance on Impurities in New Drug Substances, Q3A(R), Federal Register, 2000, 65 (140),.45085.
5. International Conferences on Harmonization, Draft Revised Guidance on impurities in New Drug products, Q3B(R), Federal Register, 2000, 65 (139),. 44791.
6. International Conference on Harmonization (1999) Specifications, Q6A: Test Procedures and Acceptance Criterial for New Drug Substances and New DrugProducts. Chemical substances 65 (146):67488.
7. Kumar KS et al. Synthesis and characterization of potential impurities in key intermediates of Carvedilol: a b-adrenergic receptor. J. Chem. Pharm. Res. 2011; 3(6):33-45
8. Mendham J, Denney RC, Barnes JD, Thomas M. Vogel’s Textbook of Quantitative Analysis. Pearson Education, Singapore, 2003; 361-288. 9. USP-NF, Validation of Compendial Procedures, Genral
Chapters,Volume-1; 2010:734-736.