Prediction of protein content in rice using a near-infrared imaging system
as diagnostic technique
Lian-Hsiung Lin
1,
Fu-Ming Lu
2,
Yung-Chiung Chang
3*(1. Department of Biomechatronic Engineering, National Ilan University, Ilan 260, Taiwan;
2. Department of Bio-Industrial Mechatronics Engineering, National Taiwan University, Taipei 106, Taiwan;
3. Department of Horticulture, National Ilan University, Ilan 260, Taiwan)
Abstract: The aim of this research was to determine the rice protein content utilizing a NIR imaging system. The developed imaging system utilized a NIR camera which installed automatically exchanged filters with the wavelength range from 870 nm to 1014 nm. Multiple liner regression (MLR), partial least square regression (PLSR), and artificial neural network (ANN) models were employed as data analysis methods for 6.18%-9.43% rice protein detections within both the NIR imaging system and commercial NIRS. A total of 180 rice samples were used in this study, of which 120 random samples were selected as a calibration set for the MLR and PLSR models. Moreover, for establishing the back-propagation ANN model, the same 120 samples were divided into two parts, 80 samples were used for network training and the other 40 were established as the monitoring set. To compare with the results of MLR, PLSR, and ANN models, the remaining 60 of the total 180 samples were established as the validation set. Applying an MLR linear regression model composed of five wavelengths; the NIR imaging system successfully detected rice protein content. The predicting results of rval
2
and SEP were 0.769 and 0.294%, respectively. In PLSR model, utilizing the imaging system obtained the results of rval
2
= 0.782, and SEP = 0.274% within the wavelength range from 870 nm to 1014 nm. Five significant wavelengths selected by the MLR model were the same as the input data of the ANN model, and the prediction results were rval2 = 0.806, and SEP=0.266%. The prediction results indicated
that the developed NIR imaging system has the advantages of simple, convenient operation, and high detection accuracy as well as it presents commercial potential in non-destructive detection of rice protein content.
Keywords: non-destructive detection, near-infrared imaging system, inner quality, rice, protein content, agriculture product DOI: 10.25165/j.ijabe.20191202.4709
Citation: Lin L-H, Lu F-M, Chang Y-C. Prediction of protein content in rice using a near-infrared imaging system as diagnostic technique. Int J Agric & Biol Eng, 2019; 12(2): 195–200.
1 Introduction
Rice can supply abundant nutrition and plays as a key food in Asia. The flavor of cooked rice obviously influences rice price, therefore it is an important issue to reveal factors that determine the rice qualities. Reports[1,2] indicated that the main factors that affects the flavors of cooked rice were moisture, protein, starch, and fatty acid content of rice. Protein is the major element that determines the rice nutrition value[3]. Moreover, rice protein can prevent hyperlipidemia in part through modifying glutathione metabolism[4]. The rice protein content differs from 6% to 14% depending on the rice varieties and culture environments. Rice contain higher protein content are generally with color of yellowish-brown along with more transparent and harder grains, which should spend longer time and need more water to cook[5]. The rice protein content is negatively correlated with the flavor of cooked rice, but positively correlated with the viscosity of cooked rice. Protein content affects the amount of rice water absorption
Received date: 2018-10-11 Accepted date: 2019-02-03
Biograpgies: Lian-Hsiung Lin, PhD, Associate Professor, research interest: non-destructive quality detection, near-infrared spectroscopy, image processing, biomechanics. Email: [email protected]; Fu-Ming Lu, PhD, Professor, research interest: biological materials processing engineering, gain drying and storage, and precision agriculture. Email: [email protected].
*Corresponding author: Yung-Chiung Chang, Associate Professor, research interest: fruit crop science and plant biomechanics. Department of Horticulture, National Ilan University, Ilan 260, Taiwan. Tel: +886-3-9317648, Email: [email protected].
during the early cooking stage. In the rice cooking process, proteins in milled-rice grains will retard starch swell. Therefore, less rice protein content leads to more cooked-rice elasticity. In contrast, higher rice protein increases the viscosity of cooked-rice which results in flavor reduction[6].
For high-quality rice production, topics including new rice variety development, culture technique improvement and harvested rice storage are all important for rice industry. Utilizing the destructive chemical analysis method like Kjeldahl method[7] could measure the rice protein content accurately, but such chemical analysis method usually suffers from problems of environmental pollution and time-consuming. Therefore, developing a non-destructive detection technique and device which can be utilized in rice processing and classification is an important issue for rice industry. The near-infrared spectrometer (NIRS) has been widely applied to numerous qualitative and quantitative analysis of crops. Rice amylose content has been predicted accurately in milled whole grain[8,9] and rice grain[10]. Moreover, rice protein
(ANN) model showed a higher prediction capacity than linear ones. Sitakalin and Meullenet[19] reported that the accuracy achieved by artificial neural network (ANN) model was superior to that of PLSR model in texture prediction of cooked rice. For assessment of apple soluble solids content, the model of ANN with two hidden neurons performed a better predictive capacity than that of PCR[20].
Imaging technique belongs to morphological method and has been applied into a useful nondestructive measurement approach in rice industry. Studies evaluated the visual features of rice had been reported, for example, the rice classification[21-23], the degree of rice milling[24], the cracked rice detection[25], and the cooking properties of rice kernels[26,27]. Utilizing the NIR cooled charged couple device (CCD) camera could help to capture the spectral images in the NIR band, which made the quantitative measurements possible, e.g., insects inside wheat detection[28], wheat protein and color classification[29], and rice seed cultivar
identification[30]. Cogdill et al.[31] developed a NIR imaging device that usefully detected protein contents of single maize. In previous study, the developed NIR imaging system showed a high detection accuracy and capability for the rice moisture[32]. Utilizing the MLR, PLSR and ANN models, the analysis result of
rval2 was within 0.942-0.952, which displayed satisfied prediction
capacities for rice moisture. Protein content plays a major role in rice qualities, and it is important ant valuable to develop an effective and low-cost NIR imaging system for rice protein content measurement.
To achieve progress in rice selection efficiency, the study was aimed to develop an NIR imaging system to detect 10 different varieties rice protein contents. Moreover, the prediction efficiency of the system was evaluated and analyzed by calibration models of MLR, PLSR, and ANN.
2 Materials and methods
2.1 Rice samples
The rice samples were harvested from four villages in central Taiwan, and 10 of the most popular varieties were chosen. Total 180 rice samples were used in this study. 120 random samples of the total 180 ones were established as the calibration set of the MLR and PLSR model. These 120 samples were divided into two parts, 80 of the 120 rice samples were for the back-propagation ANN network training and the other part of the 40 ones were established as the monitoring set which avoided overtraining of the network. To compare with the results of MLR, PLSR, and ANN models, 60 remainder samples of the total 180 ones were established as the validation set. Figure 1 shows the statistical information about the rice samples, in which the protein contents ranged from 6.18% to 9.43% (dry basis, d.b.), and the standard deviation of 180 rice samples ranged from 0.58% to 0.61%. 2.2 Chemical analysis
The rice protein content was determined by the Kjeldahl method[33], and the value of 5.95 was used as a protein conversion factor.
2.3 Spectral acquisition
Rice samples were scanned in a standard cup by an NIR spectrometer (model 6500, FOSS NIRSystems, Silver Spring, MD) with a wavelength interval of 2 nm from 400 nm to 2500 nm. To ensure the consistency of sample, each sample was poured out then refilled into the cup after scanning, and three technical replicates were performed for each sample. Results were presented by the mean of spectra value for following analysis.
Note: Solid and dashed horizontal lines, boundaries of box, whiskers, and solid dots indicate median and mean, 25th and 75th percentiles, 10th and 90th percentiles, and the outliers, respectively.
Figure 1 Variations of protein content of rice samples using MLR, PLSR, and ANN approaches
2.4 Near-infrared imaging system design
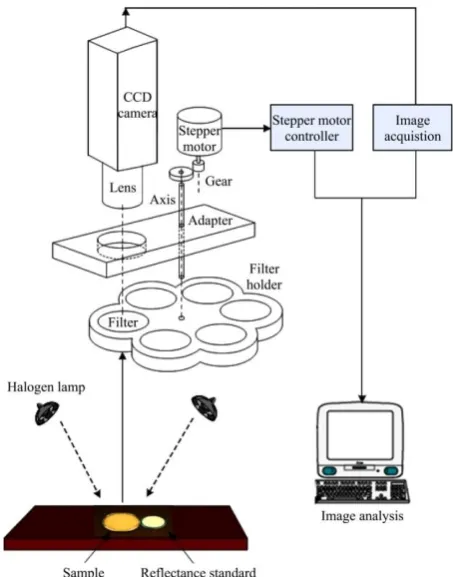
Figure 2 shows the schematic diagram of the NIR imaging system device. The mainly structures of the system were the imaging camera apparatus, the automatically exchange filters device step motor and its controller. The resolution of NIR CCD camera (Silicon type, C3077-78, Hamamatsu, Tokyo, Japan) was 780 (H) × 488 (V), which was coupled to a camera controller (C2741, Hamamatsu). The camera sensitivity ranged from a visible wavelength region to 1050 nm. The camera lens (FV5025, Mutron) had a focal distance of 50 mm and a diaphragm of 2.5. The image captured by the camera was digitalized by a frame grabber board (Meteor, Matrox Inc., Canada) into an image with 640×480 pixels image then sent to the computer. The light source consisted of four halogen bulbs (50W, 12V, OSRAM) that offered light intensity of 200 W. Moreover, the light source used a voltage controller to make sure of a constant light supplement.
2.5 Imaging data processing and model establishing
One of the significant features for the developed NIR imaging system was the automatically exchange filters. The adaptor held the filters tray and the camera lens. The selected filter was being fixed into the filter tray independently, and then been driven by a gear wheel which was installed in the center of the tray on an immobile axle. The filter was exchanged by a gear wheel which was rotated by a stepper motor.
In this study, the prediction efficiency of the developed NIR imaging system was compared with that of the commercial NIRS. Fifteen band-pass filters (Andover Corporation, USA), where their central wavelengths include 870-1000 nm (step 10 nm) and 1014 nm, were used to extract spectroscopic images of rice samples. The rice protein inspection software which included filters tray position controlling, images capturing, and data processing was developed in the Windows environment using Borland C compiler.
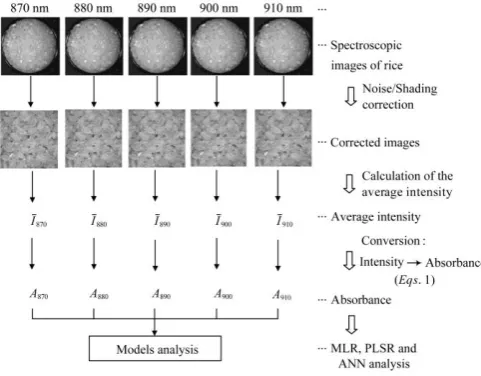
Figure 3 shows the image processing flowchart of the NIR imaging system. At the beginning, rice samples were levelly spread in a petri dish (5 cm in diameter and 1.5 cm in depth). the petri dish with a reference (WS-1, Ocean Optics) were then placed together below the camera. The CCD camera captured totally 15 different wavelength images with 640×480 pixels for every rice sample. In order to strengthen the prediction accuracy, only the 120×120 pixels discerned in the middle part of each original image were used to calculate. The image processing calculates absorbance (Aλ) using the following equation:
10
log ( D)
λ
R D
I I A
I I
(1)
where, I is the sample intensity at wavelength λ; IRis the reference
intensity at wavelength λ; ID is a dark spectrum by CCD camera
when the diaphragm of CCD camera was closed and the light source was turned off.
Two linear calibration models, MLR and PLSR, and the non-linear model of ANN were established to evaluate the prediction efficiency of the developed system. The MLR model utilized the spectral absorption for one to several wavelengths to predict the rice protein content. The PLSR model calibrated the spectral absorption for all of wavelengths, and then extracted the principal component in the feature spectra. The ANN model is a non-linear method and could describe the relationship between the spectra and the rice protein contents. The selected significant wavelengths from the MLR analysis were used as inputs to the ANN network and the rice protein contents were used as output. The ANN network had one hidden layer, and the hidden layer neurons number was determined according to the methods presented by Liu et al.[34] and Dou et al.[35]. The optimization for ANN network can be determined according to equations (2) and (3):
t m
a t m t m
n n
e e e e e
n n
(2)
where, eais the error of the approximation; etand em are the mean
square errors of training set and monitoring set; ntand nm are the
sample numbers of training set and monitoring set; n is the total number of samples, and
a a
c D
e
(3)
where, Dais the degree of approximation and c is a constant which
was utilized to adjust Da to get a good chart. The
back-propagation algorithm and both training and monitoring set were used to train ANN network, and smaller ea or larger Da
indicated a better ANN model approached. After training, the validation set was used to verify the model.
The values of standard error of calibration (SEC) and coefficient of determination of calibration (rcal2) were used to
compare the prediction results among the MLR, PLSR, and ANN models. Models displayed smaller SEC and higher rcal2 values
indicated a better calibration approaches. The values of standard error of prediction (SEP), coefficient of determination of validation (rval
2
), relative performance determinant (RPD), which is the ratio of standard deviation (SD) of the data in validation set to SEP (RPD = SD/SEP), and bias were used to evaluate the prediction capability of the prediction model. The smaller SEP and bias values, and a higher rval
2
value meant a prediction model with higher prediction capability.
Figure 3 Images preprocessing procedure
3 Results and discussion
3.1 MLR model for rice protein estimations
The prediction results employed MLR model utilizing the NIRS and the NIR imaging system with the wavelength range from 870 to 1,014 nm are shown in Figure 4. In both two methods, the values of rcal2 increase as the selected wavelength numbers added,
and five wavelengths of the validation set were selected when the minimum SEP values appear. Calibration equations with smaller SEP values indicates better prediction results[36], which means prediction accuracy of the model MLR model utilized 5 selected wavelengths to estimate the rice protein content displayed the best prediction accuracy of the model (Table 1).
The calibration equation of the NIRS with 5 selected wavelengths (880 nm, 910 nm, 920 nm, 1000 nm, and 1014 nm) has the results of rval2 = 0.799, SEP = 0.269%, and Bias = 0.092.
The calibration equation of rice protein employing the NIR imaging system with the MLR model is as shown as Equation (4):
Protein (%) = 6.29 + 88.49 A880 + 176.75 A910 – 246.79 A920 –
109.09 A990 + 108.42 A1,014 (4)
The selected wavelengths of 880, nm 910 nm, 920 nm, 1014 nm, and 990 nm of the NIR imaging system approached the strong absorption peak of pure protein that Williams and Norris[37] had shown. The developed NIR imaging system displayed a high predictive capacity on rice protein with rval
2
a b
Figure 4 Effects of the selected wavelength number on (a) coefficient of determination (rcal2),
and (b) standard error of prediction (SEP) in MLR model
Table 1 Differences of prediction resultsa between the NIRS and the developed system evaluated by MLR model
Method Selected Wavelength/nm rcal2 SEC rval2 SEP Bias RPD
NIRS 910+880+920+1000+1014 0.805 0.264 0.799 0.269 0.092 2.2
NIR Imaging 880+910+920+1014+990 0.794 0.270 0.769 0.294 0.073 2.0
Note: arcal2, SEC, rval2, SEP, and RPD indicate coefficient of determination of calibration, standard error of calibration, coefficient of determination of validation, standard error of prediction, and relative performance determination (RPD = SD, standard deviation /SEP), respectively.
3.2 PLSR model for rice protein estimations
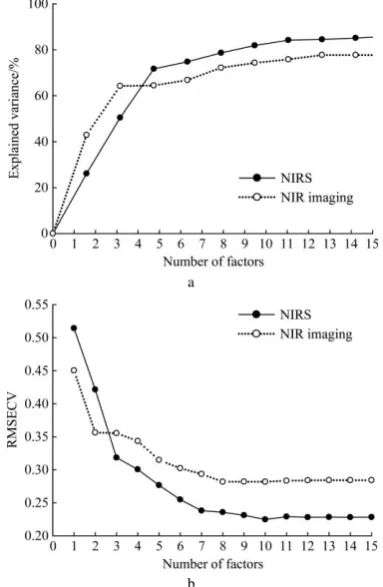
Figure 5 displays results of the NIRS and the NIR imaging system with wavelength ranged from 870 to 1014 nm employing the PLSR model. The explained variances of the two devices both increased with the added factor numbers, but the increasing slops slow down as the number of factors exceeded the thresholds. Moreover, similar trends in the variations of the root mean square errors of cross validation (RMSEV) in both two detective systems are obtained. According to the suggestion from the Unscrambler software, the numbers of factors utilizing the PLSR model were 7 for the NIRS and 8 for the NIR imaging system, respectively.
a
b
Figure 5 Effects of the factor number on the (a) explained variance (%), and (b) root mean square error of cross validation
(RMSECV) in the calibration using PLSR model
Because the PLSR model calculated every spectrum among the selected wavelength ranges, effects on different wavelength range input would be more apparent. Therefore, effectively capture the wavelength range containing important information would obviously improve the system efficiency and maintain the prediction accuracy. The detective results of the NIRS utilizing the PLSR model within different wavelength ranges are shown in Table 2. The detective efficiency results of NIRS in the PLSR model with a wavelength range of 1100-2500 nm expressed rval2 of
0.934 and SEP of 0.157%; whereas those within wavelength range of 870-1014 nm were rval2 of 0.859 and SEP of 0.226%.
Obviously, the prediction accuracy of MLR model using a smaller wavelength range with the maximum wavelength of 1,014 nm is inferior to the PLSR model. The validation results of the NIR imaging system employing the PLSR system with wavelength range from 870 to 1014 nm are rval2=0.782, SEP=0.274%, and
Bias=0.030, respectively. Those predictive results show that NIRS possess a high accuracy predicting capability on the rice protein content. While the predicting capability is lower than the NIRS, the potential of the NIR imaging system on non-detective application for rice protein should be prospective.
Table 2 Differences of prediction resultsa between the NIRS
and the developed system evaluated by PLSR model
Method Wavelength range/nm
Factor number rcal
2 SEC rval2 SEP Bias RPD
NIRS 1100-2500 12 0.943 0.140 0.934 0.157 0.028 3.7 870-1014 7 0.869 0.216 0.859 0.226 0.046 2.6 NIR imaging 870-1014 8 0.826 0.249 0.782 0.274 0.030 2.1 Note: arcal2, SEC, rval2, SEP, and RPD indicate coefficient of determination of calibration, standard error of calibration, coefficient of determination of validation, standard error of prediction, and relative performance determination (RPD = SD, standard deviation /SEP), respectively.
3.3 ANN model for rice protein estimations
necessary to optimize the neurons numbers in the hidden layers. In this work, the 5 significant wavelengths selected from the MLR model and the rice protein contents were respectively supplied for the input and output of the ANN network. Figure 6 illustrates the effects of the hidden neurons numbers on the error indices. Because the irregular trends of et and em, both et and em cannot
optimize the number of hidden nodes. Besides, the maximum Da
approaches when three hidden neurons were used. It means the optimal hidden neurons number was three by criterion of the maximum Da. Meanwhile, the optimal ANN model of NIRS was
also established by the same approach.
The ANN model established by NIRS shows the coefficient of determination of the training and monitoring sets of 0.857 and 0.841, respectively; the prediction result of the rval2 was 0.824
(Table 3). On the other hand, detection results of the developed system were rval2 of 0.806 and rcal2 of 0.845. Because the
validation set did not used in training networks, the rval2 was lower
than the rcal 2
. Moreover, the prediction results between validation
and monitoring sets are alike. The results indicate that the ANN model should be suitable for the rice protein content prediction.
Figure 6 Effects of hidden neurons numbers on the mean square error of training set (et), the mean square error of monitoring set
(em), and the degree of approximation (Da)
Table 3 Differences of prediction resultsa between the NIRS and the developed system evaluated by ANN model
Instrumentation Components b
Training set Monitoring set Validation set
rcal2 SEC MSE r2 MSE rval2 SEP Bias RPD
NIRS 5,3,1 0.857 0.230 0.132 0.841 0.147 0.824 0.257 0.080 2.3
NIR Imaging 5,3,1 0.845 0.241 0.138 0.832 0.156 0.806 0.266 0.073 2.2
Note: a rcal2, SEC, rval2, SEP, and RPD indicate coefficient of determination of calibration, standard error of calibration, coefficient of determination of validation,
standard error of prediction, and relative performance determination (RPD = SD, standard deviation /SEP), respectively.
b
Net architecture (i, h, o); i: neurons in the input layer; h: neurons in the hidden layer; o: neurons in the output layer. The predictive results of the rice protein utilizing the
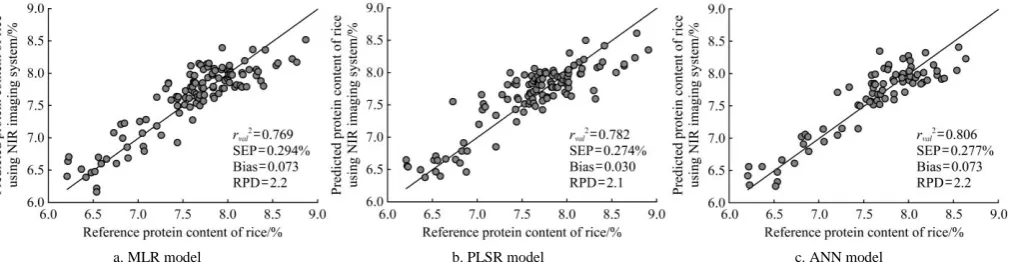
developed NIR imaging system employed the MLR, PLSR, and ANN methods are shown in the Figure 7. The MLR model selected 5 wavelengths that related to the rice protein content to establish the calibration equation, and the results were rval2 of 0.769,
SEP of 0.294%, Bias of 0.073, and RPD of 2.0, respectively. The PLSR model used spectrum of 15 wavelengths ranging from 870 to 1,014 nm, possesses a better predicting accuracy (rval2 = 0.782,
SEP = 0.274%, Bias = 0.030, and RPD = 2.1) than that of the MLR model. The ANN network that input using the 5 wavelengths spectrum selected by the MLR has a higher accuracy of prediction results (rval2 = 0.806, SEP = 0.266%, Bias = 0.073, and RPD = 2.2)
than those of the MLR model; meanwhile, the results was similar to those of the PLSR model. Therefore, utilizing the NIR imaging system for the predicting assessment on rice protein content, the ANN model is recommended from this study.
a. MLR model b. PLSR model c. ANN model
Figure 7 The predicted protein contents with MLR, PLSR, and ANN models vs. their reference values (n = 60)
4 Conclusions
The developed imaging system consisted of a NIR camera, filters, an automatically exchange filters device, and the imaging processing techniques. This study utilized the imaging method to measure the spectrum absorption employed the MLR, PLSR, and ANN analysis models to detect the rice protein content. The measurements of the NIRS were used to establish the calibration model of the system, and the predictive results of the NIRS and the system were compared. In the MLR model, the NIR imaging system used the calibration equation that was consisted of 5 wavelengths (880 nm, 910 nm, 920 nm, 1000 nm, and 1014 nm) to
predict the rice protein content, and had rval2 and SEP results of
0.782 and 0.274%, respectively. The NIR imaging system used 15 filters ranging from 870 to 1014 nm in the PLSR model, the predictive results expressed a better performance (rval
2
= 0.782, and
SEP = 0.274%) than that of the MLR model. However, the required spectrum amount of PLSR model was much more than that of the MLR. The ANN model, the net input using the 5 spectrum wavelengths selected by the MLR, simplified the model, and the predicting results (rval2 = 0.806, and SEP = 0.266%) were similar to
show that NIRS possess a high accurate predicting capability on the rice protein content. Moreover, with advantages of simple, convenient operation and high detection accuracy, the developed NIR imaging system shows commercial potential in non-destructive detection of rice protein content.
[References]
[1] Wu J Y. Rice starch. Food Industry, 1988; 20: 17–23.
[2] Yamashita R. New technology in grain post harvesting. Farm Machinery Industry Research Corp., 1993, Tokyo, Japan.
[3] Marshall W E, Wadsworth J. I. Introduction. In “Rice Science and Technology”, 1st
ed. Marcel Decker, New York, 1994; pp.1–15.
[4] Yang L, Chen J H, Xu T, Yang H K. Rice protein improves oxidative stress by regulating glutathione metabolism and attenuating oxidative damage to lipids and proteins in rats. Life Science, 2012; 91: 389–394. [5] Juliano B O. Relation of some properties of rice starch and protein to
eating quality preferences for milled rice in Asia. Getreide Mehl, 1966; I: 8.
[6] Martin M, Fitzgerald M A. Proteins in rice grains influence cooking properties. Journal of Cereal Science, 2002; 36: 285–294.
[7] Yoshida S, Forno D, Cock J, Gomez K. Laboratory manual for physiological studies of rice. In The International Rice Research Institute3rd ed.; 1976, Philippines.
[8] Delwiche S R. Single wheat kernel analysis by near-infrared transmittance: protein content. Cereal Chemistry, 1995; 72: 11–16. [9] Windham W R, Lyon B G, Champagne E T, Barton F E, Webb B D,
McClung A M, Moldenhauer K A, Linscombe S, McKenzie K S. Prediction of cooked rice texture quality using near-infrared reflectance analysis of whole-grain milled samples. Cereal Chemistry, 1997; 74: 626–632.
[10] Rahim H A, Ibrahim S. Near infrared spectroscopy measurement: The assessment of amylose content in rice grain. Sensors & Transducers, 2013; 156: 251–258.
[11] Delwiche S R, McKenzie K S, Webb B D. Quality characteristics in rice by near-infrared reflectance analysis of whole-grain milled samples. Cereal Chemistry, 1996; 73: 257–263.
[12] Kawamura S, Natsuga M, Itoh K. Determination of undried rough rice constituent content using near-infrared transmission spectroscopy. Transactions of the ASABE, 1999; 42: 813–818.
[13] Bagchi T B, Sharm S, Chattopadhyay K. Development of NIRS models to predict protein and amylose content of brown rice and proximate com positions of rice bran. Food Chemistry, 2016; 191: 21–27.
[14] Sun D, Cen H, Weng H, Wan L, Hassan A A M, El-Manawy A I, et al. Hyperspectral imaging technology combined with genome-wide association study rapidly identifies more genes related to rice quality. ASABE Annual International Meeting, 2018; 1800489. (doi: 10.13031/ aim.201800489)
[15] Wu J G, Chunhai S, Xiaoming Z. Estimating the amino acid composition in milled rice by near-infrared reflectance spectroscopy. Field Crops Research, 2002; 75: 1–7.
[16] Verrelst J, Malenovský Z, Van der Tol C, Camps‑Valls G, Gastellu-Etchegorry J P, Lewis P, et al. Quantifying vegetation biophysical variables from imaging spectroscopy data: a review on retrieval methods. Surv Geophys, 2018; https://doi.org/10.1007/ s10712-018-9478-y
[17] Yang S, Zhao S, Hu Y, Huang H. Near infrared spectra characteristics and prediction model of protein in rice. Academia Journal of Scientific Research, 2015; 3: 61–66.
[18] Li W S, Shaw J T. Determining the fat acidity of rough rice by
near-infrared reflectance spectroscopy. Cereal Chemistry, 1997; 74: 556–560.
[19] Sitakalin C, Meullenet J F C. Prediction of cooked rice texture using an extrusion test in combination with partial least squares regression and artificial neural networks. Cereal Chemistry, 2001; 78: 391–394. [20] Chia K, Abdul Rahim H. Abdul Rahim R. Neural network and principal
component regression in non-destructive soluble solids content assessment: a comparison. J. Zhejiang Univ. Sci. B, 2012; 13: 145–151.
[21] Wan Y N. Kernal handling performance of an automatic grain quality inspection system. Transactions of the ASABE, 2002; 45: 369–377. [22] Maheshwari C V, Jain K R, Modi C K. Non-destructive quality analysis
of Indian Gujarat-17 Oryza sativa SSP Indica (Rice) using image processing. International Journal of Computational Engineering Science, 2012; 2: 48–54.
[23] Prajapati B B, Patel S. Proposed mobile rice grain analyzer device based on digital image processing with related hardware and software specifications. American International Journal of Research in Sciences, Technology, Engineering and Mathematics, 2013; 13: 217–220.
[24] Yadav B K, Jindal V K. Monitoring milling quality of rice by image analysis. Computers and Electronics in Agriculture, 2001; 33: 19–33. [25] Wan Y N, Lin C M, Liao C H, Chou. J J. Image analysis and application
of reflection of cracked rice. Agricultural Engineering, 1997; 6: 89–99. [26] Jinorose M, Prachayawarakorn S, Soponronnarit S. A novel
image-analysis based approach to evaluate some physicochemical and cooking properties of rice kernels. Journal of Food Engineering, 2014; 124: 184–190.
[27] Ajay G, Suneel M, Kumar K K, Prasad P S. Quality evaluation of rice grains using morphological methods. International Journal of Soft Computing and Engineering, 2013; 2: 35–37.
[28] Ridgeway C, Chambers J. Detection of insects inside wheat kernels by NIR imaging. Journal of Near Infrared Spectroscopy, 1998; 6: 115–119. [29] Archibald D D, Thai C N, Dowell F E. Development of short-wavelength
near-infrared spectral imaging system for grain color classification. Proceedings of Society of Photo-Optical Instrumentation Engineers, 1999; 3543: 189–198.
[30] Kong W, Zhang C, Liu F, Nie P, He Y. Rice seed cultivar identification using near-infrared hyperspectral imaging and multivariate data analysis. Sensors, 2013; 13: 8916–8927.
[31] Cogdill R P, Hurburgh C R, Rippke G R. Single-kernel maize analysis by near- infrared hyperspectral imaging. Transactions of the ASABE, 2004; 47: 311–320.
[32] Lin L H, Lu F M, Chang Y C. Development of a near-infrared imaging system for determination of rice moisture. Cereal Chemistry, 2006; 83: 498–504.
[33] AOAC. Protein. in Official methods of analysis of AOAC International 20th ed. 2016; pp.24–35.
[34] Liu P, Liang Y, Zhang L, Yu R. Artificial neural networks applied in the analysis of chemical data (1)-approximation for over-fitting. Journal of the Chinese Chemical Society, 1996; 17: 861–865.
[35] Dou Y, Sun Y, Ren Y Q, Ren Y L. Artificial neural network for simultaneous determination of two components of compound paracetamol and diphenhydramine hydrochloride powder on NIR spectroscopy. Analytica Chimica Acta, 2005; 528: 55–61.
[36] Shenk J S, Workman J, Westerhaus M O. Application on NIR spectroscopy to agriculture products. in Handbook of Near-Infrared Analysis. Burns D A, Ciurczak E W, 1st ed. Marcel Dekker, New York, 1992; pp.383–427.