Drying characteristics, quality and safety aspects of bamboo
shoots using difference drying methods
Chamaiporn Mahayotpanya
*, Singhanat - Phoungchandang
(Department of Food Technology, Khon Kaen University, Thailand)
Abstract: Physical and chemical properties of bamboo shoots revealed that the middle part of bamboo shoots was suitable for drying and consumption. The optimum conditions for cyanide reduction were boiling at 100°C for 30 min. Modified Halsey and Modified Oswin models were the best fit for fresh and boiled bamboo shoots, respectively. Drying constant was increased with high drying temperature or microwave power as well as boiling treatment. The three parameter model was the most effective model to describe the drying behaviors of bamboo shoots. Boiled bamboo shoots and dried using microwave power at 720 W could decrease drying time up to 20 fold and increase the retention of total phenolics (11.08%), 2, 2-diphenyl-1-picrylhydrazyl (DPPH) (20.75%) and 2, 2'-azino-bis (3-ethylbenzthiazoline-6-sulphonic acid) (ABTS) (2.13%) compared to conventional tray drying at high temperature of 60°C and provide the lowest cyanide residue and shortest drying time.
Keywords: antioxidant activity, bamboo shoot, cyanide residue, freeze drying, microwave drying, tray drying
Citation: Mahayotpanya, C., and S. Phoungchandang. 2016. Drying characteristics, quality and safety aspects of bamboo shoots using difference drying methods. Agricultural Engineering International: CIGR Journal, 18(3):205-219.
1 Introduction
1Bamboo shoots or bamboo sprouts are the edible
shoots of many bamboo species including
Dendrocalamus asper Backer, Bambusa vulgaris and
Phyllostachys edulis. Bamboo shoots contain low fat
and cholesterol but high protein, carbohydrate, fiber,
minerals and vitamins (Chongtham et al., 2011). Like
all high moisture foods, bamboo shoots have quite short
shelf life and are very prone to microbial degradation
(Bal et al., 2011). Due to seasonal availability of
bamboo shoots, processing for removal of cyanide
residue in raw bamboo shoots while the increase of the
value added products assumes great significance for
business potential (Satya et al., 2010).
In biological materials including foods, water exists
with either unhindered or hindered mobility, is referred to
as free and bound water, respectively. There are limited
Received date: 2015-11-09 Accepted date: 2016-02-28
*Corresponding author: Chamaiporn Mahayotpanya,
Department of Food Technology, Khon Kaen University. Email: Thailand [email protected]
data available on the drying properties of bamboo shoots.
Choudhury et al. (2011) presented adsorption and
desorption isotherms for raw bamboo (Dendrocalamus
longis-pathus) shoots using BET, Caurie and GAP
equations. Drying is a conventional process of
removing moisture from a food product which is
accomplished by heat. In this process, there are two
transport phenomena, including moisture movement and
heat transfer, which occur simultaneously. Some
researchers have conducted experimental investigations
on the drying of bamboo shoots, including
Wongsakpairod (2000) for comparison of superheated
steam with low temperature and high temperature hot air
drying; Li et al. (2002) for the comparison of traditional
convective hot air flow drying with vacuum freeze
drying; Madamba (2003) for a convection oven and tray
drying; Xu et al. (2005) for two-stage hybrid method of
drying; Bal et al. (2010) for microwave drying in the
range from 140 to 350 W; Kumar et al. (2013) for
thin-layer drying using convection tray drying at 55°C,
65°C and 75°C; Badwaik et al. (2014) for osmo-vacuum
air drying; Zheng et al. (2014) for hot air thin layer drying
at 80°C. However, there are limited data on the drying
characteristics and antioxidant activities of bamboo shoot
to compare the data among different dryers including
tray, microwave and freeze dryers.
1.1 Moisture isotherm models
Moisture isotherms are useful tools to predict
microbial activity and chemical changes that occur in
foods. This relationship shows how equilibrium
moisture content (Xe) varies with water activity (aw).
Moreover, the relationship varies with temperature (T), as
well as whether moisture is removed from a moist food or
adsorbed into a dry food. Numerous models have been
developed for predicting the relationship between
moisture content (X), water activity (RHe) and
temperature whereas C1, C2 and C3 are empirical
constants, of which four are shown in Table 1. The
goodness of fit for the models was evaluated using the
coefficient of determination (R2) and standard error of estimate (SEE). The highest R2 and lowest SEE (Equation 1) values were used to choose the most
appropriate models.
.
.
)
(
SEE
2 exp, 1
,
f
d
X
X
iN
i
i pre
(1)The degree of freedom (d.f.) of the fitting Equation is n-1.
1.2 Drying models
Numerous drying models have been developed to
describe thin layer drying, of which five models are
shown in Table 2. It is assumed that the rate of moisture
loss of material is proportional to the difference between
moisture content and equilibrium moisture content (Xe).
MR is moisture ratio (X-Xe/Xo-Xe).
The drying constant, K, can be related to temperature
using the Arrhenius model.
15
.
273
T
exp
b
a
K
(2)
The K values usually depend on temperature, and are
often related to temperature through an Arrhenius model:
/
T
exp
0
E
R
K
K
a (3)Where, K0, Ea and R are pre-exponential factor, activation
energy and universal gas constant, respectively.
The drying exponent (N), in turn, is described as a
function of temperature and relative humidity (RH).
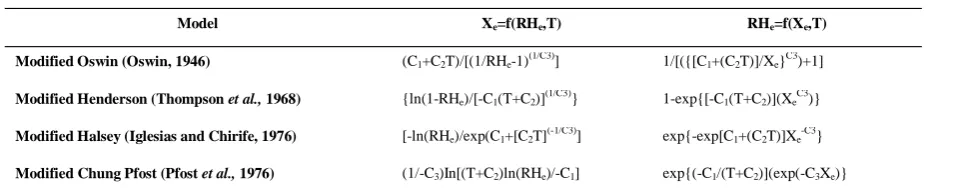
Table 1Sorption isotherm equations
Model Xe=f(RHe,T) RHe=f(Xe,T)
Modified Oswin (Oswin, 1946) (C1+C2T)/[(1/RHe-1)(1/C3)] 1/[({[C1+(C2T)]/Xe}C3)+1]
Modified Henderson (Thompson et al., 1968) {ln(1-RHe)/[-C1(T+C2)](1/C3)} 1-exp{[-C1(T+C2)](XeC3)} Modified Halsey (Iglesias and Chirife, 1976) [-ln(RHe)/exp(C1+[C2T](-1/C3)] exp{-exp[C1+(C2T)]Xe-C3}
Modified Chung Pfost (Pfost et al., 1976) (1/-C3)In[(T+C2)ln(RHe)/-C1] exp{(-C1/(T+C2)](exp(-C3Xe)}
Table 2Thin-layer drying models
Model Equation References
Newton MR=exp(-Kt) Lewis (1921)
Henderson and Pabis MR=A exp(-Kt) Henderson and Pabis (1961)
Modified Page MR=exp(-Kt)N Overhult et al. (1973)
Zero model X=X0 exp(-Kt) Phoungchandang and Woods (2000)
/
T
exp
RH
C
A
N
B
(4)Where, B and C are empirical constants.
One approach for determining the effective moisture
diffusivity, Deff, is by fitting the drying data to a diffusion
model for a slab shape object.
2 2 2
0
4
t
exp
8
L
D
X
X
X
X
effe
e
(5)Where, L and t are half thickness of bamboo slices and
time.
A modified form of the Arrhenius equation may be
used to show whether the rate constant varies with the
sample amount (m) and microwave power (P) (Dadali et
al., 2007).
K
K
0exp
E
a
m
/
P
(6) The objectives of this study were to investigatephysical and chemical properties of raw bamboo shoots to
select the most suitable part for drying process, reduction
of cyanide residue in fresh bamboo shoots, desorption
isotherms, moisture diffusivities and drying constant over
a range of temperature and humidity for bamboo shoots
by tray and microwave drying. The effects of drying
temperatures, microwave outputs and freeze drying on the
final qualities of dried bamboo shoots including colour
values, rehydration ratio, total phenolics, antioxidant
activities and cyanide residue were also performed.
2 Materials and methods
2.1 Materials and its Physical and chemical properties
Bamboo shoots (Dendrocalamus asper Backer) or
sweet bamboo shoots were harvested from a private
garden in Khon Kaen Province, Thailand. Physical and
chemical properties of the bamboo shoots were
determined in terms of bamboo part; such as upper,
middle and lower parts. Moisture content (AOAC,
2000), proximate analysis, such as protein, fat, ash, crude
fiber (AOAC, 2000) and colour values (CIE LAB) were
determined.
2.2 Study of boiling time on cyanide residue
The bamboo shoots were cleaned in 5 ppm
chlorinated tap water and peeled. The suitable parts of
bamboo shoot were cut into 10 cm thickness and were
boiled at 100°C for 0, 30, 60, 90 and 120 min
respectively. Then, the boiled bamboo shoots were used
to determine cyanide residue by using the modified
method of Chueachot (2008).
2.3 Desorption isotherms
Three hundred grams of the fresh and boiled bamboo
shoots were placed on pre-weighed drying trays and
placed in a Model UOP8 heated-air tray dryer (Armfield
Limited, Ringwood Hampshire, England). Samples
were dried at an air temperature of 50°C to seven
different levels of moisture content (Phoungchandang and
Woods, 2000). The corresponding water activity was
measured at each moisture content using an AquaLab
Series 3TE water activity meter (Decagon Device Inc.,
Pullman, Washington). The device determined both
temperature and dew point, using a chilled-mirror
technique, from which water activity was recorded. The
temperature in the hermetic chamber of the meter was
regulated with a controller to within 0.3°C, and could be
set between 5°C and 50°C. Desorption isotherms were
determined at 20°C, 35°C and 50°C, respectively.
2.4 Methods
2.4.1 Tray drying
The suitable parts of bamboo shoots were sliced into
2 mm thickness and the bamboo shoot slices of 300 g
were dried in a heated-air tray dryer (TD) (Model UOP8,
Armfield Limited, Ringwood Hampshire, England) at
temperatures of 40°C, 50°C and 60°C and air speed of 0.5
m/s. The air passed over a bank of electrical heaters to
create the desired drying air temperature. An
anemometer (Model 3K-27V No. 7680-00, SATO
KEIRYOKI, Tokyo, Japan) with an accuracy of 0.01 m/s
was used to determine air velocity. A relative humidity
meter (Vaisala model HMP-5D, DELTA OHM-VIAG,
Galilei, Italy) with a precision of 0.1% RH was used to
The tray dryer was designed for in situ weighing of
the samples in thin layer. During the drying period, the
weight of the sample was recorded every 5 min using a
data logger (DT 800 Data Taker, Scoresby, Victoria,
Australia). Drying was terminated when the moisture
content of the samples reached 16.0% (d.b.). The final
moisture content was terminated so as to give an aw less
than 0.6.
2.4.2 Microwave drying
Microwave drying (MD) was accomplished in a
microwave system (Electrolux 30 liter, EMS3067x, AB
Electrolux, Stockholm, Sweden) with a magnetron
operating at a frequency of 2,450 MHz (=12.14 cm).
The microwave system was set to deliver power at 270 W
(30% setting), 450 W (50% setting) and 720 W (80%
setting). The suitable part of fresh or boiled bamboo
shoot slices of 100 g were placed on the 35 cm diameter
glass turntable and caused to rotate at regular time
intervals at 4 r/min. The direction of the rotations was
able to be changed with the exterior on/off switch.
During MD drying, the moisture content was
monitored by periodically removing the turntable (with
sample) and weighing it on a digital balance to the nearest
0.01 g. The weighing process was completed within 10
s. Drying was terminated when the moisture content of
the samples was reduced such that the aw was less than
0.6.
2.4.3 Freeze drying
Freeze drying (FD) was performed in a GAMMA
2-16LSC laboratory freeze dryer (Martin Christ
Gefriertrocknungsanlagen, Osterode am Harz, Germany).
The suitable part of fresh or boiled bamboo shoot slices
of 300 g were placed on the unheated shelves and frozen
at -50°C. FD was initiated at 0.15 mbar (15 Pa), with
the condenser operating at -85°C. Sublimation energy
was supplied by ambient radiation reaching the samples
through the clear glass drying chamber. Drying was
completed within 24 h.
2.5 Mathematical modeling of drying data
The changing product weight was used to calculate
moisture content and moisture ratio (X-Xe/Xo-Xe) as a
function of time. The moisture ratio data were fitted by
five different thin-layer models as is shown in Table 2.
Regression analysis was used to determine the constants,
K, A and N using SPSS 19 statistical software (SPSS Inc.,
Chicago, IL). The drying constant K was determined at
each drying temperature. The drying constant, K could
be related to temperature using the Arrhenius model
(Equation 2). For MD, Ea was determined using
Equation 6. The effective diffusivity (Deff) was
calculated using the simplified solution of Fick’s second
law (Equation 5). The best model describing the thin
layer drying for bamboo shoots was chosen for that with
the highest R2 and lowest SEE.
2.6 Colour measurements
The colour of the bamboo shoots was measured
before and after drying using a HunterLab (UltraScan,
XE U3115, Colour Global Co., Virginia, America). The
colour values were measured using the CIE LAB colour
space. The scale represented the range of L* from 0 to
100 (black to white), -a* (green) to +a* (red), and –b*
(blue) to +b* (yellow). Total colour difference was also
determined(
2 / 1 2 2
2
*
*
*
*
L
a
b
E
).2.7 Rehydration ratio
The ability of dried bamboo shoots to reabsorb water
was measured using the rehydration ratio.
Approximately 5 g of dry sample was rehydrated with
500 mL of distilled water at 30°C for 20 minutes. The
rehydration ratio was calculated as the weight of the
drained sample (wd) compared to the weight of dried
sample (w) (Phoungchandang, 1986).
2.8 Cyanide residue
Preparation of standard curve of cyanide residue was
conducted according to Chueachot (2008) with some
modifications. The calibration curve was established
using standard solution concentration containing 0.2, 0.4,
0.6, 0.8, 1.0, 1.2, 1.4 and 1.6 mg/L of cyanide and were
which 0.8 mL of 0.08 mol/L ninhydrin and 0.8 mL of 0.4
mol/L sodium carbonate were added; the solution was
kept aside for about 30 min for completion of the reaction
to give a deep-red colour, then added 0.4 mL of 1%(v/v)
Tween 20 as micellar media and diluted to mark with 2.5
mol/L of sodium hydroxide. The deep-blue colour was
kept aside about 30 min for complex stability. After
mixing the solutions, the absorbance of each solution was
determined by a spectrophotometer (UV-1800, Shimadzu,
Japan) at 598 nm.
To determine the cyanide residue, about 5 g raw and
2 g dried bamboo shoot were mixed with 0.5 mol/L
sulfuric acid (20 mL) on a mechanical shaker for 15 min.
The mixture was heated to 60°C for five min and filtered
by a vacuum filter. Then, the extract was made up to 20
mL by sulfuric acid. Then, 0.25 mL of the extract was
diluted to 25 mL by sulfuric acid (1:100 dilution) as stock
solution. Then, 0.25 mL of stock solution was added
with 0.8 mL of 0.08 mol/L ninhydrin and 0.8 mL of 0.4
mol/L sodium carbonate; the solution was kept aside for
about 30 min, then added 0.4 mL of 1%(v/v) Tween 20
and diluted to 5 mL with 2.5 mol/L of sodium hydroxide.
The aliquot was kept aside about 30 min. After mixing,
the absorbance was determined by a spectrophotometer
(UV-1800, Shimadzu, Japan) at 598 nm. The results
were expressed as mg KCN/kg wet mass for fresh
bamboo shoot and mg KCN/kg dry mass for dried
bamboo shoot (Chueachot, 2008).
2.9 Antioxidant activities
About 5 g raw and 2 g homogenized dried bamboo
shoot were extracted with 99.99% methanol (10 mL) on a
mechanical shaker for two hr. The mixture was
centrifuged at 10,000 g at 4°C for 20 min. The extracts
were filtered through a Whatman paper No. 1. The clear
extracts were made up to 25 mL using 99.99% methanol.
The clear extracts were analyzed both for determination
of total phenolics and antioxidation activity.
2.9.1 Total phenolics
The amount of total phenolics in the extracts was
determined according to Folin-Ciocalteu procedure
(Turkmen et al., 2005) with some modifications. The
extracts (300 µL) were introduced into test tubes; 1.5 mL
of Folin-Ciocalteu’s reagent and 1.2 mL of sodium
carbonate (7.5%) were added. The tubes were mixed
and allowed to stand for 30 min. Absorbance at 765 nm
was measured (UV-1800, Shimadzu, Japan). The results
were expressed as mg gallic acid equivalents
(mgGAE/100g dry mass).
2.9.2 DPPH assay
The DPPH assay was conducted according to the
method of Martinez et al. (2012) with some
modifications. A stock solution was prepared by
dissolving 0.0240 g DPPH with 100 mL of 99.99%
methanol. The working solution was obtained by
mixing 40 mL stock solution with 240 mL of 99.99%
methanol (ratio of 1:6) to obtain an absorbance of
0.94±0.02 units at 515 nm using a spectrophotometer
(UV-1800, Shimadzu, Japan). The extracts (300 µL)
were allowed to react with 4 mL of DPPH solution for 30
min in the dark. Then, the absorbance was determined
at 515 nm. The results were expressed as mg Trolox
equivalents (mgTE/100g dry mass).
2.9.3 ABTS assay
For ABTS assay, the procedure was followed by the
method of Matinez et al. (2012) with some modifications.
A stock solution of ABTS was prepared by dissolving
0.0360 g ABTS and made up to 10 mL with deionized
water. A stock solution of K2S2O6 was prepared by
dissolving 0.0070 g K2S2O6 and made up to 10 mL with
deionized water. Then, the stock solution of ABTS and
K2S2O6 were mixed together with the ratio of 1:1. The
ABTS+ solution was allowed to stand for 12-16 h in the dark. Fresh ABTS+ solution was prepared for each assay. Then, 1 mL of ABTS+ solution was mixed with 60 mL 99.99% methanol to obtain an absorbance of
1.1±0.02 units at 734 nm using a spectrophotometer
(UV-1800, Shimadzu, Japan). The extracts (300 µL)
determined at 734 nm. The results were expressed as
mg Trolox equivalents (mgTE/100g dry mass).
3 Results and discussion
3.1 Physical and chemical properties of bamboo shoots
Physical and chemical properties of bamboo shoots
(Dendrocalamus asper Backer) are shown in Table 3. It
was found that the middle part of bamboo shoots
contained rather high protein (19.77±3.09% d.b.) and
crude fiber (10.62±0.59% d.b.) and provided the highest
ash content of 12.63±0.08% d.b. which were suitable for
consumption. The results of this work were agreed with
Satya et al. (2010) that bamboo shoots contained high
protein and minerals but low fat content. The amino
acid content of bamboo shoots was much higher than
found in other vegetables such as cabbage, carrot, onion
and pumpkin. Therefore, the middle part of bamboo
shoots was suitable for the drying process.
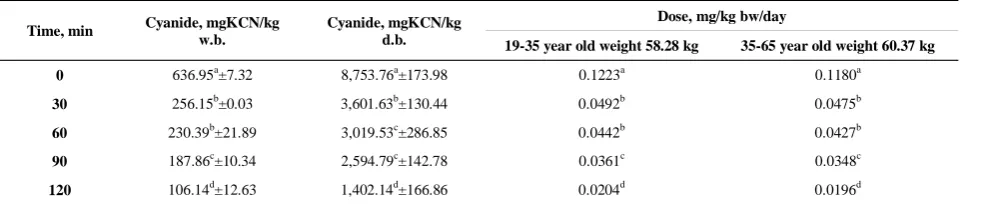
3.2 The study of boiling time on cyanide residue
The bamboo shoots were cleaned in 5 ppm
chlorinated tap water and peeled. The middle parts of
bamboo shoots were boiled at 100°C for 0, 30, 60, 90 and
120 min (Table 4). It was found that cyanide residue in
bamboo shoots were decreased with increased boiling
time (p≤0.05). FSANZ (2004) reported that bamboo
shoots, sliced into thin strips librated hydrogen cyanide,
were removed by boiling. The acute lethal dose of
hydrogen cyanide for human being was reported to be
0.5-3.5 mg/kg bw/day. Therefore, the optimum
conditions for cyanide reduction were boiling at 100°C
for 30 min (Table 4). In the boiling process, peroxidase
could be destroyed. Zheng et al. (2014) reported that
blanching bamboo shoot slices at 95°C for six min could
completely inactivate peroxidase activities.
3.3 Desorption isotherms
The desorption isotherms were essential to defining
the safe storage moisture content and used to determine
Xe of dried bamboo shoots. Results within the range of
20°C to 50°C and 0.25-0.88 RH for fresh and boiled
bamboo shoot slices are presented in Figure 1.
Desorption isotherms models in Table 1 were fitted to the
data using SPSS 19.0 for Windows. Both Xe=f(RHe, T)
and RHe=f(Xe, T) model forms were fitted as minimum
error or in the prediction of Xe or RHe, generated
different constants in the fitted model (Sun and Wood,
1994). The constants, C1, C2 and C3 in the desorption
Table 3Physical and chemical properties of raw bamboo shoots
Part of shoot Moisture content , %w.b. Moisture content , %d.b. Protein, %d.b. Fat, %d .b. Ash, % d.b. Crude fiber, %d. b. Density, kg/m3 Color values
L* a* b* C* h* (°)
Upper 92.95 b
± 0.11
1,319.26b± 21.09
24.34a± 1.78
0.36a± 0.17
9.42c± 0.06
8.61c± 1.05
984.23a± 7.76
82.23a± 2.04
-0.98b± 0.55
21.50a± 4.53
21.52a± 4.53
92.53a± 1.50 Middle 93.23
a ± 0.12
1,377.98a± 25.95
19.77b± 3.09
0.25a± 0.12
12.63a± 0.08
10.62b± 0.59
991.44a± 11.50
78.06b± 1.88
0.15a ±0.53
17.98b± 2.37
17.98b± 2.38
89.68b± 1.54 Lower 93.25
a ± 0.05
1,381.61a± 11.89
11.43c± 0.72
0.32a± 0.08
10.76b± 0.13
13.93a± 0.49
993.22a± 2.65
78.84b± 2.01
0.44a± 0.91
16.84b± 2.65
16.86b± 2.68
88.77b± 2.49 Different superscripts in the same column mean that the values are significantly different (p≤0.05)
Table 4Effect of boiling time on cyanide residue
Time, min Cyanide, mgKCN/kg w.b.
Cyanide, mgKCN/kg d.b.
Dose, mg/kg bw/day
19-35 year old weight 58.28 kg 35-65 year old weight 60.37 kg 0 636.95a±7.32 8,753.76a±173.98 0.1223a 0.1180a
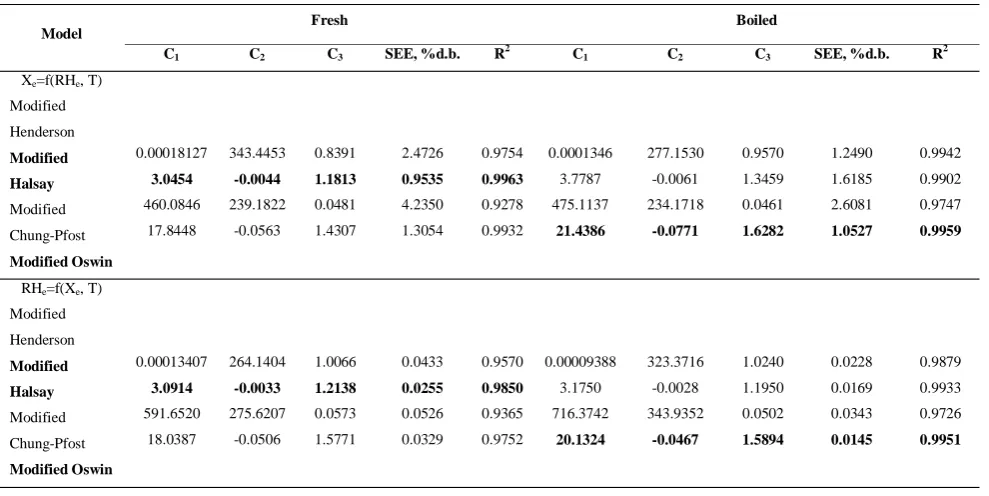
isotherms (Table 5) were to support the sigmoid shape of
desorption isotherm curves. For fresh bamboo shoots,
Modified Halsay model was the best fit for both
Xe=f(RHe, T) and RHe=f(Xe, T) functions having the
lowest SEE of 0.9535 and 0.0255%d.b., respectively and
the highest R2 of 0.9963 and 0.9850, respectively. Whereas boiled bamboo shoots, Modified Oswin model
was the best fit for both Xe=f(RHe, T) and RHe=f(Xe, T)
functions having the lowest SEE of 1.0527 and
0.0145%d.b., respectively and the highest R2 of 0.9959
and 0.9951, respectively (Table 5). Choudhury et al.
(2011) presented adsorption and desorption isotherms for
raw bamboo shoots at 20°C, 30°C and 35°C; however,
the work above was performed at low temperatures and
was not suitable to apply at higher drying temperature.
They reported that Caurie model was the best fit for
bamboo shoots; however, the model had no temperature
effect on desorption isotherms and could not be applied to
this work.
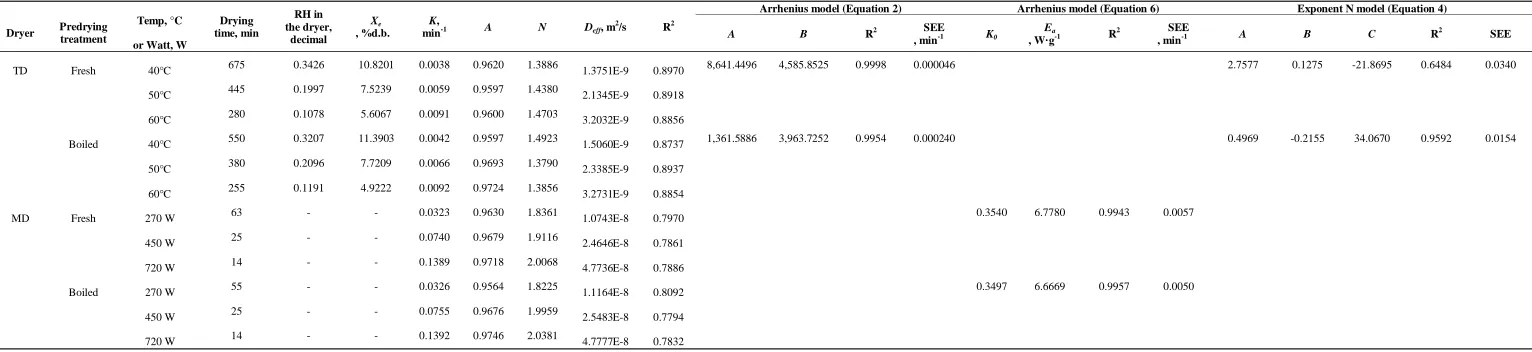
3.4 Modeling of drying kinetics
The experimental conditions for TD and MD of
fresh and boiled bamboo shoots are illustrated in Table 7.
The drying was terminated when the sample moisture
content was decreased to 13.80% w.b. (16.0% d.b.) which
provided the water activity of 0.5 (Figure 1) as considered
for microbiological safe level. Foods with water
activities below 0.61 will not support the growth of
micro-organism (Garbutt, 1997). Bamboo shoots were
dried using TD at drying temperature of 40°C, 50°C and
60°C and MD at 270, 450 and 720 W. In this work, the
drying data were fitted
Table 5Constants of desorption isotherms for fresh and boiled bamboo shoots
Model Fresh Boiled
C1 C2 C3 SEE, %d.b. R2 C1 C2 C3 SEE, %d.b. R2
Xe=f(RHe, T) Modified Henderson Modified Halsay Modified Chung-Pfost Modified Oswin 0.00018127 3.0454 460.0846 17.8448 343.4453 -0.0044 239.1822 -0.0563 0.8391 1.1813 0.0481 1.4307 2.4726 0.9535 4.2350 1.3054 0.9754 0.9963 0.9278 0.9932 0.0001346 3.7787 475.1137 21.4386 277.1530 -0.0061 234.1718 -0.0771 0.9570 1.3459 0.0461 1.6282 1.2490 1.6185 2.6081 1.0527 0.9942 0.9902 0.9747 0.9959
by five drying models as is shown in Table 2. In
TD, the Xe of fresh and boiled bamboo shoots predicted
from the Modified Halsey and Modified Oswin,
respectively were used to determine K, A and N. For
MD, the Xe was assumed to be zero and the moisture ratio
was simplified to be a form of X/Xe. The K, A and N
were determined by minimized sum of squares of the
differences between the observed and fitted values of Figure 1 Desorption isotherm at 20°C, 35°C and 50°C as predicted using the fitted Modified Halsey model for fresh
bamboo shoot (a) and Modified Oswin model for boiled bamboo shoot (b) compared with the observed
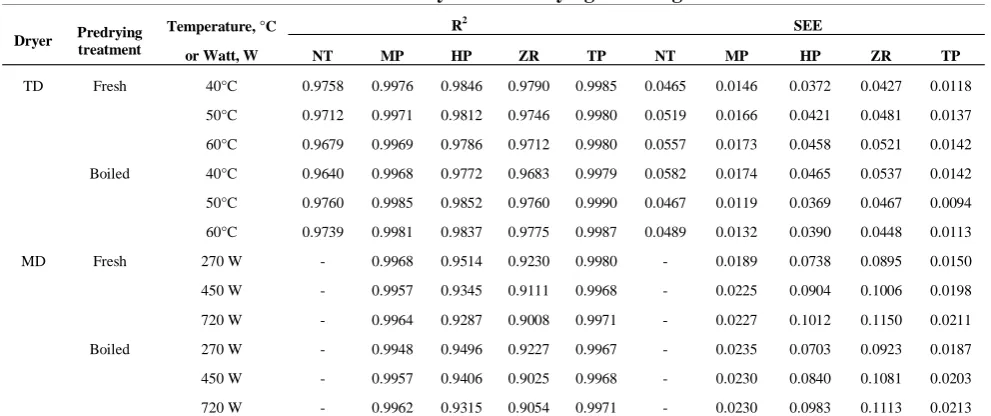
moisture ratio as well as R2. The results in Table 6 and Figure 2 showed that TP model was the best fit to explain
the mass transport of moisture in drying of fresh and
boiled bamboo shoots as well as MD because of the
lowest SEE and highest R2.
Table 6Results of statistical analysis on the drying modeling of bamboo shoots
Dryer Predrying treatment
Temperature, °C or Watt, W
R2 SEE
NT MP HP ZR TP NT MP HP ZR TP TD Fresh 40°C 0.9758 0.9976 0.9846 0.9790 0.9985 0.0465 0.0146 0.0372 0.0427 0.0118
Table 7Drying time, RH, Xe, K, A, N, Deff, Ea and constants in the Arrhenius model
Dryer Predrying treatment
Temp, °C
or Watt, W Drying time, min
RH in the dryer,
decimal
Xe
, %d.b.
K,
min-1 A N Deff, m
2
/s R2
Arrhenius model (Equation 2) Arrhenius model (Equation 6) Exponent N model (Equation 4)
A B R2 SEE
, min-1 K0
Ea
, W·g-1 R2 SEE
, min-1 A B C R2 SEE
TD Fresh 40°C 675 0.3426 10.8201 0.0038 0.9620 1.3886 1.3751E-9 0.8970 8,641.4496 4,585.8525 0.9998 0.000046 2.7577 0.1275 -21.8695 0.6484 0.0340
50°C 445 0.1997 7.5239 0.0059 0.9597 1.4380 2.1345E-9 0.8918
60°C 280 0.1078 5.6067 0.0091 0.9600 1.4703 3.2032E-9 0.8856
Boiled 40°C 550 0.3207 11.3903 0.0042 0.9597 1.4923 1.5060E-9 0.8737 1,361.5886 3,963.7252 0.9954 0.000240 0.4969 -0.2155 34.0670 0.9592 0.0154
50°C 380 0.2096 7.7209 0.0066 0.9693 1.3790 2.3385E-9 0.8937
60°C 255 0.1191 4.9222 0.0092 0.9724 1.3856 3.2731E-9 0.8854
MD Fresh 270 W 63 - - 0.0323 0.9630 1.8361 1.0743E-8 0.7970 0.3540 6.7780 0.9943 0.0057
450 W 25 - - 0.0740 0.9679 1.9116 2.4646E-8 0.7861
720 W 14 - - 0.1389 0.9718 2.0068 4.7736E-8 0.7886
Boiled 270 W 55 - - 0.0326 0.9564 1.8225 1.1164E-8 0.8092 0.3497 6.6669 0.9957 0.0050
450 W 25 - - 0.0755 0.9676 1.9959 2.5483E-8 0.7794
The TP model was the best model to describe the
drying curve of bamboo shoot slices because the
exponent, N was put at the drying constant and drying
time in order to increase the dependence of drying
temperature and relative humidity of the drying air. In
addition, the constant, A was also put to an exponential
term to describe experimental data affected by diffusion
of moisture (Phoungchandang and Kongpim, 2012).
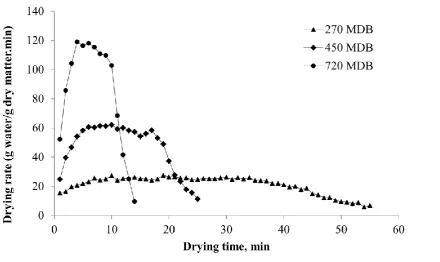
All drying in both TD and MD (Figure 3) was in the
falling rate period because drying rates were decreased
throughout the drying process. The results were agreed
with other research (Phoungchandang and Saentaweesuk,
2011; Trirattanapikul and Phoungchandang, 2014).
The drying constant was increased with high drying
temperature or high microwave power as well as boiling
treatment (Table 7). The results in Table 7 revealed
that boiling of bamboo shoots and MD at 720 W could
reduce drying time up to 20 fold compared to
conventional TD at 60°C. Fitting the Arrhenius
relationship to the results for K and drying air
temperature in TD, calculated over the full drying period,
gave the equation for TD (Table 7). For MD, a
modified form of the Arrhenius model might be used to
show whether the K varied with the m and P (Dadali et
al., 2007) as is shown in Table 7. The relationship of
the N, RH and temperature of drying air (Equation 4) for
TD is shown in Table 7. The Deff were calculated by
the method of slope (Equation 5) by using the drying
data. The Deff was increased with increasing drying
temperature, increasing microwave power or boiling
treatments (Table 7). High drying temperature
(Phoungchandang and Saentaweesuk, 2011;
Trirattanapikul and Phoungchandang, 2014) or high
microwave output (Potisate et al., 2014; Potisate and
Phoungchandang, 2015) could increase the vapor
pressure inside the bamboo shoots. Moreover, boiling
treatments also softened the tissues of the bamboo shoots;
therefore, increased the drying rate and Deff. The Deff of
fresh bamboo shoots and dried using TD were in the
range from 1.38×10⁻⁹ to 3.20×10⁻⁹ m2/s and boiled bamboo shoots were in the range from 1.51×10⁻⁹ to 3.27×10⁻⁹ m2/s. The Deff of fresh bamboo shoots and
dried using MD were in the range from 1.07×10⁻⁸ to 4.77× 10⁻⁸ m2/s and boiled bamboo shoots were in the range from 1.12×10⁻⁸ to 4.78× 10⁻⁸ m2/s. Activation energy, Ea could be calculated using the Arrhenius
model (Equation 6) and were in the range from 6.7780 to
6.6669 W/g for MD (Table 7). Moisture diffusivities in Figure 2 Moisture ratio of boiled bamboo shoots predicted from the Three parameter model compared with the
food stuff were in the range of 10-10 to 10-9 m2/s and were increased with the increasing temperature of drying
air for TD (Zogzas et al., 1996). The Deff of bamboo
shoot slices and dried in MD of this work were higher
than Bal et al. (2010) because microwave outputs (140 to
350 W) used in their work were less than this work (270
to 720 W) (Table 7).
3.5 Physical and chemical properties of dried bamboo shoots
Physical and chemical properties of dried bamboo
shoots are illustrated in Table 8. Completely
Randomized Design (CRD) was used to study the main
factors of the drying process. Quality evaluation
included colour values, rehydration ratio, cyanide residue,
total phenolics, DPPH and ABTS antioxidant activity.
Boiling of bamboo shoots provided higher ΔE* than
fresh bamboo shoots. The results revealed that
non-enzymatic reaction affected the colour of dried
bamboo shoots. Maillard reaction occurrence could be
due to protein in bamboo shoots (Table 3) and reducing
sugar (Meyer, 1973).
Boiled bamboo shoots and dried using FD provided
the highest rehydration ratio followed by fresh bamboo
shoot and dried using FD. The results of this work were
agreed with Potisate et al. (2014) because low drying
temperature of FD could not damage plant tissues and
provide porous structures of FD products.
Boiled bamboo shoots and dried using high drying
temperature or high microwave power provided lower
cyanide residue than fresh bamboo shoots. Moreover,
boiled bamboo shoots and dried at microwave power of
270-720 W provided the lowest cyanide content
compared to TD and FD. FSANZ (2004) found that
bamboo shoots, sliced into thin strips librated hydrogen
cyanide, which was removed by boiling.
Fresh bamboo shoots and dried using FD provided
the highest total phenolics, DPPH and ABTS antioxidant
activity due to low drying temperature (Potisate et al.,
2014). Fresh bamboo shoots and dried using MD at 720
W also provided the highest total phenolics. Vina et al.
(2007) found that microwave treatment induced the
greatest increases in DPPH antioxidant activity of
also found that total phenolics and DPPH in dried
Moringa oleifera leaves were increased with the increase
of microwave power from 150 W to 900 W due to the
liberation of phenolic compounds during the thermal
process. Boiled bamboo shoots and dried using MD at
microwave power at 720 W could increase the retention
of total phenolics (11.08%), DPPH antioxidant activity
(20.75%) and ABTS antioxidant activity (2.13%)
compared to conventional TD at 60°C (Table 8). The
results of this work were agreed with Potisate et al.
(2014) and Potisate and Phoungchandang (2015). In
this work, boiled bamboo shoots and dried using MD at
720 W provided high C* and h* values of yellow-orange
colour, the lowest cyanide residue, high total phenolics
and the shortest drying time.
4 Conclusions
The middle part of bamboo shoots contained rather
high protein and crude fiber and the highest ash content.
The optimum conditions for cyanide reduction were
boiling at 100°C for 30 min. Modified Halsey and
Modified Oswin models were the best fit for fresh and
boiled bamboo shoots, respectively. All drying in both
TD and MD was in the falling rate period. The K was
increased with high drying temperature or high
microwave power as well as boiling treatment. The TP
model was the most effective model to describe the
drying behaviors of both fresh and boiled bamboo shoots.
The K in the TP model was related to drying air
temperature using the Arrhenius model. A modified
form of Arrhenius model could be used to relate the K to
the m and P providing an Ea in MD. The Deff was
increased with increasing drying temperature, increasing
microwave output and boiling treatment. FD showed the
highest qualities of dried bamboo shoots. Boiled
bamboo shoots and dried using microwave power at 720
W could decrease drying time up to 20 fold and increase
the retention of total phenolics (11.08%), DPPH (20.75%)
and ABTS (2.13%) compared to the conventional tray
drying at 60°C and provide the lowest cyanide residue
and shortest drying time,
Acknowledgement
We would like to acknowledge Khon Kaen
University for the financial support throughout this
research.
Table 8Physical and chemical properties of dried bamboo shoots from TD, MD and FD
Dryer Predryi
ng treatm
ent
(°C) or (Watt)
After drying Color values Rehydratio
n ratio
Cyanide (mg/kg
d.b.)
Total Phenolics (mgGAE/100g
d.b.)
DPPH (mgTE/100g
d.b.)
ABTS (mgTE/100g
d.b.) L* C* h* (°) ∆E*
TD Fresh 40°C 67.28bc 21.76g 81.02cd 11.85e 2.71e±0.20 11.48b±0.70 396.30hi±14.91 60.26g±8.27 145.27e±8.07 50°C 70.02bc 21.50g 83.30bc 9.16ef 2.56e±0.16 11.28b±0.76 489.72fgh±24.35 88.15ef±1.44 145.67e±4.98 60°C 71.92bc 20.64g 85.31b 6.89f 2.66e±0.18 6.60de±0.39 512.88fg±20.80 124.42d±0.98 163.84d±4.03 TD Boil 40°C 55.44def 38.96bc 85.39b 30.94b 4.28d±0.17 4.35h±0.23 370.44i±16.84 58.17g±1.40 123.00f±0.25 50°C 52.01def 38.98bc 86.34b 33.54ab 4.19d±0.55 5.54efg±0.30 438.60ghi±6.45 62.78g±5.06 129.02f±1.91 60°C 50.80ef 37.02bcd 85.32b 33.30ab 4.10d±0.26 5.16fgh±0.16 432.54ghi±46.04 76.74f±6.39 129.22f±2.38 MD Fresh 270 W 73.04b 28.47f 87.53b 11.63e 2.40e±0.23 9.22c±0.12 760.96bc±123.55 154.00c±6.17 180.16c±2.14 450 W 66.09c 30.74ef 85.20b 18.12d 2.92e±0.27 6.87d±0.07 638.22de±57.62 149.91c±7.28 172.42cd±2.14 720 W 58.18d 33.46de 77.04de 25.64c 2.64e±0.15 6.16def±0.02 886.94a±24.64 155.66c±0.07 168.94d±0.27 MD Boil 270 W 49.84ef 40.78b 78.16d 36.66a 4.94c±0.24 5.00gh±0.03 465.07ghi±11.66 96.60e±15.10 167.18d±4.14 450 W 55.67de 47.00a 79.56cd 36.86a 3.82d±0.48 4.68gh±0.18 519.12fg±11.85 122.64d±10.05 170.34d±4.58 720 W 49.08f 37.62bcd 73.92e 35.56a 2.95e±0.10 4.60gh±0.23 569.72ef±1.88 150.24c±0.66 167.33d±0.33 FD Fresh 89.24a 12.78h 97.46a 12.53e 9.02b±0.04 18.04a±1.24 806.44ab±6.24 213.21a±3.00 263.50a±1.99 Boil 87.74a 34.78cde 98.14a 19.83d 10.18a±0.26 9.87c±0.55 698.74cd±17.53 197.90b±0.67 234.86b±4.01 Different superscripts in the same column mean that the values are significantly different (p≤0.05)
References
AOAC. 2000. Official methods of analysis of the Association of Official Analytical Chemists. Arlington, USA: Association of Official Analysis Chemists.
Badwaik, L. S., S. Choudhury, P.K. Borah, N. Sit, and S.C. Deka. 2014. Comparison of kinetics and other related properties of bamboo shoot drying pretreated with osmotic dehydration. Journal of Food Processing and Preservation, 38(3): 1171-1180.
Bal, L. M., A. Kar, S. Satya and S. N. Naik. 2010. Drying kinetics and effective moisture diffusivity of bamboo shoot slices undergoing microwave drying.
International Journal of Food Science and Technology, 45(11): 2321-2328.
Bal, L. M., A. Kar, S. Satya and S. N. Naik. 2011. Kinetics of colour change of bamboo shoot slices during microwave drying. International Journal of Food Science and Technology, 46(4): 827-833.
Chongtham, N., M. S. Bisht, and S. Haorongbam. 2011. Nutritional properties of bamboo shoots: potential and prospects for utilization as a health food. Comprehensive Reviews in Food Science and Food Safety, 10(3): 153-169.
Choudhury, D., J. K. Sahu, and G. D. Sharma. 2011. Moisture sorption isotherm, heat of sorption and properties of sorbed water of raw bamboo (Dendrocalamus longispathus) shoots. Industrial Crops and Products, 33(1): 211-216.
Chueachot, R. 2008. Development and validation method for trace analysis of free and bound cyanide in wine samples by spectrophotometry. M. Sc. Thesis, Khon Kaen, Thailand: Khon Kaen University.
Dadali, G., D. K. Apar, and B. Özbek. 2007. Microwave drying kinetics of Okra. Drying Technology, 25(5): 917-924. FSANZ. 2004. Cyanogenic glycosides in cassava and bamboo
shoots: A human health risk assessment. Australia and New Zealand: Food Standards Australia New Zealand Technical report series No. 28.
Garbutt, J. 1977. Essentials of food microbiology. London: Arnold.Henderson, S. M., and S. Pabis. 1961. Grain drying theory I. Temperature effect on drying coefficient. Journal of Agricultural Engineering Research, 6(3): 169-174.
Iglesias, H. A., and J. Chirife. 1976. Prediction of effect of temperature on water sorption isotherms of food materials. Journal of Food Science and Technology, 11(2): 109-116.
Kumar, P. S., M. Kanwat, and V. K. Choudhary. 2013. Mathematical modeling and thin-layer drying kinetics of bamboo slices on convective tray drying at
varying temperature. Journal of Food Processing and Preservation, 37(5): 914-923.
Lewis, W. K. 1921. The rate of drying solid materials. Journal of Industrial and Engineering Chemistry, 13(5): 427-432.
Li, Q., H. Qui, and Y. Yang. 2002. The developing situation and counter ensure of freeze drying food in China. Journal of Guangxi University (Natural Science Edition), 27: 21-24.
Madamba, P. S. 2003. Physical changes in bamboo (Bambusa phyllostachys) shoot during hot air drying: shrinkage, density, and porosity. Drying Technology, 21(3): 555-568.
Martínez, R., P. Torres, M. A. Meneses, J. G. Figueroa, J. A. Pérez-Álvares, and M. Viuda-Martos. 2012. Chemical, technological and in vitro antioxidant properties of mango, guava, pineapple and passion fruit dietary fibre concentrate. Food Chemistry, 135(3): 1520-1526. Meyer, L. H. 1973. Food chemistry. New Delhi, India:
Affiliated East-West Press PVT. Ltd. Oswin, C. R. 1946. The kinetics of package life III. Isotherm. Journal of Chemical Industry, 65(12): 419-421.
Overhults, D. G., G. M. White, H. E. Hamilton, and I. J. Ross. 1973. Drying soybeans with heated air. Transaction of the American Society of Agricultural Engineering, 16(1): 112-113.
Phoungchandang, S. 1986. Development of small scale processing system for green peas. (MSc Thesis). Bangkok, Thailand: Asian Institute of Technology. Pfost, H. B., S. G. Maurer, D. S. Chung, and G. A. Miliken. 1976.
Summarizing and reporting equilibrium moisture data for grains. Transaction of the American Society of Agricultural Engineering, Paper number 76-3520. Phoungchandang, S., and P. Kongpim. 2012. Modeling using a
new thin layer drying model and drying characteristics of sweet basil (Ocimun baslicum Linn.) using tray and heat pump-assisted dehumidified drying. Journal of Food Process Engineering, 35(6): 851-862.
Phoungchandang, S., and S. Saentaweesuk. 2011. Effect of two stage, tray and heat pump-assisted dehumidified drying on drying characteristics and qualities of ginger. Food and Bioproducts Processing, 89(4): 429-437.
Phoungchandang, S., and J. L. Woods. 2000. Moisture diffusion and desorption isotherms for bananas. Journal of Food Science, 64(4): 651-657.
Potisate, Y., S. Phoungchandang, and W. L. Kerr. 2014. The Effect of predrying treatments and different drying methods on phytochemical compound retention and drying characteristics of Moringa leaves (Moringa oleifera Lam.). Drying Technology, 32(16): 1970-1985.
Satya, S., L. M. Bal, P. Singhal, and S. N. Naik. 2010. Bamboo shoot processing: food quality and safety aspect (a review). Trends in Food Science and Technology, 21(4): 181-189.
Sun, D. W., and J. L. Woods. 1994. The selection of sorption isotherm equations for wheat based on the fitting of available data I. Journal of Stored Product Research, 30(1): 27-43.
Thompson, T. L., R. M. Peart, and G. H. Foster. 1968. Mathematical simulation of corn drying: A new model. Transaction of the American Society of Agricultural Engineering, 11(4): 582-586.
Trirattanapikul, W., and S. Phoungchandang. 2014. Microwave blanching and drying characteristics of Centella asiatica (L.) urban leaves using tray and heat assisted dehumidified drying. Journal of Food Science and Technology,51(12): 3623-3634.
Turkmen, N., F. Sari, and Y. S. Velioglu. 2005. The effect of cooking methods on total phenolics and antioxidant activity of selected green vegetables. Food Chemistry, 93(4): 713-718.
Vina, S. Z., D. F. Olivera, C. M. Marani, R. M. Ferreyra, A. Mugridge, A. R. Chaves, and R. H. Mascheroni. 2007. Quality of Brussels sprouts (Brassica oleracea L. gemmifera DC.) as affected by blanching method. Journal of Food Engineering, 80(1): 218-225.
Wongsakpairod, T. 2000. Bamboo shoot drying using superheated steam. M. Eng. Thesis, Thonburi, Bangkok: King Mongkut’s University of Technology. Xu, Y., M. Zhang, D. Tu, J. San, L. Zhou, and A. S. Mujumdar.
2005. A two-stage convective air and vacuum freeze-drying technique for bamboo shoots.
International Journal of Food Science and Technology, 40(6): 589-595.
Zheng, J., F. S. Zhang, J. Q. Kan, P. Gong, and J. F. Zhong. 2014. Analysis of hot-air thin layer drying characteristics and kinetics model of bamboo shoots. Modern Food Science and Technology, 30(2): 112-116.
Zheng, J., F. S. Zhang, J. Song, M. Lin, and J. Kan. 2014. Effect of blanching and drying treatments on quality of bamboo shoot slices. International Journal of Food Science and Technology, 42(2): 531-540.
Zogzas, N.P., Z. B. Marouliz, and D. Marinos-Kouris. 1996. Moisture diffusivity data compilation in foodstuff. Drying Technology, 14(10): 2225-2253.
Nomenclatures
A, B, C, a, b empirical constant (dimensionless) C1, C2, C3 empirical constant
Deff effective moisture diffusivity, m
2
/s Ea activation energy, W/g
K drying constant, min-1
K0 pre-exponential factor, min
-1
L half thickness of bamboo shoot slice, m
MR moisture ratio
e e
X
X
X
X
0
or
0
X
X
(dimensionless)
N drying exponent (dimensionless) P microwave power, W
R2 coefficient of determination (dimensionless) RH relative humidity, decimal
RHe equilibrium relative humidity, decimal
T temperature, °C t time, min
X moisture content, %d.b. X0 initial moisture content, %d.b.
Xe equilibrium moisture content, %d.b.
Xexp, i experimental moisture content, the ith, %d.b.