R E S E A R C H A R T I C L E
Open Access
Impact of the estimation equation for GFR
on population-based prevalence estimates
of kidney dysfunction
Pietro Trocchi
1*, Matthias Girndt
2, Christa Scheidt-Nave
3, Silke Markau
2and Andreas Stang
1,4Abstract
Background:Estimating equations are recommended by clinical guidelines as the preferred method for assessment of glomerular filtration rate (GFR). The aim of the study was to compare population-based prevalence estimates of decreased kidney function in Germany defined by an estimated GFR (eGFR) <60 ml/min/1.73m2using different equations.
Methods:The study included 7001 participants of the German Health Interview and Examination Survey for
Adults 2008–2011 (DEGS1) for whom GFR was estimated using the Modification of Diet in Renal Disease study equation (MDRD), the revised Lund-Malmö equation (LM), the Full Age Spectrum creatinine equation (FAScre), the Chronic Kidney Disease Epidemiology Collaboration equations with creatinine and cystatin C (CKD-EPIcrecys), with creatinine (CKD-EPIcre) and with cystatin C (CKD-EPIcys). Bland-Altman plots were used to evaluate the agreement between the equations.
Results:Prevalence estimates of decreased kidney function were: 2.1% (CKD-EPIcys), 2.3% (CKD-EPIcrecys), 3.8% (CKD-EPIcre), 5.0% (MDRD), 6.0% (LM) and 6.9% (FAScre). The systematic differences between the equations were smaller by comparing either equations that include serum cystatin C or equations that include serum creatinine alone and increased considerably by increasing eGFR.
Conclusions:Prevalence estimates of decreased kidney function vary considerably according to the equation
used for estimating GFR. Equations that include serum cystatin C provide lower prevalence estimates if compared with equations based on serum creatinine alone. However, the analysis of the agreement between the equations according to eGFR provides evidence that the equations may be used interchangeably among persons with pronounced decreased kidney function. The study illustrates the implications of the choice of the estimating equation in an epidemiological setting.
Keywords:Epidemiology, Prevalence, Renal dysfunction, eGFR equation
Background
Chronic Kidney Disease (CKD) is defined by morpho-logical and functional damage to the kidney [1, 2]. Clinical assessment of kidney function is central to the routine clinical practice [3, 4] and glomerular filtration rate (GFR) is the best overall index-indicator of
excretory kidney function in health and disease [3, 5]. In the epidemiological setting, decreased kidney function may be defined by a GFR <60 ml/min/1.73m2 [1]. As directly measuring GFR is often cumbersome in routine clinical practice, researchers have developed and vali-dated several GFR estimating equations that include demographic and clinical variables as surrogates for muscle mass and unmeasured factors that affect serum creatinine level, such as age, sex and race. Some of these equations are meanwhile recommended by clinical guidelines as the preferred method for assessment of GFR in the routine clinical care [1].
* Correspondence:[email protected]
1Center of Clinical Epidemiology, c/o Institute of Medical Informatics,
Biometry and Epidemiology (IMIBE), University Hospital Essen, Hufelandstr. 55, 45147 Essen, Germany
Full list of author information is available at the end of the article
Decreased kidney function has been shown to be an independent marker for major adverse outcomes of CKD, including progression to end-stage kidney failure and premature death caused by cardiovascular disease [6–8]. Patients with decreased kidney function require considerable medical attention to prevent deterioration and the development of complications. If kidney disease progresses to end-stage kidney disease, renal replace-ment therapy is an enormously resource consuming condition. Given its high impact on patients’ quality of life and medical resources and rising prevalence esti-mates reported from many countries [9], CKD is in-creasingly recognized a major public health problem and the knowledge of its prevalence is of great importance from both a medical and the economical standpoint. Several studies evaluated performance and limitations of different estimating equations for GFR against a gold standard of kidney function testing in a clinical setting [4, 10–14]. Although it is widely known to nephrologist that the eGFR equations perform differently in relation to patient characteristics, the behavior of the equations in unselected large population-based samples has only been investigated in detail in the NHANES study to our knowledge. Therefore, a detailed assessment of the be-havior of the equations in a European, predominantly Caucasian population of 7000 participants is important for researchers who want to provide population-based prevalence estimates of kidney dysfunction. To date, lit-erature about the prevalence of kidney function in Germany is scarce. Recently, we published population-based estimates of prevalence of kidney damage in Germany based on measures of albuminuria and the use of an established equation for GFR estimation [15]. Fur-thermore, the Study of Health in Pomerania (SHIP-1) and the Cooperative Health Research in the Region of Augsburg (KORA F4) reported results about prevalence of decreased kidney function in Northeast and Southern Germany respectively [16]. Finally, the Berlin Initiative Study assessed kidney function in Berlin in a cross sec-tional analysis of people aged 70 years and older [17]. The present study compares different population-based prevalence estimates of decreased kidney function among adults in Germany using six different GFR esti-mating equations.
Methods
Study population and design
The German Health Interview and Examination Survey for Adults (“Studie zur Gesundheit Erwachsener in Deutschland”, DEGS) is part of the health monitoring system at the Robert Koch-Institute (RKI). The concept and design of DEGS are described in detail elsewhere [18–20]. The first wave (DEGS1) was conducted from 2008 to 2011 and included interviews, examinations and
tests. The DEGS1 study has a mixed design, which en-ables both cross-sectional and longitudinal analyses. For this purpose, a random sample from local population registries was drawn to supplement former participants from the German National Health Interview and Exam-ination Survey 1998 (GNHIES98). To evaluate kidney function, blood samples were taken from all participants and serum creatinine concentration (Architect, Abbott Diagnostics, Wiesbaden; IDMS traceable creatinine Assay, kinetic Jaffe’s method) and serum cystatin C concentration (N Latex Cystatin C assay, Prospec, Siemens Healthcare, Eschborn) were measured. Participants with diabetes mel-litus were identified according to self-reported medical history and verified current use of anti-diabetic drugs [21]. Participants with gestational diabetes were not included among those with diabetes mellitus. Arterial hypertension was assumed if the participant reported current treatment with antihypertensive medications or elevated blood pres-sure (≥140 mmHg systolic or ≥90 mmHg diastolic) was measured in the survey [22].
The analyses presented here refer to the sample of 7001 participants of the DEGS1 aged 18–79 years for whom estimated GFR (eGFR) was calculated using six GFR estimating equations (creatinine was measured in mg/dl, cystatin C in mg/l): the isotope dilution mass spectrometry traceable Modification of Diet in Renal Disease study equation (MDRD) [23], the revised Lund-Malmö equation (LM) [12], the Full Age Spectrum cre-atinine equation (FAScre) [24], the Chronic Kidney Dis-ease Epidemiology Collaboration creatinine equation (CKD-EPIcre), the Chronic Kidney Disease Epidemi-ology Collaboration cystatin C equation (CKD-EPIcys) and the Chronic Kidney Disease Epidemiology Collabor-ation creatinine and cystatin C equCollabor-ation (CKD-EPI-crecys) [4]. Equations are detailed in Fig. 1. Persons with missing data on eGFR were excluded (N= 114).
Statistical analysis
Participants were classified into four GFR categories based on the estimated GFR values (expressed in ml/ min/1.73m2) as follows: G1 (≥90), G2 (60 < 90), G3a (45 < 60) and G3b-G5 (<45). We estimated the prevalence and corresponding 95% confidence intervals (95% CI) of a decreased kidney function, as defined by an eGFR <60 ml/min/1.73m2, and the prevalence of each GFR category. Furthermore, we calculated the population based estimate of the number of persons with decreased kidney function in Germany using the population census figures of the Federal Republic of Germany in 2011. Population data were provided by the Federal Bureau of Statistic.
display for each person the difference between two mea-surements against their mean. To compare the equations with each other, the absolute mean difference (md) be-tween eGFR was used as a measure of the magnitude of the systematic difference (bias) between the equations. In addition, as a measure of relative change of eGFR, we calculated the mean percent difference between the measurements. The limits of the agreement between the equations were defined as md ±1.96 standard deviation of the differences (SD) and were used as a measure of the variability of the bias. These values represented the range within which 95% of the differences were included (95% CI agreement). Furthermore, for each of the ten pairwise comparisons, the analysis of the md was strati-fied by the GFR category based on the mean value of eGFR (G1:≥90, G2: 60 < 90, G3a: 45 < 60, G3b-G5: <45).
Prevalence estimates were weighted by a factor that corrects sample deviations from population structure (as of 31 Dec. 2010) with regard to age, sex, region and nationality, type of community and education. When calculating the weighting factor for previous participants of GNHIES98, the probability of repeated participation, based on a multivariable logistic model, was taken into account. A non-response analysis and a comparison of selected indicators with data from official statistics indi-cate a high level of sample representativeness for the resident population of Germany aged 18–79 years [18]. In addition, the observed number of subjects end stage
renal disease in our sample (n= 1) was similar to the ex-pected number of subjects with end stage renal disease (n= 7) as derived from a recent report [26]. To take into account both the weighting and the correlation of the participants within a community, confidence intervals were determined using the survey procedures in SAS® (SAS Inc., Cary, NC, USA), Version 9.4.
Results
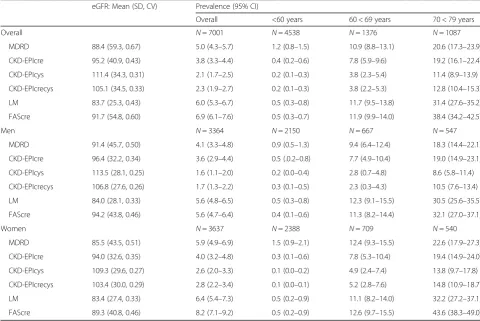
higher for women than for men and increased with age in both sexes: among participants aged <60 years the prevalence varied from 0.2% to 1.2% and increased among participants aged 70 < 80 years up to 11.4% using CKD-EPIcys and up to 38.4% using FAScre. The mean eGFR varied from 83.7 using LM to 111.4 using CKD-EPIcys.
Based on the age specific prevalence estimates and the German population in 2011, the estimated number of
persons aged 18–79 years with decreased kidney func-tion in Germany varied from 1.41 m using the CKD-EPIcys equation to 4.58 m using the FAScre equation. Assuming that the prevalence of persons aged ≥80 with decreased kidney function equals that of the study par-ticipants aged 75 < 80 years, the total number of persons with decreased kidney function ranged from 2.15 m using the CKD-EPIcys equation to 6.78 m using the FAScre equation (Table 3).
Table 1Characteristics of 7001 adults aged 18–79 in Germany 2008–2011 (DEGS1)
Characteristic Overall Men Women
Sex: N, % 7001 100 3364 49.9 3637 50.1
Age (Years): median (P10, P90) 46.9 (23.6, 70.4) 46.4 (23.3, 69.8) 47.5 (23.9, 70.9)
BMI (Kg/m2): median (P10, P90) 26.2 (21.0, 33.4) 26.7 (22.1, 32.9) 25.4 (20.4, 33.8)
Serum creatinine (mg/dl): median (P10, P90) 0.82 (0.67, 1.06) 0.92 (0.76, 1.13) 0.75 (0.63, 0.90)
Serum cystatin C (mg/l): median (P10, P90) 0.70 (0.57, 0.90) 0.73 (0.61, 0.90) 0.67 (0.55, 0.89)
Medical history
Hypertension: N, % 2585 31.5 1349 33.4 1236 29.7
Diabetes mellitus: N, % 539 6.6 305 7.0 234 6.2
P1010th percentile,P9090th percentile,BMIbody mass index
Table 2eGFR and estimated prevalence of decreased kidney function (eGFR <60 ml/min/1.73m2) among 7001 adults aged 18–79 in
Germany 2008–2011 (DEGS1) according to the equation used
eGFR: Mean (SD, CV) Prevalence (95% CI)
Overall <60 years 60 < 69 years 70 < 79 years
Overall N= 7001 N= 4538 N= 1376 N= 1087
MDRD 88.4 (59.3, 0.67) 5.0 (4.3–5.7) 1.2 (0.8–1.5) 10.9 (8.8–13.1) 20.6 (17.3–23.9)
CKD-EPIcre 95.2 (40.9, 0.43) 3.8 (3.3–4.4) 0.4 (0.2–0.6) 7.8 (5.9–9.6) 19.2 (16.1–22.4)
CKD-EPIcys 111.4 (34.3, 0.31) 2.1 (1.7–2.5) 0.2 (0.1–0.3) 3.8 (2.3–5.4) 11.4 (8.9–13.9)
CKD-EPIcrecys 105.1 (34.5, 0.33) 2.3 (1.9–2.7) 0.2 (0.1–0.3) 3.8 (2.2–5.3) 12.8 (10.4–15.3)
LM 83.7 (25.3, 0.43) 6.0 (5.3–6.7) 0.5 (0.3–0.8) 11.7 (9.5–13.8) 31.4 (27.6–35.2)
FAScre 91.7 (54.8, 0.60) 6.9 (6.1–7.6) 0.5 (0.3–0.7) 11.9 (9.9–14.0) 38.4 (34.2–42.5)
Men N= 3364 N= 2150 N= 667 N= 547
MDRD 91.4 (45.7, 0.50) 4.1 (3.3–4.8) 0.9 (0.5–1.3) 9.4 (6.4–12.4) 18.3 (14.4–22.1)
CKD-EPIcre 96.4 (32.2, 0.34) 3.6 (2.9–4.4) 0.5 (.0.2–0.8) 7.7 (4.9–10.4) 19.0 (14.9–23.1)
CKD-EPIcys 113.5 (28.1, 0.25) 1.6 (1.1–2.0) 0.2 (0.0–0.4) 2.8 (0.7–4.8) 8.6 (5.8–11.4)
CKD-EPIcrecys 106.8 (27.6, 0.26) 1.7 (1.3–2.2) 0.3 (0.1–0.5) 2.3 (0.3–4.3) 10.5 (7.6–13.4)
LM 84.0 (28.1, 0.33) 5.6 (4.8–6.5) 0.5 (0.3–0.8) 12.3 (9.1–15.5) 30.5 (25.6–35.5)
FAScre 94.2 (43.8, 0.46) 5.6 (4.7–6.4) 0.4 (0.1–0.6) 11.3 (8.2–14.4) 32.1 (27.0–37.1)
Women N= 3637 N= 2388 N= 709 N= 540
MDRD 85.5 (43.5, 0.51) 5.9 (4.9–6.9) 1.5 (0.9–2.1) 12.4 (9.3–15.5) 22.6 (17.9–27.3)
CKD-EPIcre 94.0 (32.6, 0.35) 4.0 (3.2–4.8) 0.3 (0.1–0.6) 7.8 (5.3–10.4) 19.4 (14.9–24.0)
CKD-EPIcys 109.3 (29.6, 0.27) 2.6 (2.0–3.3) 0.1 (0.0–0.2) 4.9 (2.4–7.4) 13.8 (9.7–17.8)
CKD-EPIcrecys 103.4 (30.0, 0.29) 2.8 (2.2–3.4) 0.1 (0.0–0.1) 5.2 (2.8–7.6) 14.8 (10.9–18.7)
LM 83.4 (27.4, 0.33) 6.4 (5.4–7.3) 0.5 (0.2–0.9) 11.1 (8.2–14.0) 32.2 (27.2–37.1)
FAScre 89.3 (40.8, 0.46) 8.2 (7.1–9.2) 0.5 (0.2–0.9) 12.6 (9.7–15.5) 43.6 (38.3–49.0)
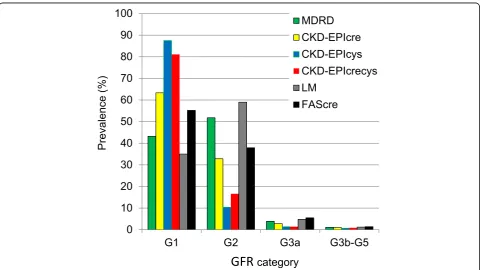
Figure 2 presents the prevalence estimates of the GFR categories according to the equation used. Using any CKD-EPI equations, the large majority of the partici-pants were classified as G1. In particular, according to CKD-EPIcys, almost 9 out of 10 participants were classi-fied in this category. Using MDRD or LM the highest prevalence was estimated for the participants with eGFR 60 < 90 ml/min/1.73m2(category: G2). The prevalence of participants with eGFR <45 ml/min/1.73m2 (category G3b-G5) varied from 0.7% using CKD-EPIcys to 1.4% using FAScre.
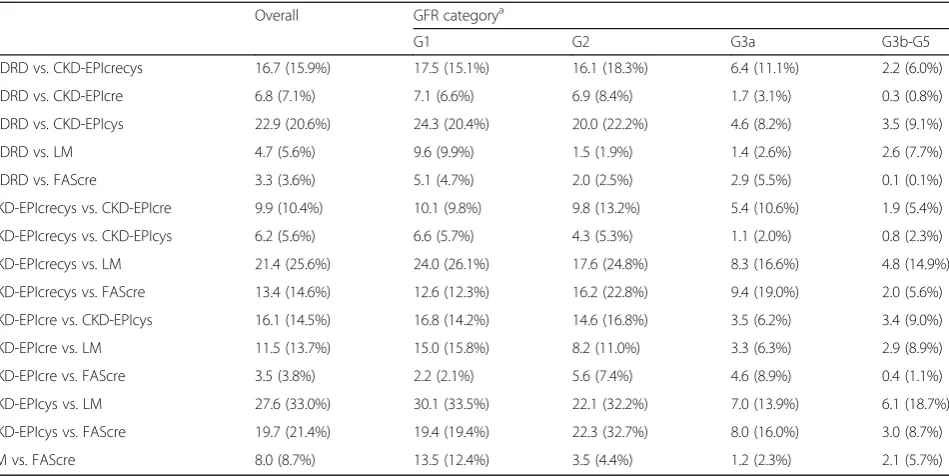
Table 4 shows that great absolute differences between eGFR were calculated comparing CKD-EPIcys with LM (md = 27.6), CKD-EPIcys with MDRD (md = 22.9) and CKD-EPIcrecys with LM (md = 21.4). In contrast, small differences were calculated comparing FAScre with MDRD (md = 3.3) and CKD-EPIcre (md = 3.5), MDRD with LM (md = 4.7), CKD-EPIcys with CKD-EPIcrecys (md = 6.2) and CKD-EPIcre with MDRD (md = 6.8). Overall, the absolute md between eGFR were very small for small values of eGFR and increased considerably with increasing eGFR values. In particular, among
Table 3Estimated numbers (millions) of adults with decreased kidney function (eGFR <60 ml/min/1.73m2) in Germany 2011 according to the equation used
Age (years) MDRD CKD-EPIcre CKD-EPIcys CKD-EPIcrecys LM FAScre
<50 0.179 0.039 0.036 0.022 0.041 0.016
50 < 60 0.373 0.162 0.037 0.058 0.214 0.199
60 < 70 0.944 0.665 0.324 0.320 0.999 1.018
70 < 80 1.772 1.672 1.015 1.119 2.773 3.349
≥80a 1.067 1.070 0.742 0.737 1.930 2.202
Overall 4.335 3.608 2.154 2.256 5.958 6.784
MDRDModification of Diet in Renal Disease study equation,CKD-EPIcreChronic Kidney Disease Epidemiology Collaboration creatinine equation,CKD-EPIcys Chronic Kidney Disease Epidemiology Collaboration cystatin C equation,CKD-EPIcrecysChronic Kidney Disease Epidemiology Collaboration creatinine and cystatin C equation,LMLund-Malmö equation,FAScre: Full Age Spectrum creatinine equation
a
By use of the estimated prevalence of study participants aged 70 < 80 years
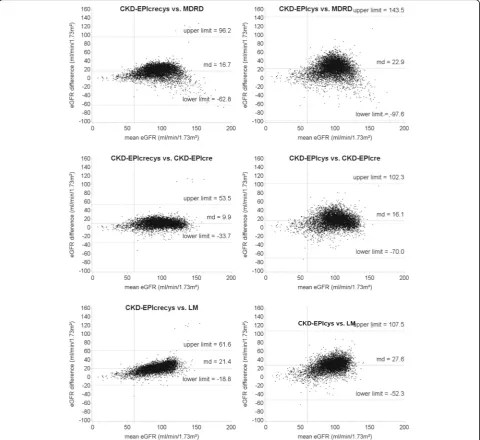
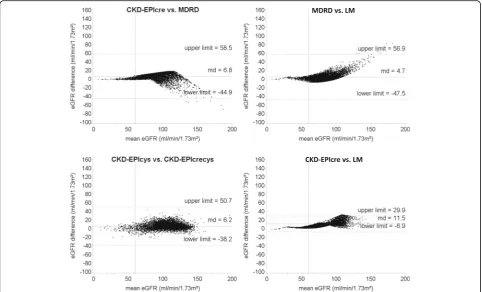
participants with mean eGFR <45 ml/min/1.73m2 (G3b-G5), the md ranged from 0.1 (MDRD vs. FAScre) to 6.1 ml/min/1.73m2 (CKD-EPIcys vs. LM), while among participants with mean eGFR >90 ml/min/1.73m2 (G1) the md ranged from 2.2 (CKD-EPIcre vs. FAScre) to 30.1 ml/min/1.73m2 (CKD-EPIcys vs. LM). Very good levels of agreement between the equations for small values of eGFR were shown also from the Bland-Altman plots that depict the agreement over the whole range of eGFR values (Figs. 3 and 4, and Additional file 1: Figure S1). The greatest variability of the differences between eGFR, estimated as the range between the limits of the agreement, was observed comparing CKD-EPIcys with MDRD (95% CI: -97.6, 143.5).
Discussion
This study shows that prevalence estimates of decreased kidney function (eGFR <60 ml/min/1.73m2) among adults varies considerably depending on the equation used for estimating GFR. Prevalence estimates among of persons aged 18–79 in Germany 2008–2011 (DEGS1) varied from 2.1% using CKD-EPIcys to 6.9% using FAS-cre and the overall number of persons with deFAS-creased kidney function ranged accordingly from 2.15 m (CKD-EPIcys) to 6.78 m (FAScre). From a public health stand-point, the choice of the equation produces a wide range
of the estimated number of persons with kidney disease in Germany.
Prevalence estimates of decreased kidney function vary substantially both within and between countries and many potential factors leading to these variations have been discussed [27–29]. Our estimated prevalence is lower than those from the SHIP-1 study and the KORA F4 study, which reported a prevalence of decreased kid-ney function in Northeast and Southern Germany of 5.9% and 3.1% respectively using CKD-EPIcrecys (vs. 2.3% in DEGS1) [16]. If compared with DEGS1, the me-dian age of participants as well as the prevalence of hypertension and diabetes mellitus in these studies was considerably higher, especially for SHIP-1. Therefore, the observed differences are mostly due to differences in age and in prevalence of risk factors among the study popu-lations. Prevalence estimates in our study were also lower than those from the US population based on the National Health and Nutrition Examination Survey (NHANES), which reported a prevalence estimate of 8% using MDRD [2]. Some reasons for these differences have been discussed in our previous publication, includ-ing heterogeneity in age distribution and ethnic charac-teristics of the study populations [15].
As the GFR estimating equations include the same demographic variables, such as age and sex, the
Table 4Absolute mean differences between GFR estimated by the different equations used among 7001 adults aged 18–79 in
Germany 2008–2011 (DEGS1) according to GFR category
Overall GFR categorya
G1 G2 G3a G3b-G5
MDRD vs. CKD-EPIcrecys 16.7 (15.9%) 17.5 (15.1%) 16.1 (18.3%) 6.4 (11.1%) 2.2 (6.0%)
MDRD vs. CKD-EPIcre 6.8 (7.1%) 7.1 (6.6%) 6.9 (8.4%) 1.7 (3.1%) 0.3 (0.8%)
MDRD vs. CKD-EPIcys 22.9 (20.6%) 24.3 (20.4%) 20.0 (22.2%) 4.6 (8.2%) 3.5 (9.1%)
MDRD vs. LM 4.7 (5.6%) 9.6 (9.9%) 1.5 (1.9%) 1.4 (2.6%) 2.6 (7.7%)
MDRD vs. FAScre 3.3 (3.6%) 5.1 (4.7%) 2.0 (2.5%) 2.9 (5.5%) 0.1 (0.1%)
CKD-EPIcrecys vs. CKD-EPIcre 9.9 (10.4%) 10.1 (9.8%) 9.8 (13.2%) 5.4 (10.6%) 1.9 (5.4%)
CKD-EPIcrecys vs. CKD-EPIcys 6.2 (5.6%) 6.6 (5.7%) 4.3 (5.3%) 1.1 (2.0%) 0.8 (2.3%)
CKD-EPIcrecys vs. LM 21.4 (25.6%) 24.0 (26.1%) 17.6 (24.8%) 8.3 (16.6%) 4.8 (14.9%)
CKD-EPIcrecys vs. FAScre 13.4 (14.6%) 12.6 (12.3%) 16.2 (22.8%) 9.4 (19.0%) 2.0 (5.6%)
CKD-EPIcre vs. CKD-EPIcys 16.1 (14.5%) 16.8 (14.2%) 14.6 (16.8%) 3.5 (6.2%) 3.4 (9.0%)
CKD-EPIcre vs. LM 11.5 (13.7%) 15.0 (15.8%) 8.2 (11.0%) 3.3 (6.3%) 2.9 (8.9%)
CKD-EPIcre vs. FAScre 3.5 (3.8%) 2.2 (2.1%) 5.6 (7.4%) 4.6 (8.9%) 0.4 (1.1%)
CKD-EPIcys vs. LM 27.6 (33.0%) 30.1 (33.5%) 22.1 (32.2%) 7.0 (13.9%) 6.1 (18.7%)
CKD-EPIcys vs. FAScre 19.7 (21.4%) 19.4 (19.4%) 22.3 (32.7%) 8.0 (16.0%) 3.0 (8.7%)
LM vs. FAScre 8.0 (8.7%) 13.5 (12.4%) 3.5 (4.4%) 1.2 (2.3%) 2.1 (5.7%)
Relative changes (%) of the estimated GFR were calculated as ([first value]–[second value]) / [second value])
MDRDModification of Diet in Renal Disease study equation,CKD-EPIcreChronic Kidney Disease Epidemiology Collaboration creatinine equation,CKD-EPIcys Chronic Kidney Disease Epidemiology Collaboration cystatin C equation,CKD-EPIcrecysChronic Kidney Disease Epidemiology Collaboration creatinine and cystatin C equation,LMLund-Malmö equation,FAScreFull Age Spectrum creatinine equation
a
observed differences between prevalence estimates could be mainly due to the fact that some equations use serum cystatin C (CKD-EPIcys, CKD-EPIcrecys), while other equations use serum creatinine alone as biomarker (MDRD, CKD-EPIcre, LM and FAScre). In particular, the prevalence of participants with decreased kidney function estimated by those equations that include serum cystatin C was considerably lower than the preva-lence estimated by those equations based on serum cre-atinine alone. The lowest prevalence was estimated
prevalence estimates if compared with equations that in-cluded cystatin C [31]. Interestingly, in agreement with DEGS1, NHANES reported higher mean values of eGFR for equations with cystatin C if compared with mean eGFR calculated by equations with creatinine alone. Our data point out that the seemingly low level of imprecision of the creatinine based calculations may translate into quite relevant differences when using the equations for epidemiological questions and sup-port the suggestion to use the GFR values estimated by equations with cystatin C as confirmatory test for people with decreased kidney function as estimated by equations with creatinine only [4].
Given the large difference between the prevalence estimates yielded by the different GFR estimating equations, the choice for the equation for assessing GFR can have a great impact on the assessment of public health implications, e. g. projections of disease burden or medical resources in relation to CKD. Individually, misclassification of patients as having chronic kidney disease can result in unnecessary diag-nostic and therapeutic interventions with consequent
on creatinine alone (MDRD, CKD-EPIcre, LM and FAScre). However, the analysis of the agreement be-tween the equations stratified by the mean values of eGFR shows that the absolute and relative change (percent change) of eGFR was larger among GFR cat-egories G1 and G2 than G3b-G5. In particular, the systematic differences between eGFR among partici-pants classified in the category G3b-G5 can be easily considered clinically not relevant. The Bland-Altman plots showed a similar distribution pattern, with good agreement between the estimating equations for low values of eGFR and increasing systematic differences with increasing eGFR. These results are consistent with those observed in other studies [33, 34] and suggest that the different estimating equations may be used interchangeably among persons with moderately to severely decreased kidney function (eGFR: <45 ml/ min/1.73m2). Furthermore, high variability of the differences, estimated by the limits of the agreement between the equations, was observed by comparing CKD-EPIcys with equations based on creatinine alone. This study has some limitations: First, as we did not measure the GFR by a gold standard, we could not determine which equation provides the most valid prevalence estimates of decreased kidney function for the German population. Second, information on place of residence of the study participants was not available and we could not therefore evaluate regional variability in prevalence estimates. Third, as the first wave of the DEGS study was conducted from 2008 to 2011, serum cystatin C concentration was measured using a not stan-dardized assay which complicates the comparison with studies that used a standardized assay for cystatin C. A further limitation of our and other cross-sectional stud-ies is the lack of a second GFR estimation after 3 months which most likely results in a false positive prevalence of kidney dysfunction.
Conclusions
Our study illustrates the importance of the choice of the GFR estimating equation from an epidemiological point of view. Prevalence estimates of decreased kidney function in Germany are highly related to the equation used. In particular, the equations that include serum cystatin C provide lower prevalence estimates if compared with those based on serum creatinine alone. However, the analysis of the systematic differences between the eGFR suggests that the equations could be used interchangeably among persons with pronounced decreased kidney function. Additional longitudinal epidemiological studies are needed to investigate which of the available equations are most useful for prediction of CKD and associated complications at the population level.
Additional file
Additional file 1: Figure S1.Bland-Altman plots for comparison between Full Age Spectrum creatinine equation (FAScre) and the other equations used to estimate GFR among 7001 adults aged 18–79 in Germany 2008–2011 (DEGS1). MDRD: Modification of Diet in Renal Disease study equation; CKD-EPIcre: Chronic Kidney Disease Epidemiology Collaboration creatinine equation; CKD-EPIcys: Chronic Kidney Disease Epidemiology Collaboration cystatin C equation; CKD-EPIcrecys: Chronic Kidney Disease Epidemiology Collaboration creatinine and cystatin C equation; LM: Lund-Malmö equation; FAScre: Full Age Spectrum creatinine equation. Solid, horizontal lines represent the mean difference between the eGFR. Dashed, horizontal lines represent the limit of agreement between the equations. Solid, vertical lines represent the eGFR cut-off value of a decreased kidney function (60 ml/min/1.73m2). (PDF 422 kb)
Abbreviations
CI:Confidence interval; CKD: Chronic Kidney Disease; CKD-EPIcre: Chronic Kidney Disease Epidemiology Collaboration creatinine equation; CKD-EPIcrecys: Chronic Kidney Disease Epidemiology Collaboration creatinine and cystatin C equation; CKD-EPIcys: Chronic Kidney Disease Epidemiology Collaboration cystatin C eq.; CV: Coefficient of variation; DEGS: German Health Interview and Examination Survey for Adults; DEGS1: German Health Interview and Examination Survey for Adults, first wave; eGFR: estimated glomerular filtration rate; FAScre: Full Age Spectrum creatinine equation; GFR: Glomerular filtration rate; GNHIES98: German National Health Interview and Examination Survey 1998; Hg: Mercury; IDMS: Isotope Dilution Mass Spectrometry; LM: Lund-Malmö equation; max: Maximum; md: Mean difference; MDRD: Modification of Diet in Renal Disease study equation; min: Minimum; RKI: Robert Koch-Institute; Scr: Serum creatinine; Scys: Serum cystatin C; SD: Standard deviation
Acknowledgements
The authors thank Angelika Schaffrath Rosario of the Robert Koch-Institute, Berlin, for helpful comments on the statistical analyses of the data.
Availability of data and materials
Any additional information required by the reader can be obtained from authors upon reasonable request.
Authors’contributions
PT drafted the manuscript and carried out the statistical analysis, MG and SM made substantial contributions to the analysis and interpretation of the data and revised the manuscript, CSN collected the data, provided intellectual content of critical importance and revised the manuscript, AS was responsible for the design of the study, data analysis and interpretation of the findings and revised the manuscript. All authors read and approved the final manuscript.
Ethics approval and consent to participate
All participants provided written informed consent prior to the interview and examinations. All procedures performed in DEGS1 were in accordance with the 1964 Helsinki declaration and its later amendments. The study protocol was approved by the Charité-Universitätsmedizin. Berlin ethics committee in September 2008 (No. EA2/047/08).
Consent for publication Not applicable
Competing interests
The authors declare that they have no competing interests.
Publisher’s Note
Author details
1Center of Clinical Epidemiology, c/o Institute of Medical Informatics,
Biometry and Epidemiology (IMIBE), University Hospital Essen, Hufelandstr. 55, 45147 Essen, Germany.2Department of Internal Medicine II, Medical Faculty of the Martin-Luther-University Halle-Wittenberg, Ernst-Grube-Str. 40, 06120 Halle (Saale), Germany.3Department of Epidemiology and Health
Monitoring, Robert Koch-Institute, General-Pape-Str. 62-66, 12101 Berlin, Germany.4Department of Epidemiology, School of Public Health, Boston University, 715 Albany St, Boston, MA 02118, USA.
Received: 8 June 2017 Accepted: 10 November 2017
References
1. Kidney Disease. Improving global outcomes (KDIGO) CKD work group: KDIGO 2012 clinical practice guideline for the evaluation and Management of Chronic Kidney Disease. Kidney. Int Suppl. 2013;3:1–150.
2. Coresh J, Selvin E, Stevens LA, Manzi J, Kusek JW, Eggers P, et al. Prevalence of chronic kidney disease in the United States. JAMA. 2007;298:2038–47. 3. Stevens LA, Coresh J, Greene T, Levey AS. Assessing kidney function
-measured and estimated glomerular filration rate. N Engl J Med. 2006;354: 2473–83.
4. Inker LA, Schmid CA, Tighiouart H, Eckfeldt JH, Feldman HI, Greene T, et al. Estimating glomerular filtration rate from serum creatinine and cystatin C. N Engl J Med. 2012;367:20–9.
5. Levey AS, Coresh J. Chronic kidney disease. Lancet. 2012;379:165–80. 6. Coresh J, Turin TC, Matsushita K, Sang Y, Ballew SH, Appel LJ, et al. Decline
in estimated glomerular filtration rate and subsequent risk of end-stage renal disease and mortality. JAMA. 2014;311:2518–31.
7. Go AS, Chertow GM, Fan D, McCulloch CE, Hsu CY. Chronic kidney disease and the risks of death, cardiovascular events, and hospitalization. N Engl J Med. 2004;351:1296–305.
8. Keith DS, Nichols GA, Gullion CM, Brown JB, Smith DH. Longitudinal follow-up and outcomes among a population with chronic kidney disease in a large managed care organization. Arch Intern Med. 2004;164:659–63. 9. Eckardt KU, Coresh J, Devuyst O, Johnson RJ, Köttgen A, Levey AS, et al.
Evolving importance of kidney disease: from subspecialty to global health burden. Lancet. 2013;382:158–69.
10. Earley A, Miskulin D, Lamb EJ, Levey AS, Uhlig K. Estimating equations for glomerular fitration rate in the era of creatinin standardization: a systematic review. Ann Intern Med. 2012;156:785–95.
11. Levey AS, Stevens LA, Schmid CA, Zhang YL, Castro AF, Feldman HI, et al. A new equation to estimate glomerular filtration rate. Ann Intern Med. 2009; 150:604–12.
12. Nyman U, Grubb A, Larsson A, Hansson LA, Flodin M, Nordin G, et al. The revised Lund-Malmö GFR estimating equation outperforms MDRD and CKD-EPI across GFR, age, and BMI intervals in a large Swedish population. Clin Chem Lab Med. 2014;52:815–24.
13. Stevens LA, Coresh J, Feldman HI, Greene T, Lash JP, Nelson RG, et al. Evaluation of the modification of diet in renal disease study equation in a large diverse population. J Am Soc Nephrol. 2007;18:2749–57.
14. Meeusen JW, Rule AD, Voskoboev N, Baumann NA, Lieske JC, Cystatin C. Creatinine-based eGFR equation performance depends on patient characteristics. Clin Chem. 2015;61:1265–72.
15. Girndt M, Trocchi P, Scheidt-Nave C, Markau S, Stang A. The prevalence of renal failure. Dtsch Ärztebl Int. 2016;113:85–91.
16. Aumann N, Baumeister SE, Rettig R, Werner WLA, Döring A, Peters A, et al. Regional variation of chronic kidney disease in Germany: results from two population-based surveys. Kidney Blood Press Res. 2015;40:231–43. 17. Ebert N, Jakob O, Gaedeke J, van der Giet M, Kuhlmann MK, Martus P, et al.
Prevalence of reduced kidney function and albuminuria in older adults: the berlin initiative study. Nephrol Dial Transplant. 2017;32:997–1005. 18. Kamtsiuris P, Lange M, Hoffmann R, Schaffrath Rosario A, Dahm S, Kuhnert
R, et al. First wave of the German health interview and examination survey for adults (DEGS1). Sampling design, response, sample weights and representativeness. Bundesgesundheitsbl. 2013;56:620–30. 19. Kurth BM, Lange C, Kamtsiuris P, Hölling H. Health monitoring at the
Robert-Koch-institute. Status and perspectives. Bundesgesundheitsbl Gesundheitsforsch Gesundheitsschutz. 2009;52:557–70.
20. Scheidt-Nave C, Kamtsiuris P, Gößwald A, Hölling H, Lange M, Busch MA, et al. German health interview and examination survey for adults (DEGS)
-design, objectives and implementation of the first data collection wave. BMC Public Health. 2012;12:730.
21. Heidemann C, Du Y, Schubert I, Rathmann W, Scheidt-Nave C. Prävalenz und zeitliche Entwicklung des bekannten Diabetes mellitus. Ergebnisse der Studie zur Gesundheit Erwachsener in Deutschland (DEGS1).
Bundesgesundheitsbl. 2013;56:668–77.
22. Neuhauser H, Thamm M, Eliassen MS. Blutdruck in Deutschland 2008-2011. Ergebnisse der Studie zur Gesundheit Erwachsener in Deutschland (DEGS1). Bundesgesundheitsbl. 2013;56:795–801.
23. Levey AS, Coresh J, Greene T, Marsh J, Stevens LA, Kusek JW, et al. Expressing the modification of diet in renal disease study equation for estimating glomerular filtration rate with standardized serum creatinine values. Clin Chem. 2007;53:766–72.
24. Pottel H, Hoste L, Dubourg L, Ebert N, Schaeffner E, Eriksen BO, et al. An estimated glomerular filtration rate equation for the full age spectrum. Nephrol Dial Transplant. 2016;31:798–806.
25. Bland JM, Altman DG. Statistical methods for assessing agreement between two methods of clinical measurement. Lancet. 1986;1:307–10.
26. Medical Netcare GmbH. Jahresbericht Datenanalyse Dialyse für den Gemeinsamen Bundesausschuss. In: Berichtsjahr; 2013. http://www. medical-netcare.de/qsd.php. Accessed 6 Nov 2014.
27. Glassock RJ, Warnock DG, Delanaye P. The global burden of chronic kidney disease: estimates, variability and pitfalls. Nat Rev Nephrol. 2017;13:104–14. 28. Brück K, Stel VS, Gambaro G, Hallan S, Völzke H, Ärnlöv J, et al. CKD
prevalence varies across the European general population. J Am Soc Nephrol. 2016;27:2135–47.
29. McCullough K, Sharma P, Ali T, Khan I, Smith WCS, MacLeod A, et al. Measuring the population burden of chronic kidney disease: a systematic literature review of the estimated prevalence of impaired kidney function. Nephrol Dial Transplant. 2012;27:1812–21.
30. Anderson AH, Yang W, Hsu C, Joffe MM, Leonard MB, Xie D, et al. Estimating GFR among participants in the chronic renal insufficiency cohort (CRIC) study. Am J Kidney Dis. 2012;60:250–61.
31. Grams ME, Juraschek SP, Selvin E, Foster MC, Inker LA, Eckfeld JH, et al. Trends in the prevalence of reduced GFR in the United States: a comparison of creatinine- and cystatin C-based estimates. Am J Kidney Dis. 2013;62:253–60. 32. Shlipak MG, Mattes MD, Peralta CA. Update on cystatin C: incorporation into
clinical practice. Am J Kidney Dis. 2013;62:595–603.
33. Delanaye P, Cavalier E, Moranne O, Lutteri L, Krzesinski JM, Bruyere O. Creatinine- or cystatin C-based equations to estimate glomerular filtration in the general population: impact on the epidemiology of chronic kidney disease. BMC Nephrol. 2013;14:57.
34. Glaser N, Deckert A, Phiri S, Rothenbacher D, Neuhann F. Comparison of various equations for estimating GFR in Malawi: how to determine renal function in resource limited setting? PLoS One. 2015; doi: 10.1371/journal. pone.0130453.
• We accept pre-submission inquiries
• Our selector tool helps you to find the most relevant journal • We provide round the clock customer support
• Convenient online submission • Thorough peer review
• Inclusion in PubMed and all major indexing services • Maximum visibility for your research
Submit your manuscript at www.biomedcentral.com/submit