R E S E A R C H A R T I C L E
Open Access
A modified regression method to test publication
bias in meta-analyses with binary outcomes
Zhi-Chao Jin
1, Cheng Wu
1, Xiao-Hua Zhou
2,3*and Jia He
1*Abstract
Background:The tendency towards publication bias is greater for observational studies than for randomized clinical trials. Several statistical methods have been developed to test the publication bias. However, almost all existing methods exhibit rather low power or have inappropriate type I error rates.
Methods:We propose a modified regression method, which used a smoothed variance to estimate the precision of a study, to test for publication bias in meta-analyses of observational studies. A comprehensive simulation study is carried out, and a real-world example is considered.
Results:The simulation results indicate that the performance of tests varies with the number of included studies, level of heterogeneity, event rates, and sample size ratio between two groups. Neither the existing tests nor the newly developed method is particularly powerful in all simulation scenarios. However, our proposed method has a more robust performance across different settings. In the presence of heterogeneity, the arcsine-Thompson test is a suitable alternative, and Peters’test can be considered as a complementary method when mild or no heterogeneity is present.
Conclusions:Several factors should be taken into consideration when employing asymmetry tests for publication bias. Based on our simulation results, we provide a concise table to show the appropriate use of regression methods to test for publication bias based on our simulation results.
Keywords:Meta-analysis, Observational studies, Publication bias, Smoothed variance, Weighted regression
Background
Meta-analyses of observational studies are as common as the meta-analyses of controlled trials [1]. Combining observational studies is useful in situations where evi-dence must be synthesized in research areas that are not conducive to randomized controlled trials [2]. However, publication bias (the selective publication of studies based on the magnitude (usually larger) and direction of their findings) presents a particular threat to the validity of meta-analyses [3]. The tendency towards publication bias is greater for observational studies than for random-ized clinical trials [4].
More generally, the tendency for smaller studies to show greater effects than larger studies has been termed
the “small-study effect” [5,6]. This effect may be due to publication bias or heterogeneity, which often arises from population differences or methodological diversity across studies. Factors that confuse the relationship be-tween study effect and study size may cause small-study effects [6]. However, to maintain consistency with the previous literature, we consider this distorted relation-ship to be a form of“publication bias”in this paper.
A convenient way of visualizing the evidence for publi-cation bias is the use of funnel plots [7]. When publipubli-cation bias is present, the funnel will be asymmetrical, with a ten-dency for effect sizes to be larger in less precise studies, suggesting a missing “chunk” of the funnel. However, decision-making based on the visualization of funnel plots is rather subjective. Several statistical methods have been developed to examine the publication bias by testing asymmetry in funnel plots. The principle of the existing methods is to test the association between the estimated effect size and the precision of individual studies using * Correspondence:[email protected];[email protected]
2
Biostatistics Unit, HSR&D Center of Excellence, Veterans Affairs Puget Sound Health Care System, Seattle, Washington 98101, USA
1
Department of Health Statistics, Second Military Medical University, No. 800 Xiangyin Road, Shanghai 200433, China
Full list of author information is available at the end of the article
© 2014 Jin et al.; licensee BioMed Central. This is an Open Access article distributed under the terms of the Creative Commons Attribution License (http://creativecommons.org/licenses/by/4.0), which permits unrestricted use, distribution, and
rank correlation or regression methods. Rothstein et al. provided a detailed discussion of these methods [8]. Two commonly used approaches are Begg’s and Egger’s tests [9,10]. However, rank correlation-based tests have been criticized for their low power, and most regressions exhibit high type I error rates [5,11-13]. These tests assume that, under the null hypothesis of no publication bias, there is no association between effect size and precision. This is plausible when the outcome is quantitative, because the assumption of normality implies that the sample mean is statistically independent of the sample variance. This does not hold for binary outcomes [11-16]. Suppose a binary outcome is summarized by the log-odds ratio (logOR). The variance estimators of logOR are statistically dependent of the estimated logOR. Even in the absence of publication bias, as in the simulation study conducted by Rucker et al., this dependence induces asymmetry in the funnel plot [15]. The principle behind recently developed methods (such as funnel plot regression [11], Harbord’s score test [14], Peters’ test [12,17], and Rucker’s arcsine transformed tests [15]) is a reduction in the intrinsic asso-ciation between the estimated effect size and its estimated asymptotic variance. One potential approach to reduce this association is to use smoothed variance estimates, which have successfully replaced asymptotic variance in simulation studies in the context of random-effects meta-regression. In Berkey’s study, the smoothed estimator of the within-study variance was used in the random effect regression model for meta-analysis to estimate less biased regression coefficients [18].
Sterneet al. recommended certain tests for funnel plot asymmetry in meta-analyses with randomized controlled trials [19]. For binary outcomes, Peters’ test, Harbord’s score test, and Rucker’s arcsine-Thompson (AS-Thompson) test were recommended based on simulated meta-analyses with randomized controlled trials. However, observational studies have different characteristics: unbalanced sample sizes in the case and control arms, and possible rare events. Hence, these recommendations are not necessarily appro-priate for meta-analyses of observational studies.
In this paper, we develop new regression methods that use a smoothed variance as the precision scale of an indi-vidual study to test the asymmetry of funnel plots. In addition, we conduct a comprehensive simulation study based on data from Human Genome Epidemiology (HuGE) to compare the performance of the existing methods with that of the proposed methods. Finally, we make some rec-ommendations based on the simulation results.
Methods
Smoothed variance
Suppose we conduct a meta-analysis of k studies with binary outcomes. The results for the ith study are sum-marized in Table 1.
Using the notation in Table 1, we obtain estimators for logOR and its asymptotic variance asθ^i¼ logðaidi=biciÞ
and v^i¼1=aiþ1=biþ1=ciþ1=di, respectively. The
es-timator of the logOR and its asymptotic variance estima-tor are intrinsically correlated [14,15]. To reduce the correlation, we use a smoothed variance to replace the original asymptotic variance or standard error, as in Egger’s regression test.
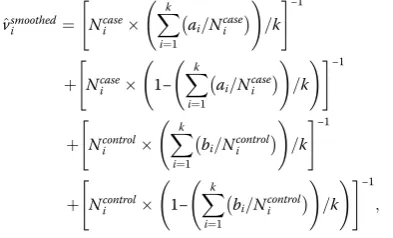
With k studies in a meta-analysis, the estimated smoothed variance for the estimated logOR in the ith study is given by
^
vsmoothed
i ¼ Ncasei
Xk
i¼1
ai=Ncase i
!
=k
" #−1
þ Ncase i 1−
Xk
i¼1
ai=Ncasei
!
=k
!
" #−1
þ Ncontrol
i
Xk
i¼1
bi=Ncontroli
!
=k
" #−1
þ Ncontrol i 1−
Xk
i¼1
bi=Ncontroli
!
=k
!
" #−1
;
and the standard error is given bysei¼ ^vsmoothedi
1=2
.
Regression models
We introduce two linear regression models based on this smoothed variance. In the first model, we use a weighted regression of θi on sei with weight 1=se2i. We term this
method the SVE test (Smoothed Variance regression model based on Egger’s test). The regression model is
θi=α+β×sei+εi weighted by wi¼1=se2i, with εi∼N
0;se2
i
.
In the second model, which was proposed by Thompson et al. [20], we introduce a between-study heterogeneity parameter τ2. We also regress θi on sei, with weight
1= se2
i þτ2
. The regression model is
θi=α+β×sei+εiweighted by wi¼1= se2i þτ2
, with εi∼N 0;se2i þτ2
.
The method of moments is used to estimate the between-study variance τ2[20,21]. We term this the SVT test (the Smoothed Variance regression model based on Thompson’s method). The maximum likelihood estimates of α and βare obtained by least-squares regression with weightwi. The null hypothesis for both methods isβ= 0,
which corresponds to no publication bias. Table 1 Notation of outcomes for a single study
Case group Control group
Exposed ai bi M
exposed i ¼aiþbi
Unexposed ci di M
unexposed i ¼ciþdi
Simulation study
To compare the performance of the existing methods with that of the proposed methods, we conducted a comprehensive simulation study. The main simulation procedure is similar to the studies of Peters and Moreno [6,12,17]. Our study considers the random effect model. We use Begg’s test [9], Egger’s test [10], Harbord’s score test [14], Peters’ test [12], Schwarzer’s count test [16], the AS-Begg test, AS-Egger test, AS-Thompson test [15], SVE test, and SVT test to examine the publication bias. To make the simulation study more realistic, we reviewed all the Human Genome Epidemiology (HuGE) meta-analyses in the American Journal of Epidemiology. We searched the journal using the keywords “Human Genome Epidemiology Review,” “HuGE review,” “ poly-morphisms,” and “systematic review or meta-analysis”. The information extracted and used in our simulation included the number of individual studies included in each meta-analysis, sample size in the case and control arms, sample size of the included studies, OR values, and heterogeneity. Two investigators performed the lit-erature search and data extraction procedures independ-ently. We now describe the parameters used in the simulation study.
a. The number of individual studies included in the meta-analyses were 5, 10, 20, 30, and 60.
b. According to the OR values reported in HuGE articles, we set the underlying OR to 1.0, 1.2, 1.4, 1.6, 1.8, and 2.0.
c. The average event rates were sampled from the uniform distributions (0.3, 0.7) and (0.1, 0.3), corresponding to the common event rate and rare event rate, respectively, as in previous studies [6,12,13,16,17].
d. Following the simulation reported by Peterset al. [12], the between-study varianceτ2was set to 300%, 100%, 33%, and 1% of the average within-study variance of the fixed effect models. These percentages correspond toI2of 75%, 50%, 25%, and 1%, respectively, where theI2statistic represents the percentage of the observed between-study variability resulting from heterogeneity rather than chance. As suggested by Higgins [22], we also assigned high, moderate, low, and no heterogeneity to theI2values of 75%, 50%, 25%, and 1%, respectively.
e. The sample size of the individual studies was generated from the log-normal distribution with a mean of 6.049 and a standard deviation of 0.848, as estimated from the reviewed meta-analyses. The sample size ratios for the combined case and control groups were set to 1:1, 1:2, 1:3, and 1:4. To mimic a real situation, we took the sample ratio for an individual study randomly from a triangle distribution [23], rather than from a uniform
distribution. Using the total sample size and group ratio, we generated sample sizesN1andN2for the case and control groups, respectively.
f. Using the parameters generated in stepsatoe, we generated data for theith study as follows [6,24]:
aieBinomial p1i;Ni1
;
bieBinomial p2i;Ni2
;
logit p1
i ¼μi−δi=2;
logit p2
i ¼μiþδi=2; and δieNðθ;τ2Þ:
Here,p1
i andp2i are the event probabilities in the case and
control groups, respectively.μiis the average event rate on
thelogitscale, andθ is the logarithmic form of the under-lying OR. The other notation is the same as in Table 1.
g. No publication bias was induced in this step: all the studies would be published regardless of the
significance of their results. Stepfwas repeated until the desired number of studies (5, 10, 20, 30, or 60) was obtained. All studies were included in the meta-analysis, which we defined as the meta-analysis without publication bias. Ten methods were used to test for publication bias, and the process was repeated 1,000 times. The empirical type I error rates of the tests can be estimated from these simulated data under the null hypothesis that there is no publication bias.
The power of asymmetry tests largely depends on the number of studies included in a meta-analysis, which is generally small. This limits the power of the test. There-fore, following previous studies [5,10,15], we usedp≤0.10 as evidence for publication bias. The R programming lan-guage was used to conduct the simulations [25].
Results
Simulation results
In total, 2,880 combinations were simulated (five different numbers of included studies × six different OR values × two average event rates × four levels of heterogeneity × four sample size ratios between the case and control groups × three different levels of publication bias: no bias, mild bias and severe bias). Because of space limitations, we present only the results under the common event rate and the balanced sample size ratio.
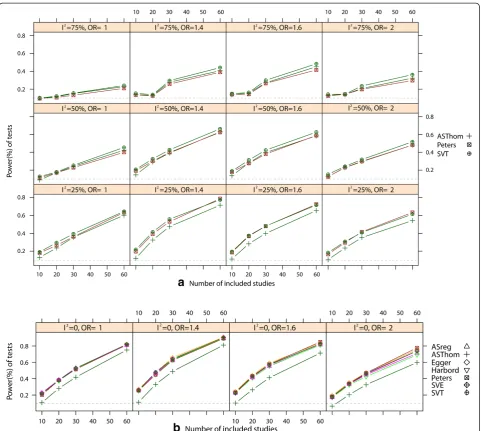
The empirical type I error rates are shown in Figure 1. Only three regression tests (Peters’ test, AS-Thompson test, and our SVT test) had appropriate type I error rates, regardless of the degree of heterogeneity and the number of included studies. In general, the rank correlation tests were more conservative than the regression tests in all scenarios. We observed that the type I error rates of the three rank correlation tests and the other four regression tests diverged from the nominal level as the heterogeneity or number of included studies increased. However, when I2was close to zero, all of the regression tests had appro-priate type I error rates, except for the AS-Thompson test. We compared the power of the three tests that had appropriate type I error rates in the presence of hetero-geneity. From the results shown in Figure 2, we can con-clude that our newly developed SVT test is the preferred method. This test exhibits a higher power than Peters’ test and the AS-Thompson test in almost all scenarios. The AS-Thompson test is a suitable alternative when moderate or severe heterogeneity is present. However, the AS-Thompson test is rather conservative when no heterogeneity or mild heterogeneity is present. Peters’ test can be considered a complementary method in such cases. However, several other regression methods can also be used to detect asymmetry in the absence of het-erogeneity. The number of individual studies included was another important factor in determining the power of a test. The power of Peters’ test, the AS-Thompson test and the SVT test increased with the number of in-cluded studies. All test powers were very low when fewer than 10 studies were included (data not shown). When the event rate and sample size ratio of two groups were considered, Harbord’s test was preferable to the others under the combination of a rare event and larger size ra-tio between two arms in the absence of heterogeneity. However, the power of our SVT test was only slightly lower than that of Harbord’s test for this combination.
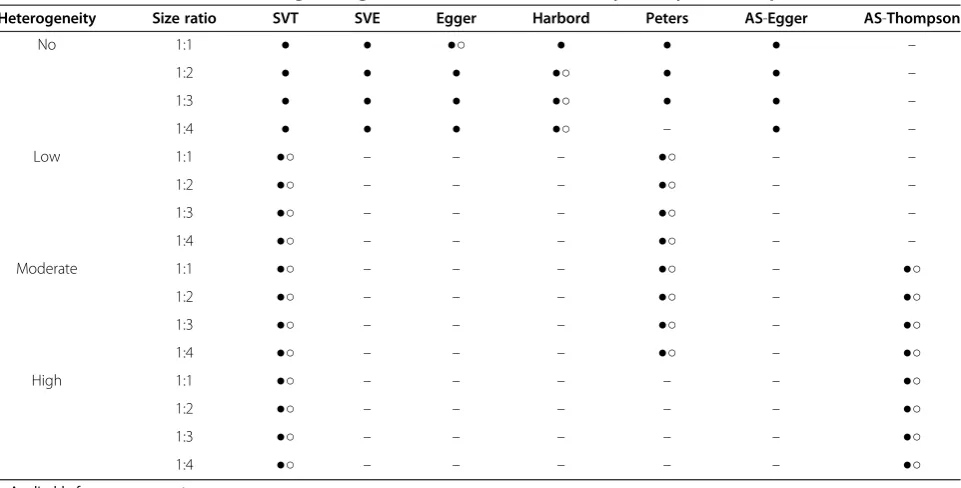
In general, rank correlation tests are more conserva-tive than regression methods. Thus, we do not recom-mend using rank correlation-based models to test for publication bias. To make these tests more accessible to less technical readers, Table 2 describes which regression method is most appropriate to test for asymmetry in funnel plots based on the results of our simulation study. This table is very easy to read. As the number of included studies increases, the power of the tests also in-creases, but the relative ranks for the test powers do not change. Therefore, we do not list this factor in the table. This table is applicable to all meta-analyses with more than 10 individual studies. For example, if a meta-analysis with 15 studies has anI2value of around 50%, size ratio of approximately 1, and an event rate close to 0.60, we search the table for a method indicated by solid circles with a moderate level of heterogeneity and a size ratio of 1:1, i.e., the SVT test, Peters’ test and the AS-Thompson test. However, the SVT test always has a slightly higher power than Peters’test and the AS-Thompson test.
A real HuGE review example
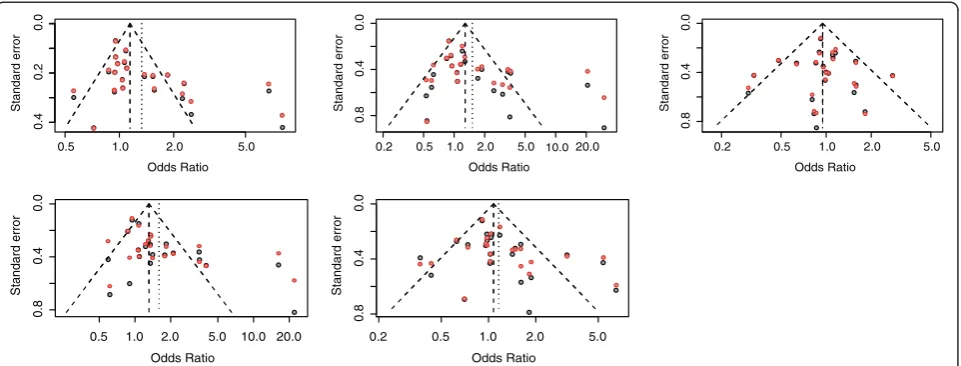
We illustrate the use of the tests by detecting the publi-cation bias in a HuGE review that examines the associ-ation between ACE-I/D polymorphism and Preeclampsia risk [26]. The meta-analysis of ACE-I/D polymorphism includes 22 studies comprising 2,596 cases and 3,828 controls. The additive model (per-D-allele) reveals a positive association between the ACE-I/D variant and preeclampsia (OR = 1.26, 95% CI, 1.07–1.49). The au-thors present the results of Egger’s and Peters’test under the per-allele model. However, these tests may not be appropriate for binary outcomes or severe heterogeneity. Additionally, the authors do not fully describe the publi-cation bias under other genetic models. Table 3 lists all the test results under five genetic models. Given the vi-sualized funnel plots (Figure 3) and resulting p-values, we can summarize the results as follows (α= 0.10).
(1) Comparing Figure 3a and b, we can see that the variance of each individual study became smoother after it was re-estimated, which means that the variance of the studies decreased. The cases of D vs I and DD vs ID+II in Figure 3b show the asymmetry of the plots.
(2) The results of the AS-Thompson test and SVT test agreed in finding publication bias in all comparison groups.
(3) In Serrano’s paper, all comparison groups exhibit asymmetry using Egger’s and Peters’ tests, except in the ID vs. II group [26]. However, the results of our study suggest that only the per-allele model and the recessive model have such asymmetry.
false positive results under the dominant model (DD+IDvs II); none of the other eight tests found asymmetry in this group. The positive results given by Egger’s test, Harbord’s test, Peters’test, the AS-Egger test, AS-Begg test, and SVE test for the DDvsII group may have been caused by the inflated type I error rate under severe heterogeneity.
We can conclude that the funnel plots and test results suggest the existence of publication bias under the per-allele model and the recessive model. We have confirmed that the preeclampsia risk associated with the ACE D-allele may largely be a result of publication bias. Note that the publication bias or reporting bias in the HuGE review arises from particular sources. Genetic association studies
usually investigate more than one Single Nucleotide Poly-morphism (SNP) simultaneously. However, the authors tend to report only SNPs with more favorable results, as well as results under favorable genetic models.
Discussion
the regression weight. Our simulation results indicate that the performance of the existing methods and modified methods varies with the number of included studies, levels of heterogeneity, event rates, and sample ratio between the two groups. Neither the existing tests nor the newly developed methods were powerful in all scenarios. How-ever, in most scenarios, our modified regression test, the SVT test, had the most appropriate type I error rate and a relatively high power compared with existing tests.
From the definition of smoothed variance, we can see that the total numbers of cases (Ncasei ) and controls
(Ncontroli ) directly influence the smoothed variance of the
ith study. The exposure rates do not affect this smoothed variance. To some extent, this definition implicitly as-sumes that the difference in variances between studies is largely a result of differences in the sample size of case and control groups. In fact, Knappet al. found that the order of precision based simply on the sample sizes is exactly the same as that based on the smoothed vari-ance estimates [27]. It is worth noting that all of the methods mentioned above have low power when the sample sizes of the included studies were similar. In this circumstance, methods based on selection models could be used [28,29].
Compared with the results of Rucker’s simulation study, we found similar conclusions for Peters’test and the AS-Thompson test [15]. Our results and those of Rucker’s suggest that the AS-Thompson test was more conservative than Peters’ test when there was no heterogeneity and more powerful than Peters’ test when heterogeneity was present. In this latter case, our SVT test became slightly more powerful than Peters’test as the number of included studies increased. However, their performance is compar-able when around 20 studies are included, which is a typ-ical number for many meta-analyses. Therefore, when there are fewer than 20 studies, both tests can be used. As
to our test’s apparent superiority over Peters’ test when heterogeneity is present and the number of included stud-ies is larger, we acknowledge that this does not have a solid statistical basis.
From the simulation results, almost all tests performed poorly in the presence of severe heterogeneity. In this case, we recommend exploring possible factors for het-erogeneity, rather than testing the asymmetry of funnel plots. The simulation study showed that when few stud-ies (e.g., five) were included in the meta-analyses, the power was very low. As described in the Cochrane Handbook for Systematic Reviews, statistical tests for Table 2 Recommendation about using the regression methods to test the asymmetry of funnel plot
Heterogeneity Size ratio SVT SVE Egger Harbord Peters AS-Egger AS-Thompson
No 1:1 ● ● ●○ ● ● ● –
1:2 ● ● ● ●○ ● ● –
1:3 ● ● ● ●○ ● ● –
1:4 ● ● ● ●○ – ● –
Low 1:1 ●○ – – – ●○ – –
1:2 ●○ – – – ●○ – –
1:3 ●○ – – – ●○ – –
1:4 ●○ – – – ●○ – –
Moderate 1:1 ●○ – – – ●○ – ●○
1:2 ●○ – – – ●○ – ●○
1:3 ●○ – – – ●○ – ●○
1:4 ●○ – – – ●○ – ●○
High 1:1 ●○ – – – – – ●○
1:2 ●○ – – – – – ●○
1:3 ●○ – – – – – ●○
1:4 ●○ – – – – – ●○
●Applicable for common event.
○Applicable for rare event. –Not applicable.
Table 3 Resultingp-values for testing the publication bias under five genetic models
Methods ACE-I/D Polymorphism
Dvs.I DDvs.II IDvs.II DDvs.ID+II DD+IDvs.II
(I2= 81.1%)* (I2= 71.8%) (I2= 31.5% ) (I2= 74.5%) (I2= 63.1%)
Begg 0.04 0.11 0.80 0.09 0.17
Schwarzer 0.05 0.19 0.80 0.15 0.27
AS-Begg 0.03 0.03 0.76 0.03 0.23
Egger 0.02 0.02 0.76 0.01 0.09
Harbord 0.02 0.07 0.97 0.02 0.19
Peters 0.004 0.01 0.74 <0.001 0.05
AS-Egger 0.02 0.06 0.97 0.01 0.16
AS-Thompson 0.03 0.13 0.95 0.01 0.18
SVE 0.02 0.06 0.98 0.01 0.15
SVT 0.09 0.21 0.99 0.04 0.24
funnel plot asymmetry should only be used when there are at least 10 studies included, because the power of the tests is too low to distinguish chance from real asymmetry when there are fewer studies [30].
Our simulation study has a number of strengths. First, the simulation parameters were mainly extracted from practical reviews, which made the simulation more real-istic. Second, we made the sample size between the two arms more realistic for observational studies. The sizes of the two arms in individual studies had a rigorous bal-ance ratio of one in previous simulation studies [12,14], but this ratio may fluctuate around one or become higher in observational studies. We used the triangle distribution rather than the uniform distribution to ran-domly generate the sample size ratio between two groups. Taking an arm size ratio of 1:2 as an example, this can be taken from a uniform distribution of (0.30, 0.36). In this situation, the total sample ratio for the case and control groups in a meta-analysis could reach 1:2, but the ratio for each individual study would range from 0.43 to 0.56, which is irrational. The triangle distribution can ensure that the ratio for an individual study comes from a rational range. Additionally, unlike Peters and Rucker, we simulated meta-analyses of rare events, which are not uncommon in HuGE reviews and meta-analyses of adverse events.
Some limitations should be mentioned. Unlike Rucker et al. [15,31,32], we did not use the Copas selection model to introduce publication bias. We found that the probability of including an individual study in the meta-analysis was very small (nearly 10%) under this model with the previous parameters [15,31]. This small prob-ability means that the Copas model introduces a very severe publication bias, which is unrealistic [33]. However,
the mechanism used to introduce publication bias in our simulation is also somewhat arbitrary. Second, we have not assessed the performance of the rank correlation-based tests when the effect size was under other distribu-tions than the normal distribution. However, in practice, the assumption of normality for the random effect size is rarely verified.
Conclusions
We have proposed a new version of the regression method with better type I error control and relatively higher power than other methods. We evaluated two newly developed regression methods and other existing methods to test for publication bias under situations that often arise in meta-analyses with observational studies, using the log-odds ratio as the measure of effect size. The purpose of our pro-posed method is not to replace other tests in all scenarios. Indeed, none of the methods were consistently good at detecting publication bias in all scenarios. Instead, the methods listed in Table 2 are complementary, and should be deployed according to the situation. However, our newly proposed method was generally more robust in most scenarios. Finally, preventing publication bias is bet-ter than applying curative methods—the main strategy of prevention is the registration system. The R functions for implementing the proposed method are available from the first author upon request.
Competing interests
The authors declare that they have no competing interests.
Authors’contributions
analysis, and drafted the manuscript. All authors have approved the submitted version.
Acknowledgements
This work was supported by Department of Veterans Affairs, Veterans Health Administration, Health Service Research and Development [Research Career Scientist Award RCS 05–196]; National Natural Science Foundation [grant number 81001287], China; the key discipline construction of evidence-based public health in Shanghai [grant number 12GWZX0602]; The Ministry of Science and Technology of China [grant number 2009ZX09312-025, 2008ZX09312-007, 2008ZX10002-018]. We thank China Scholarship Council for sponsoring the first author's visiting in University of Washington.
Author details 1
Department of Health Statistics, Second Military Medical University, No. 800 Xiangyin Road, Shanghai 200433, China.2Biostatistics Unit, HSR&D Center of Excellence, Veterans Affairs Puget Sound Health Care System, Seattle, Washington 98101, USA.3Department of Biostatistics, University of Washington, Seattle, Washington 98195, USA.
Received: 11 July 2014 Accepted: 12 December 2014 Published: 17 December 2014
References
1. Egger M, Schneider M, Davey Smith G:Spurious precision? Meta-analysis of observational studies.BMJ1998,316(7125):140–144.
2. Schenker N, Raghunathan TE:Combining information from multiple surveys to enhance estimation of measures of health.Stat Med2007,
26(8):1802–1811.
3. Stroup DF, Berlin JA, Morton SC, Olkin I, Williamson GD, Rennie D, Moher D, Becker BJ, Sipe TA, Thacker SB:Meta-analysis of observational studies in epidemiology: a proposal for reporting. Meta-analysis Of Observational Studies in Epidemiology (MOOSE) group.JAMA2000,283(15):2008–2012. 4. Easterbrook PJ, Berlin JA, Gopalan R, Matthews DR:Publication bias in
clinical research.Lancet1991,337(8746):867–872.
5. Sterne JA, Gavaghan D, Egger M:Publication and related bias in meta-analysis: power of statistical tests and prevalence in the literature.J Clin Epidemiol2000,
53(11):1119–1129.
6. Moreno SG, Sutton AJ, Ades AE, Stanley TD, Abrams KR, Peters JL, Cooper NJ:Assessment of regression-based methods to adjust for publication bias through a comprehensive simulation study.BMC Med Res Methodol 2009,9:2.
7. Sterne JA, Egger M:Funnel plots for detecting bias in meta-analysis: guidelines on choice of axis.J Clin Epidemiol2001,54(10):1046–1055. 8. Rothstein H, Sutton AJ, Borenstein M:Publication bias in meta-analysis:
Prevention,assessment and adjustments.New York: Wiley; 2005. 9. Begg CB, Mazumdar M:Operating characteristics of a rank correlation
test for publication bias.Biometrics1994,50(4):1088–1101.
10. Egger M, Davey Smith G, Schneider M, Minder C:Bias in meta-analysis detected by a simple, graphical test.BMJ1997,315(7109):629–634. 11. Macaskill P, Walter SD, Irwig L:A comparison of methods to detect
publication bias in meta-analysis.Stat Med2001,20(4):641–654. 12. Peters JL, Sutton AJ, Jones DR, Abrams KR, Rushton L:Comparison of two
methods to detect publication bias in meta-analysis.JAMA2006,295
(6):676–680.
13. Schwarzer G, Antes G, Schumacher M:Inflation of type I error rate in two statistical tests for the detection of publication bias in meta-analyses with binary outcomes.Stat Med2002,21(17):2465–2477.
14. Harbord RM, Egger M, Sterne JA:A modified test for small-study effects in meta-analyses of controlled trials with binary endpoints.Stat Med2006,
25(20):3443–3457.
15. Rucker G, Schwarzer G, Carpenter J:Arcsine test for publication bias in meta-analyses with binary outcomes.Stat Med2008,27(5):746–763. 16. Schwarzer G, Antes G, Schumacher M:A test for publication bias in
meta-analysis with sparse binary data.Stat Med2007,26(4):721–733. 17. Peters JL, Sutton AJ, Jones DR, Abrams KR, Rushton L:Performance of tests
and adjustments for publication bias in the presence of heterogeneity: Technical Report 05–01.Leicester, England: Dept of Health Sciences, University of Leicester; 2005. Available from http://www2.le.ac.uk/ departments/health-sciences/research/biostats/reports (the most recent accessed date was Dec. 28th, 2014).
18. Berkey CS, Hoaglin DC, Mosteller F, Colditz GA:A random-effects regression model for meta-analysis.Stat Med1995,14(4):395–411.
19. Sterne JA, Sutton AJ, Ioannidis JP, Terrin N, Jones DR, Lau J, Carpenter J, Rucker G, Harbord RM, Schmid CH, Tetzlaff J, Deeks JJ, Peters J, Macaskill P, Schwarzer G, Duval S, Altman DG, Moher D, Higgins JP:Recommendations for examining and interpreting funnel plot asymmetry in meta-analyses of randomised controlled trials.BMJ2011,343:d4002.
20. Thompson SG, Sharp SJ:Explaining heterogeneity in meta-analysis: a comparison of methods.Stat Med1999,18(20):2693–2708.
21. DerSimonian R, Laird N:Meta-analysis in clinical trials.Control Clin Trials 1986,7(3):177–188.
22. Higgins JP, Thompson SG, Deeks JJ, Altman DG:Measuring inconsistency in meta-analyses.BMJ2003,327(7414):557–560.
23. Samuel K, Dorp JRV:Chapter 1. The triangular distribution.InBeyond Beta: Other Continuous Families Of Distributions With Bounded Support And Applications.Singapore: World Scientific Press; 2004.
24. Smith TC, Spiegelhalter DJ, Thomas A:Bayesian approaches to random-effects meta-analysis: a comparative study.Stat Med1995,14(24):2685–2699. 25. R Development Core Team. R:A Language and Environment for Statistical
Computing.InR Foundation for Statistical Computing.Vienna, Austria: ISBN 3-900051-07-0; 2011. http://www.R-project.org/.
26. Serrano NC, Diaz LA, Paez MC, Mesa CM, Cifuentes R, Monterrosa A, Gonzalez A, Smeeth L, Hingorani AD, Casas JP:Angiotensin-converting enzyme I/D polymorphism and preeclampsia risk: evidence of small-study bias.PLoS Med2006,3(12):e520.
27. Knapp G, Hartung J:Improved tests for a random effects meta-regression with a single covariate.Stat Med2003,22(17):2693–2710.
28. Dear KBG, Begg CB:An approach for assessing publication bias prior to performing a meta-analysis.Statistical Science1992,7(2):2378–2245. 29. Jin ZC, Zhou XH, He J:Statistical methods for dealing with publication
bias in meta-analysis.Stat Med2015,34(2):343-360.
30. Higgins JPT, Green S:Cochrane Handbook for Systematic Reviews of Interventions, Version 5.1.0 [updated March 2011].The Cochrane Collaboration2011, Available from www.cochrane-handbook.org. 31. Rucker G:Small-study effects and heterogeneity in meta-analysis. Ph.D
Thesis.University of Freiburg; 2010. Available from http://www.freidok.uni-freiburg.de/volltexte/7486/pdf/ThesisWithoutCV.pdf (the most recent accessed date was Dec. 28th, 2014).
32. Copas J, Shi JQ:Meta-analysis, funnel plots and sensitivity analysis.
Biostatistics2000,1(3):247–262.
33. Stern JM, Simes RJ:Publication bias: evidence of delayed publication in a cohort study of clinical research projects.BMJ1997,315(7109):640–645.
doi:10.1186/1471-2288-14-132
Cite this article as:Jinet al.:A modified regression method to test publication bias in meta-analyses with binary outcomes.BMC Medical Research Methodology201414:132.
Submit your next manuscript to BioMed Central and take full advantage of:
• Convenient online submission
• Thorough peer review
• No space constraints or color figure charges
• Immediate publication on acceptance
• Inclusion in PubMed, CAS, Scopus and Google Scholar
• Research which is freely available for redistribution