http://www.sciencepublishinggroup.com/j/wjph doi: 10.11648/j.wjph.20180301.13
Relation of Job Related Factors with Different Dimensions
of Quality of Work Life
Shahria Sattar
1, Kamrul Laila
2, Mohammad Zakir Hossain Khan
1,
Golam Mohammad Abul Monsur Khan
31
Department of Public Health, Bangladesh Secretariat Clinic, Dhaka, Bangladesh
2
Department of Peadiatics, Bangladesh Secretariat Clinic, Dhaka, Bangladesh
3
Department of Ophthalmology, Bangladesh Secretariat Clinic, Dhaka, Bangladesh
Email address:
To cite this article:
Shahria Sattar, Kamrul Laila, Mohammad Zakir Hossain Khan, Golam Mohammad Abul Monsur Khan. Relation of Job Related Factors with Different Dimensions of Quality of Work Life. World Journal of Public Health. Vol. 3, No. 1, 2018, pp. 16-22.
doi: 10.11648/j.wjph.20180301.13
Received: March 14, 2018; Accepted: March 28, 2018; Published: May 9, 2018
Abstract:
Background The quality of organization depends on the quality of work, which controlled by workers. The problem of workers’ adjustment to their work situation is reflected through their perception of QWL. Methods This descriptive type of cross-sectional study was carried out to assess the quality of work life of the garment workers in Dhaka city. The study was conducted on a sample of 110 workers from two selected garment factories. Information was collected by using an Inventory for measuring quality of work life. In this study, effect of job related variables on five dimensions of quality of work life namely working environment, welfare measure, supervision, participation in decision making and communication were determined. Result Majority (69.1%) of the respondent were female. The ages of the participants were between 15 to 37 years. 60.9% female workers were working in sewing section, whereas 20.9% male workers working in knitting section. The mean monthly income of the respondent was around Tk. 3500. Most of them were married with educational status up to primary level and current job experience was from 1 to 3 years. The mean score for quality of work life of the workers was found to be 291.56±27.700 or 49% of maximum possible scores. Conclusion Job related variables had significant influence on all 5 dimensions of quality of work life.Keywords: QWL
(Quality of Work Life), Working Environment, Welfare Measures, Supervision, Participation in Decision Making, Communication1. Introduction
Bangladesh is a densely populated country where a large proportion of the population are living below the poverty line, and a large number of people are earning their livelihood by working in garment sectors. Readymade Garment (RMG) is the leading sector of Bangladesh in terms of employment, production and foreign exchange earning. The growth rate of RMG export was over 20% per over the last two decades. [1]
According to year 2008-2009, Out of 3.1 million manpower employed in 4825 Bangladesh Garment Manufacturers and Exporters Association (BGMEA) member factories, 2.38 million are women (85%), majorities of them are disadvantaged and economically poverty stricken women
folk. Such empowerment and employment raised awareness regarding children education, health safety, population control disaster management only so for. It is an epoch making event in the history of Bangladesh. [1]
On priority basis, the industrial world has been thinking the concept of quality of work life. Quality of work life is the
extent of relationships between individuals and
organization should be more effective [2].
Quality of work life covers almost all aspects of employees` organizational life and significantly affects the performance levels of employees. It has direct impact on human outcomes and reduces absenteeism, minor accidents, grievances and quits. QWL benefits also include financial services, consumer services, career counseling, employee information reports, retirement benefits, recreational services and health safety measures. [3]
The core concern of quality of work life and productivity has been to humanize work process, democratize authority patterns and increase organizational capabilities to adjust with the internal and the external environment. QWL and productivity include dynamic inter action and inter change between people, technology and management. [3]
The reality is that in the organization the sharing of social understanding and the participation of all parties concerned would constitute positive attitude for better QWL and higher productivity. Enhancing QWL will result in productivity improvement and gains from productivity improvements in turn will strengthen QWL. [4]
The present study is conducted to examine the job related variables have any relationship with the quality of work life and with 5 dimensions of quality of work life to explore the relationship between quality of work and quality of life in garments located at Dhaka city. This may in turn create awareness among the employer about QWL for the concerned workers.
2. Methodology
This was a descriptive of cross-sectional study carried out with the general objective of assessing the level of Quality of work life of the workers employed in different Garments located in Dhaka City. The garments were chosen purposively and depending upon easy communication, availability of samples or other relevant factors. Prior permission from the factory management as well as from the samples has been taken from each factory.
The study population consisted of both male & female workers of the selected garments working in different working section like; sewing section, knitting section, finishing section, etc holding different work designation like; helper, operator, iron man, packing man, poly packer, loader, knitting master, feder man, etc. The present study will be conducted on a sample size of 110 workers taken from two garments at Dhaka city. Samples are estimated by applying formula; n= z 2pq/d2
The respondents were selected on non probability purposive technique and they were interviewed after their verbal consent to participate in the study. Only the willing selected respondents were taken as sample. Data were collected by using a structured, pre-tested questionnaire.
A bangle version of Sinha and Sayeed`s scale as developed by Haque in 1991 was used for measuring the quality of work life in this study. The inventory developed by Sinha and Sayeed (1980) for measuring QWL having 85 items was
used. Each of these item had a 7- point scale. In this study, a subjects` response could be anywhere on this scale – the scale range being from minimum 1 to maximum 7. The items were either in question or statement or quotation forms and the subjects were to encircle an appropriate numeral (1 to 7) furnished on the right side of each item according to their agreement or disagreement, satisfaction or dissatisfaction, feeling positively or negatively with the statement. The numerals encircled were added to give the total or overall QWL score. Thus the higher the total score, the higher the perceived QWL of the subject was.
In the study, for measuring the quality of work life of the garment workers, 5 (five) dimensions were considered into account like, Working environment, Welfare measures, Supervision, Participation in decision making and Communication.
2.1. Data Collection Procedure
After having developed the relevant research instrument, selection of place of study and sample size, the data was collected from the place of study.
The respondents were briefed about the purpose of the study prior to the interview and data collection continued on all workdays. The researcher collected the required data through face to face interview. After having their informed consent, face to face interview was fruitful as many respondents were less literate and the subjective nature of the study sometimes required additional clarification and understanding.
2.2. Data Analysis
All collected data were checked and verified thoroughly to reduce any inconsistency. Then edited into computer, processed and tabulated to get a master sheet. Then coded data analyzed by using Microsoft Statistical package for the social science (SPSS) version 11.5 for windows. (108) Frequency distribution was found. Percentages, means and standard deviation were calculated where necessary. To test the significance chi- square (x2), student`s t test, ANOVA were applied where necessary. Graphical software was used for creation of charts. (tables and figures ).
3. Results / Analysis of the Data
This is a descriptive type of cross-sectional study, conducted in two selected garment factories, in Dhaka city, among 110 workers, during a period of March to June, 2010, with a view to assess the quality of work life among the garment workers and also the relation of job related factors on QWL.
The mean monthly income of the respondents was Taka 3480.91±1310.33 and, the income ranged in between Taka 1800.00 and Taka 10000. The mean income of male respondents was found to be higher (Tk4376.47±1717.30) than that of female respondents (Tk3080.26±819.43). Those employed in the knitting section were better paid (4860.87±1903.76) than those employed in the finishing (3200.00±487.74) and sewing (3091.04±846.87) sections and this difference was significant (p < 0.001). But there was no
difference in the mean monthly income of sewing and finishing group (p>0.05)
Respondents with current work experience less than 1 year had the highest QoWL score (292.65±22.809) while respondents with current job experience more than 3 years had the lowest score (285.38±30.275) for QoWL. The mean score of QoWL for current job experience was not found to be significantly different (Table 1).
Table 1. Total score Quality of Working life with current work experience.
Current work experience (years) N Total scores for QoWL Significance Mean Std. Deviation Min Max
Less than 1 year 43 292.65 22.809 248 343
F= 0.230 p=0.795
1 to 3 years 59 291.61 30.797 247 352
More than 3 years 8 285.38 30.275 244 324
Total 110 291.56 27.700 244 352
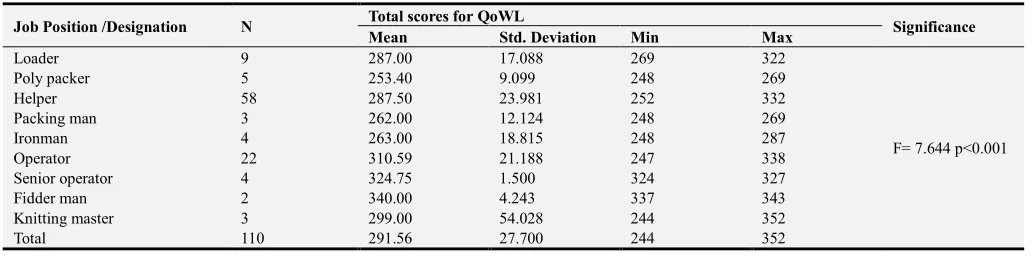
The mean score for QWL was the highest among the respondents with the designation Fidder man (340.00±4.243) which was followed by Senior operator (324.75±1.500) had the highest mean score for QWL. On the other hand, job designation with Poly packer had the lowest score for QWL (253.40±9.099). This difference of mean score of QWL was found statistically significant (Table 2).
Table 2. Total score of Quality of Work life of the respondents with job designation.
Job Position /Designation N Total scores for QoWL Significance Mean Std. Deviation Min Max
Loader 9 287.00 17.088 269 322
F= 7.644 p<0.001
Poly packer 5 253.40 9.099 248 269
Helper 58 287.50 23.981 252 332
Packing man 3 262.00 12.124 248 269
Ironman 4 263.00 18.815 248 287
Operator 22 310.59 21.188 247 338
Senior operator 4 324.75 1.500 324 327
Fidder man 2 340.00 4.243 337 343
Knitting master 3 299.00 54.028 244 352
Total 110 291.56 27.700 244 352
The overall mean score of three working sections- knitting. Sewing and finishing were highest with communication (50.86±5.824) dimension, which was followed by working environment (50.32±5.122) dimension where as the lowest mean score of QWL lied with participation in decision making (8.98±3.945). Except in case of supervision, knitting section had the highest score of mean QWL with working environment (52.70±5.004), welfare measure (20.57±3.653), participation in
decision-making (12.35±6.833) and communication
(53.00±5.036). Sewing section had the highest mean score of QWL (39.88±4.980) along with supervision dimension.
The lowest mean score of QWL was found in finishing section with all dimensions of QWL. However, statistically significant difference were found among different working sections with all mentioned dimensions of quality of work life (Table 3).
Table 3. Distribution of respondents according to working section and different dimensions of quality of work life.
Dimensions of QWL Work Section N Mean Std. Deviation Min Max Significance
working environment
Knitting 23 52.70 5.004 43 65
F= 5.755, P= 0.004
Sewing 67 50.31 4.964 39 60
Finishing 20 47.60 4.616 38 53
Total 110 50.32 5.122 38 65
Welfare measures
Knitting 23 20.57 3.653 17 26
F= 4.175, P= 0.004
Sewing 67 20.45 2.732 17 26
Finishing 20 18.45 2.038 17 23
Total 110 20.11 2.925 17 26
Supervision
Knitting 23 36.87 3.584 29 44
F= 19.641 P< 0.001
Sewing 67 39.88 4.980 28 50
Finishing 20 32.85 3.631 29 38
Total 110 37.97 5.217 28 50
Participation in decision making
Knitting 23 12.35 6.833 7 28
F= 14.439 P< 0.001
Sewing 67 8.42 2.161 7 14
Dimensions of QWL Work Section N Mean Std. Deviation Min Max Significance
Total 110 8.98 3.945 7 28
Communi cation
Knitting 23 53.00 5.036 43 64
F= 6.616 P= 0.002
Sewing 67 51.27 5.564 40 64
Finishing 20 47.05 6.022 40 55
Total 110 50.86 5.824 40 64
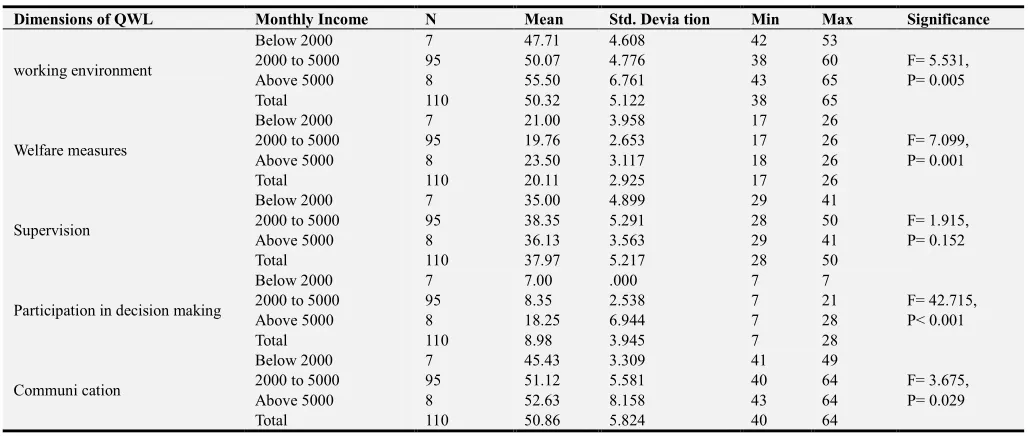
The overall mean score was highest with communication (50.86±5.824), which was followed by working environment (50.32±5.122). Workers with income above tk. 5000 per month had the highest mean scores with working environment (55.60±6.761), welfare measures (23.50±3.117), participation in decision making (18.25±6.944) and communication (52.63±8.158) except supervision where workers with income level between tk 2000 to tk. 5000 had the highest mean score of QWL (38.35±5.291) (Table 4).
One way ANOVA was done to see the differences between
different dimensions of quality of work life and among different income groups. Incase of working environment dimension, statistically significant difference was found in mean score among the income groups (F = 5.531, p < 0.01). Post Hoc test showed that mean score was significantly higher in group with monthly income of 5000 taka than both income group of 2000-5000 taka and income group of below 2000 taka. There was no significant difference between the two lower income groups (Table 4).
Table 4. Distribution of respondents according to average monthly income and different dimensions of QWL.
Dimensions of QWL Monthly Income N Mean Std. Devia tion Min Max Significance
working environment
Below 2000 7 47.71 4.608 42 53
F= 5.531, P= 0.005
2000 to 5000 95 50.07 4.776 38 60
Above 5000 8 55.50 6.761 43 65
Total 110 50.32 5.122 38 65
Welfare measures
Below 2000 7 21.00 3.958 17 26
F= 7.099, P= 0.001
2000 to 5000 95 19.76 2.653 17 26
Above 5000 8 23.50 3.117 18 26
Total 110 20.11 2.925 17 26
Supervision
Below 2000 7 35.00 4.899 29 41
F= 1.915, P= 0.152
2000 to 5000 95 38.35 5.291 28 50
Above 5000 8 36.13 3.563 29 41
Total 110 37.97 5.217 28 50
Participation in decision making
Below 2000 7 7.00 .000 7 7
F= 42.715, P< 0.001
2000 to 5000 95 8.35 2.538 7 21
Above 5000 8 18.25 6.944 7 28
Total 110 8.98 3.945 7 28
Communi cation
Below 2000 7 45.43 3.309 41 49
F= 3.675, P= 0.029
2000 to 5000 95 51.12 5.581 40 64
Above 5000 8 52.63 8.158 43 64
Total 110 50.86 5.824 40 64
Statistically significant difference was also found in mean score among the income groups in welfare measures, participation in decision making and communication dimension of QWL.
Current job experience more than 3 years had the highest mean score incase of participation in decision making
(9.75±3.012) and communication (51.50±7.309), where as current job experience less than 1 year had the highest mean score of QWL with working environment (51.86±4.801),
welfare measure (20.37±3.185), and supervision
(38.98±4.126) (Table 5).
Table 5. Distribution of respondents according to current job experience and different dimensions of quality of work life.
Dimensions of QWL Current Job Experience N Mean Std. Deviation Min Max Signifi Cance
working environment
Less than 1 year 43 51.60 4.801 42 62
F= 2.461, P= 0.900
1 to 3 years 59 49.63 5.327 38 65
More than 3 years 8 48.50 4.140 43 53
Total 110 50.32 5.122 38 65
Welfare measures
Less than 1 year 43 20.37 3.185 17 26
F= 0.332, P= 0.718
1 to 3 years 59 19.90 2.752 17 26
More than 3 years 8 20.25 2.964 17 26
Total 110 20.11 2.925 17 26
Supervision
Less than 1 year 43 38.98 4.126 29 44
F= 2.726, P= 0.070
1 to 3 years 59 37.71 5.855 28 50
More than 3 years 8 34.50 4.140 29 41
Total 110 37.97 5.217 28 50
Participation in decision making
Less than 1 year 43 9.09 4.700 7 28
F= 0.231, P= 0.795
1 to 3 years 59 8.80 3.468 7 21
Dimensions of QWL Current Job Experience N Mean Std. Deviation Min Max Signifi Cance
Total 110 8.98 3.945 7 28
Communi cation
Less than 1 year 43 51.05 5.260 41 64
F= 0.109, P= 0.897
1 to 3 years 59 50.64 6.093 40 61
More than 3 years 8 51.50 7.309 43 64
Total 110 50.86 5.824 40 64
Workers with the lowest mean score of QWL had current job experience within 1 to 3 years in welfare measure, participation in decision making and communication dimensions where as workers having current job experience more than 3 years also had the lowest mean score of QWL in working environment and supervision dimension. There was no statistically significant difference present between the mean score of different dimensions of QWL and levels of current job experience.
4. Discussion
This is a descriptive type of cross sectional study designed and conducted in two selected garments in Dhaka city with the objective of determining the state of quality of work life & job related factors among garment workers. A total of one hundred and ten workers were interviewed based on structured questionnaire constructed in line with the Sinha and Sayeed`s inventory for quality of work life (QWL). Non –probability purposive sampling method was adopted and information of the sample was collected during the period of March 2010 to May 2010.
The present study attempted to assess the quality of work life (QWL) in garment industries.
People want to work in a place where they can succeed and feel their contribution is appreciated. They want to work in great work environment. The absence of this environment can push people to explore their opportunities. Organizations need employees connected to their mission and focused on delivering their products or services as efficiently and effectively as possible. [5]
A study in South Ethiopia showed that 67.2% of the nurses were dissatisfied with the quality of their work life. It was found that age, sex, marital status, years of experience, and type of institution had no significant relationship with QWL but educational status, monthly income, working unit, and work environment were strong predictors of quality of work life among nurses. [6].
The impact of “designation”, “experience” and “age” factors among software firm employees in Bangladesh on existing and expected quality of work life (QWL) was studied. The designation, experience and age of Software Firms employees in Bangladesh do not alter their rating of the existing and expected quality of work life (QWL). [7]
In present study, the overall score for Quality of work life (QWL) of the respondent varied from 244 to 352. The mean score for QWL was found to be significantly higher among respondents working in knitting section, other than sewing and finishing section. This was male dominant section and better paid than females which was the usual picture in any garment industry in Dhaka and correlates with other studies.
[8]
In Cairo Amman Bank, a study had been conducted to examine the differences in the satisfaction levels of employees towards the quality of work life. Therewas significant positive impact of quality of work life across gender, education, and cadre but no significant difference has been found across age, and length of service. [9]
In relation to gender, male had lower mean score for QWL than female, which was not significant and this result is not supported by other studies. [10] Females were more in number and working in sewing section. This result was significant and supported by other studies. [8]
In relation to job position or designation, the mean score for QWL was highest for Fidder man. On the other hand, poly packer was the lowest and it was not found statistically significant. Fidder man working in the knitting section enjoyed better salary but poly packer working in finishing section, not so well paid. So, the designations of the respondents of the garments did not significantly alter their perception of QWL which was supported by other studies. [3, 11]
The ages of the participants were between 15 to 37 years. Most of them were between 20 to 30 years of age but the highest mean score of QWL were enjoyed by age group 30 to 40 years and the lowest by the age group less than 20 years. This difference was not significant statistically and other studies correlates with it. [3, 10, 11]
It was found that the older age group (30 to 40 years) had perceived more quality of work life which was supported by other studies. [10]
In the present study, incase of educational status, the highest mean score of QWL was obtained by those who attained HSC or higher level of education and it was decreased with decreasing level of education. This result was found significant and correlated with other studies. [11]
The present study provided evidence that the marital status had significant effect on their QWL. The married workers were enjoying better quality of work life as both of them had the scope to contribute to their family. [10]
The results of the present study indicated that the significant difference were found among workers with the level of monthly income in terms of quality of work life. Well paid workers with monthly income tk. 5000 or above enjoyed the highest score of QWL, where as monthly income below tk. 2000 the lowest QWL. This result was also supported by other studies. [11]
conducting some more training classes for the employees who are falling in the category of more than 3 to 4 years of experience and >4 years of experience which would boost their self confidence and help them attain their level of satisfaction. Similarly the organization can give some more security to the employees. [12]
Oganizations can get to know the quality of work life of the employees and take necessary steps to improve the QWL among all the Employees. It also helps the employers to know that their employees who are working in their organization are happily working leading to good QWL which will boost up their performance to come happily daily to their work place. [12]
The result of the study showed that the current job experience had no significant effect on QWL. Workers having experience less than 1 year, enjoying better quality of work life. This finding was also supported by other studies. [3, 10, 11]
A study on QWL and various job related aspects like, i) wages and salaries; (ii) rewards system (iii) a safe and healthy environment; (iv) working conditions; (v) interpersonal relations and (vi) superiors was done to measure the QWL and job satisfaction of employees. The result showed that there is dissatisfaction in the interpersonal relations between the cader wise QWL and no proper grievance handling procedure were adopted among the employees which affect the job satisfaction. [13]
In the present study, effect of job related variables on 5 dimensions of QWL were studied. Dimensions were Working environment, Welfare measures, Supervision, Participation in decision making and Communication.
With in the working section, the overall score for the dimension communication was the highest where as the score for participation in decision making was the lowest. In the knitting section the mean score was the highest for working environment, welfare measures, participation in decision making and communication. The mean score for the dimension supervision was highest in the sewing section. So, working section had significant influence on all the dimensions of QWL which correlated with other studies. [11, 14, 15]
All dimensions except supervision had significant effect on monthly income. Monthly income within Tk. 2000 to 5000 had the highest score of QWL with supervision, on the other hand monthly income more than Tk. 5000 had the
highest working environment, welfare measures,
participation in decision making and communication. This result is supported with other studies. [11]
A study discovered job stress as a high priority indicator of QWL on Marketing Representatives of Pharmaceutical Industries in Bangladesh. Organizational atmosphere based on fairness, experience sharing culture, employee suggestion scheme, opportunity to use skill and satisfactory reward system as influential determinants of QWL. [16]
Marital status had significant influence on welfare measures and participation in decision making whereas marital status had no significance on working environment, supervision and communication dimension of work life. This was also
supported by other studies. [10, 17-21]
Current job experience had no significant influence on the overall dimensions of QWL, which is correlated with other studies. [10, 11, 20, 21]
Educational level had significant influence on all dimensions of QWL and supported by other studies too. [11, 19] Respondent with educational level of HSC and higher had the highest score of QWL with working environment, welfare measurement, participation decision making and communication, but respondent with primary level had highest score of QWL in supervision.
5. Conclusion
Garment industry is functioning in a environment where five dimensions of quality of work life, i.e., working environment, welfare measures, supervision, participation in decision making and communication have significant relation with job related variables. The mean quality of work life among the garment worker is found to be below average, so the concern authority do need immediate action to improve the quality of work life. So, from the above findings of the study it is highlighted that quality of work life is a significant issue in occupational aspect that need to be addressed to concerned people. Hope fully it will create awareness to the authority of factory management, national legal authorities and leaders both for personal and public aspect.
Recommendations
Based on the results of this study it is expected that the present findings might be helpful to know the quality of work life which is vital to understand the problems of the workers with their workplace and also to adopt suitable policies for making them happier with their work situation. It might serve as a basis for further research and studies.
References
[1] BGMEA, Brief. CAFAXPO, 2010.
[2] Guest, R. H. Quality of work life- learning from Tarrytown. Harvard Business Review, 1979; 57 (4), 76-87.
[3] Sadique, Dr. M. Z. The Impact of Designation, Experience and age on Existing and Expected Quality of work life; A Case Study of four Sugar Mills in Bangladesh. Daffodil Int. Univer. J. of Business and Economics, 2007; 2 (1); 155-156.
[4] Walton, R. E. How to Counter Alienation in the Plant, Harvard Business Review, 1972; Nov-Dec.
[5] Ali, T. Akter, I. and Newaz, M. K. Employee perception regarding turnover decision- in context of Bangladesh Banking sector, Brac Univer J. 2007; 4 (2): 67-74.
[7] Bose, S. Analyses of Quality of Work Life in Bangladesh: A Comparative Study on Software Firms, International J. of Applied Psychology, 2015; 5 (6): 165-172.
[8] Chowdhury, N. S. Depression among workers in selected Garment Factories. NIPSOM, 2008.
[9] Al Dalayeen, B. A Study on Quality of Work Life among Employees in Cairo Amman Bank. J. of Financial Risk Management, 2017; 6: 191-200.
[10] Saha, N. K. and Elias, S. Environmental Pollution and Quality of working Life in Tobacco Industries. J. Life Earth Science, 2005; 1 (1); 21-24.
[11] Kanagalakshmi, L. and Nirmala, D. B. A Study on perception of QWL among Textile manufacturing workers in Tirunelveli. 2003.
[12] Mily Velayudhan, Dr. T. K. and Yameni, M. D. QUALITY OF WORK LIFE – A STUDY, 2017. [email protected], [email protected].
[13] Muindi, F. and k’Oobonyo, P. Quality of work life, personality, Job satisfaction, competence, and job performance a critical review of literature, European Scientific J. 2015; (11-26); 223-226.
[14] Chan and Wyatt, Quality of work life in China, 2007.
[15] Dhar, R. L. Quality of work life; A study of Municipal Corporation Bus Driver, 2008.
[16] Huda, K. N. Measuring the Impacts of Quality of Work Life Indicators on the Marketing Representatives of Pharmaceutical Industries. Bangladesh Pharmaceutical J. 2017; 20 (1):46-53.
[17] Anbarasan, V. and Mehta, N. An exploratory study on perceived Quality of Working life among Sales Professionals employed in Pharmaceutical, Banking, Finance and Insurance companies in Mumbi. 2009; April.
[18] Hoque, R. Human Resource Development; A case study on Dhaka Bank, 2008.
[19] Pahik, R. D. and Pestonjee, D. D. Organizational Politics orientation as Related to Job satisfaction, job Involvement and job anxiety among Research and Development personnel, South Asian J. of Management, 1997.
[20] Uddin, M. T. Islam, M. T. and Ullah, M. O. A Study on the Quality of Nurses of Government hospitals in Bangladesh, Proc. Pakistan Acad. Sci. 2006; 43 (2); 121-129.