O R I G I N A L R E S E A R C H
Open Access
Camelid reporter gene imaging: a generic
method for
in vivo
cell tracking
Lode RY Goethals
1,2*, Tomas J Bos
3, Luc Baeyens
4, Frank De Geeter
1, Nick Devoogdt
1and Tony Lahoutte
1,5Abstract
Background:To combine the sensitivity of bioluminescent imaging (BLI) with the 3D and quantitative properties of pinhole single-photon emission computed tomography (SPECT)/micro-computed tomography (CT) (phSPECT/micro-CT), we generated stable cell lines that express a yellow-fluorescent protein (YFP) and Gaussia luciferase (GLuc) fusion protein
(YFP/GLuc). Forin vivophSPECT detection of this YFP/GLuc protein, a nanobody, targeted against yellow and
green fluorescent proteins (anti-YFP-Nb), was site specifically labelled with99mTc.
Methods:Human embryonic kidney cells (HEK293T) were cultured and passaged every 3 days. 10E5 cells were transduced with YFP/GLuc-containing vector: both membrane-targeted (MT-YFP/GLuc) and non-targeted (YFP/GLuc) fusion proteins were developed. These vectors were compared against a SKOV-3 cell line stably expressing green fluorescent-firefly luciferase (GFP/Fluc) and HEK293T cells expressing red fluorescent protein in combination with a Gaussia luciferase (Red/GLuc). Transduction efficiencies were scored by fluorescence microscopy, and transduced cells were enriched by fluorescence-activated cell sorting (FACS). GLuc and FLuc functionality was testedin vitroby list-mode BLI. Subsequently, cells were transplanted subcutaneously in athymic (nu/nu) mice (MT-YFP/GLuc:n= 4, YFP/GLuc:n= 6, GFP/FLuc:n= 6, Red/GLuc:n= 4). Labelling efficiency of anti-YFP-Nb was measured using instant thin layer chromatography. One week after transplantation,99mTc-labelled anti-YFP-Nb was injected intravenously
and pinhole (ph) SPECT/micro-CT was performed, followed byin vivoBLI.
Results:Cells showed high levels of fluorescence after transduction. The cells containing the MT-YFP/GLuc were positive on fluorescence microscopy, with the fluorescent signal confined to the cell membrane. After cell sorting, transduced cells were assayed by BLI and showed a significantly higher light output bothin vitroandin vivocompared with non-transduced HEK293T cells. The anti-YFP-Nb labelling efficiency was 98%, and subsequent phSPECT/micro-CT demonstrated visible cell binding and significantly higher transplant-to-muscle ratio for both the MT-YFP/GLuc and YFP/GLuc transplanted cells, compared with the GFP/FLuc and Red/GLuc group.
Conclusion:This study provides a proof of principle for a nanobody-based cell tracking method, using a YFP/GLuc fusion protein and anti-YFP-Nb in a model of subcutaneously transplanted transduced HEK293T cells.
Keywords:Cell tracking; Fluorescence; Bioluminescence; SPECT/CT; Nanobody; YFP
Background
A growing number of animal and preclinical studies reveal the potential of cell-based therapies in a variety of applica-tions [1], including myocardial infarction and beta-cell precursor transplantation in diabetes. To evaluate the long-term efficacy of these experimental treatments, it is
useful to monitor transplanted cells qualitatively and quantitatively in vivo. Indirect cell labelling through re-porter gene imaging provides an elegant method to per-form such cell tracking [2]. Reporter genes are available for different imaging modalities, which can be largely di-vided into optical imaging, MRI and nuclear imaging (PET/SPECT). Optical cell tracking exploits the sensitivity of liquid-cooled CCD cameras with the inherently low background signal to produce a high sensitivity (up to 10E−17 mol/l) [3]. In contrast, luminescent signals are difficult to quantify and suffer a high attenuation of visible
* Correspondence:[email protected] 1
In Vivo Cellular and Molecular Imaging Laboratory, Vrije Universiteit Brussel, Laarbeeklaan 103, Jette 1090, Belgium
2
Department of Radiology, Universitair Ziekenhuis Brussel, Laarbeeklaan 101, Jette 1090, Belgium
Full list of author information is available at the end of the article
light, especially when emitted from the inner organs. In parallel, nuclear imaging modalities generate a signal that combines high sensitivity (up to 10E−12 mol/l), with quantitative 3D possibilities, when using adequate scatter and attenuation corrections [3-5]. Commonly used SPECT-or positron emission tomography (PET)-based repSPECT-orter gene systems include herpes simplex virus-thymidine kin-ase (HSV-tk)-, sodium iodine symporter (NIS)- and mu-tant dopamine receptor (D2R)-based systems [6-8].
This study investigates the feasibility of developing a new multimodality cell tracking method, combining the optical sensitivity and the quantitative possibilities of nu-clear imaging with the advantageous physico-chemical properties of nanobodies. Nanobodies are the antigen-binding fragments from heavy-chain-only antibodies naturally occurring in Camelidae [9]. Nanobodies are considered to be the smallest intact antigen-binding fragments derived from a functional antibody. Their lim-ited size of approximately 15 kDa and their general ro-bustness make them very suitable for in vivo imaging [10]. Nanobodies labelled with99mTc have been used for targeting specific epitopesin vivo, for example, CEA and EGFR2 [11,12].
In this study, we used an anti-green fluorescent pro-tein (GFP) nanobody, labelled with 99mTc, to perform
in vivo cell tracking. This nanobody is cross-reactive with both yellow fluorescent protein (YFP) and GFP, two closely related fluorescent proteins [13,14]. As molecular target, we transduced cells lentivirally with a fusion pro-tein, consisting of a yellow fluorescent protein/Gaussia luciferase (YFP/GLuc) fusion protein. This fusion protein combines the fluorescence of YFP, a bright and versatile fluorescent protein (excitation peak 514 nm, emission peak 527 nm), with Gaussia luciferase, a naturally secreted
luciferase, cloned from Gaussia princeps with coelentera-zine as its substrate. The oxidation of coelenteracoelentera-zine does not require ATP, and it is therefore also suitable for im-aging when the protein is secreted or bound to the outer cell membrane [15].
To facilitate recognition of the fluorescence epitope by the nanobody, we generated a vector that displays the YFP/GLuc fusion protein on its outer membrane [16] and compared it against its intracellular counterpart. Both were compared against a combined GFP/firefly lu-ciferase (FLuc)-expressing cell line. Firefly lulu-ciferase has been extensively utilized forin vivobioluminescence and catalyses the oxidation of D-luciferin to yield light with a peak emission of 562 nm in the presence of O2,
magne-sium and ATP. Throughout this study, a red fluorescent protein/Gaussia luciferase-expressing HEK293T cell line (Red/GLuc) was used as a negative control.
In summary, the aim of this study was to provide a proof of principle for the monitoring of transplanted cells in vivo using intravenously injected 99mTc-labelled anti-YFP nanobodies.
Methods
Plasmids
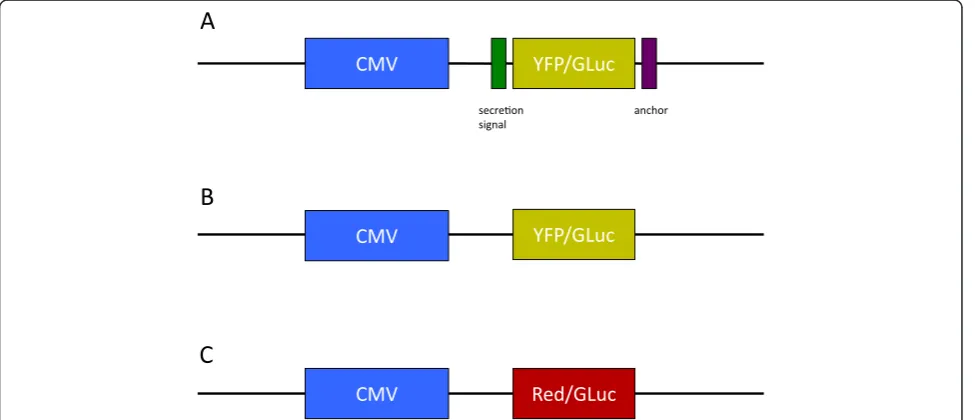
Lentiviral constructs were generated using standard mo-lecular biology techniques (Figure 1). The YFP/GLuc fu-sion protein was cloned into a lentiviral backbone (LV. YFP/GLuc). The pDisplay™ vector (Life Technologies, Invitrogen, Carlsbad, CA, USA), a vector that anchors any protein to the cell membrane, was cloned into this YFP/GLuc lentiviral backbone, yielding the LV.MT-YFP/ GLuc vector. A control vector was prepared by cloning the GLuc gene into a lentiviral plasmid containing a red fluorescent fluorochrome (Red/GLuc).
Cell lines
Human embryonic kidney (HEK) 293T cells were cultured in Dulbecco's modified Eagle medium (DMEM), 10% fetal bovine serum (FBS) and penicillin-streptomycin and pas-saged every 3 days. Cells were grown at 37°C and in a 5% CO2atmosphere. A total of 100,000 cells were transduced
with all three of the aforementioned lentiviral vectors, and 2 days upon transduction, cells were sorted for fluores-cence expression and subcloned cells were cultured ac-cording to the above-mentioned protocol. A GFP and firefly luciferase (FLuc)-expressing SKOV3 cell line was purchased (Bio-Connect®, Huissen, the Netherlands).
Cell line validationin vitro: microscopy andin vitroBLI
Transduction efficiency was scored by fluorescence mi-croscopy. Further localization of the fluorescent signal was obtained by confocal microscopy (Zeiss LSM710 NLO TiSa multiphoton confocal microscope using Zeiss Zen2011 software, Carl Zeiss NV-SA, Zaventem, Belgium). Luciferase functionality was determined using in vitro bioluminescence imaging (BLI). HEK293T and SKOV3 cells were plated in six-well plates. For GLuc-expressing cells, a coelenterazine solution (50μl per well of a 1 mg/ ml solution) was added to approximately 2E6 cells per well. In parallel, 2E6 FLuc-expressing SKOV3 cells were imaged upon adding 150μl of D-luciferin (30 mg/ml) per well. Images were obtained with a Photo Imager camera (Biospace, Paris, France) that allows list-mode acquisition.
Xenograft model
All animal experiments were performed with the ap-proval of the ethical committee for animal research of the Vrije Universiteit Brussel. During transplantation, all mice were anaesthetized with a mixture of oxygen and 5% isoflurane and maintained with a mixture of oxygen and 2.5% isoflurane. Twenty immune-deficient athymic (nu/nu) mice were purchased (Charles River, Chatillon-sur-Chalaronne, France). Cells growing exponentially in culture were suspended in 150μl of phosphate-buffered saline (PBS) and 150 μl Matrigel (BD Biosciences, San Jose, CA, USA) and transplanted subcutaneously in the hind leg. Mice were inoculated with either MT-YFP/ GLuc-expressing cells (n= 4), YFP/GLuc-expressing cells (n= 6) or cells that expressed Red/GLuc (n= 4). Also, six mice were transplanted with the SKOV3 cells. All trans-plants consisted of 2E6 cells.
In vivoBLI
BLI was performed immediately after SPECT/CT while the animals were still anaesthetized. Coelenterazine (1 mg/ml) or D-luciferin (30 mg/ml) was injected intra-venously via the tail vein. A solution of 30μl substrate and 120μl NaCl was administered. Immediately after substrate injection, mice were imaged using a Photo Imager camera
(Biospace, France). Light emission was measured using the large field-of-view setting and registered using the photon counting technology during 1 min. A grey-scale photographic image of the mice was fused with the bio-luminescent images. The most intense luciferase signal is shown in red, the weakest signal in blue. To analyse the images, an elliptical region of interest (ROI) was drawn over the transplant location, using a constant surface area.
Nanobody labelling
Nanobodies were labelled with 99mTc at their hexahisti-dine tail. For the labelling, [99mTc(H2O)3(CO)3]+was
syn-thesized by adding 1 ml of99mTcO4− (0.84 to 3.7 GBq) to
an Isolink kit (Mallinckrodt Medical BV, Petten, the Netherlands) containing 4.5 mg of sodium boranocarbo-nate, 2.85 mg of sodium tetraborate, 10 mg H2O, 8.5 mg
of sodium tartrate and 7.15 mg of sodium carbonate at pH 10.5. The vial was incubated at 100°C in a boiling bath for 20 min. The freshly prepared [99mTc(H2O)3(CO)3]+
was allowed to cool at room temperature for 5 min and neutralized with 125μl of 1 M HCl to pH 7 to 8. A total of 500μl of the tricarbonyl solution was added to 50μl of carbonate buffer at pH 8. The mixture was incubated for 90 min at 60°C in a water bath. The99mTc-nanobody solution was purified on a NAP-5 column (GE Healthcare, Little Chalfont, Buckinghamshire, UK) pre-equilibrated with PBS. The labelling efficiency was determined by in-stant thin layer chromatography.
Pinhole SPECT/micro-CT
One week after transplantation, anaesthesia was induced with isoflurane gas 3% in an air/oxygen mixture. For the induction of anaesthesia, ketamine/xylazine was given intraperitoneally. The animal was placed in supine pos-ition during acquispos-ition, and images were acquired 60 min after tracer injection. Micro-CT imaging was followed by pinhole SPECT on separate systems.
Micro-CT was performed using a dual-source CT scanner (Skyscan 1178 micro-CT, Skyscan, Kontich, Belgium) with a 60-kV voltage and 615-mA tube current at a resolution of 83 μm. The total body scan time was 2 min. Images were reconstructed using filtered back projection (NRecon; Skyscan).
The SPECT acquisitions were performed using a dual-headed gamma camera (e.cam, Siemens Medical Solutions, Hoffman Estates, IL, USA) equipped with a triple pinhole collimator. The collimator has a focal length of 250 mm. Sixty-four projections of each 30 s were acquired over 360° of rotation into a 64 × 64 matrix. The total imaging time was approximately 15 min.
to the scanner bed. The disks measured 25 mm in diam-eter and 3 mm in thickness. The six beads provided refer-ence points in both imaging modalities and were used as markers to generate a spatial transformation matrix. The spatial position of the six fiducial markers was determined manually using A Medical Image Data Examiner (AMIDE). phSPECT images were analysed using AMIDE [17]. 3D elliptical regions of interest were drawn around the transplants on SPECT/micro-CT images. Transplant to muscle ratios were calculated as the mean activity within these ROIs divided by the mean activity within ROIs drawn in muscle tissue.
In vitrobiodistribution
After imaging, all animals were killed. Blood, liver, kid-neys, muscle and transplants were dissected and weighed. The amount of activity was determined using a gamma counter (Canberra, Zellik, Belgium). Tracer uptake was expressed as the percentage injected dose per gram of tis-sue (%ID/g).
Statistical analysis
Average transplant-to-muscle ratios were compared be-tween groups using the Kruskall-Wallis test. Post-hoc
comparisons were made by Mann-Whitney tests using a Bonferroni correction for multiple testing.
Results
Transduction efficiency
Fluorescence-activated cell sorting (FACS) showed a positive fraction of 78% in the MT-YFP/GLuc group. Within the YFP/GLuc group, 63% was positive. In the Red/GLuc group, 62% was positive. These positive frac-tions were sorted and subcultured.
Cell line validationin vitro: microscopy andin vitroBLI
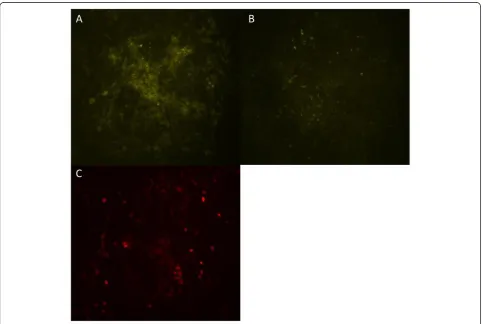
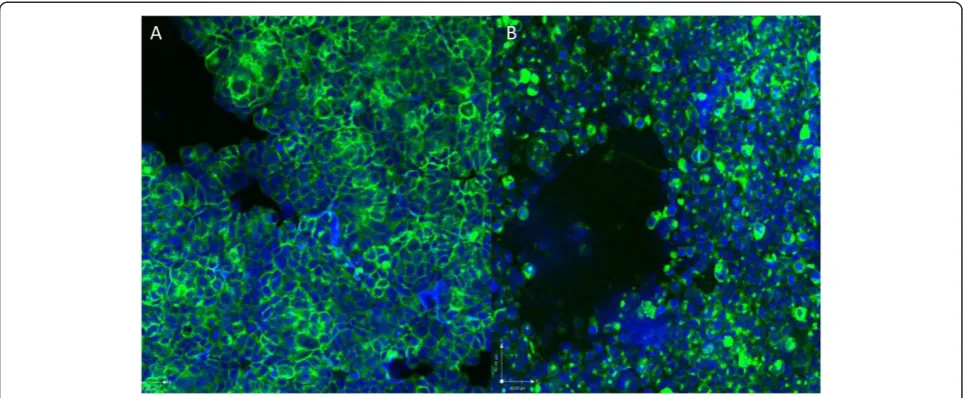
Functionality of the fluorescence in the in-house devel-oped cell lines was shown using fluorescence microscopy (Figure 2B,C). Confocal microscopy showed fluorescence confined to the cell membrane in the MT-YFP/GLuc cell line, suggesting proper targeting of protein to the cell membrane (Figure 3A). In the YFP/GLuc cell line, the sig-nal emanated from the cytoplasm as well as the cell mem-brane and possibly even from the extracellular space.
In vitro BLI showed an increased light output in all cell lines, compared with non-transduced HEK293T cells (Figure 4A,B,C,D,E).
In vivoBLI
In vivo BLI showed increased light output in all trans-duced transplants compared with the non-transtrans-duced transplant. This suggests viable transplants in every transduced cell line (Figure 4A,B,C,D,E).
Nanobody labelling efficiency
Labelling efficiency of the anti-YFP nanobodies was in excess of 98%.
Pinhole SPECT/micro-CT
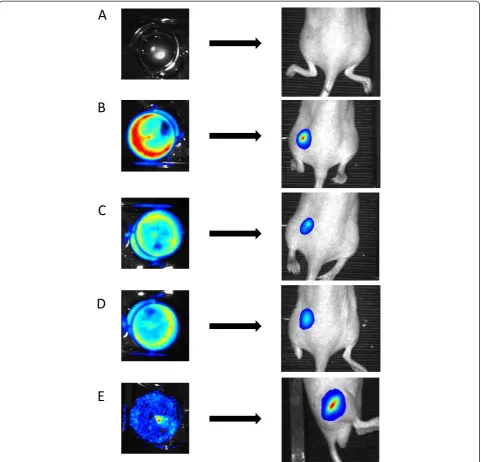
A well-delineated spot of tracer accumulation was found on the sites of inoculation in transplants in the MT-YFP/GLuc and the MT-YFP/GLuc groups, representing bind-ing of the nanobody on the transplants. In the GFP/FLuc and the Red/GLuc groups, no tracer uptake could be dis-cerned within the transplants (Figure 5A,B,C,D). Image processing yielded an average transplant-to-muscle ratio of 0.85 ± 0.2 in the Red/GLuc group, 7.59 ± 1.34 in the MT-YFP/GLuc group, 5.65 ± 0.8 in the YFP/GLuc group and 1.1 ± 0.4 in the GFP/FLuc group. Kruskall-Wallis ing showed a significance between groups. Post-hoc test-ing ustest-ing multiple Mann-Whitney tests further localizes these differences between the YFP/GLuc and the GFP/ GLuc groups (p< 0.001) and between the GFP/GLuc and the Red/GLuc (p< 0.001). Significance was also achieved between the MT-YFP/GLuc group compared with the Red/GLuc group (p< 0.001) and the GFP/GLuc group (p< 0.001). No significance was noted between YFP/ GLuc and MT-YFP/GLuc, nor between the Red/GLuc and GFP/FLuc.
In vitrobiodistribution
Dissection results for the transplants, expressed as %ID/g, are given in Table 1, confirming transplant targeting in the
MT-YFP/GLuc and the YFP/GLuc groups, but not in the Red/GLuc or the GFP/FLuc group.
Discussion
In this study, we developed a fusion protein, comprising the yellow fluorescent protein (YFP), linked to Gaussia luciferase (GLuc), as a molecular target for99mTc-labelled anti-YFP nanobodies.
To allow epitope recognition, we targeted this fusion protein to the cell membrane using the pDisplay™vector, a 5.3-kb mammalian expression vector that allows dis-play of proteins on the cell surface, using a fusion of the protein at the N-terminus of the Ig κ chain leader se-quence, which directs the protein to the secretory path-way, and the C-terminus of the platelet-derived growth factor receptor transmembrane domain, which anchors the protein to the plasma membrane, displaying it on the extracellular side [16].
The total size of this multimodal reporter system is ap-proximately 50 kDa, leaving the expression cassette small enough to be carried in most viral vectors [16].
and YFP preserved the bioluminescent and fluorescent properties.
Localization of the fluorescent signal on confocal microscopy showed a fluorescent signal confined to the cell membrane in the MT-YFP/GLuc group. In the non-targeted YFP/GLuc group, the fluorescent signal was more heterogeneously distributed, as it originated from the cytoplasm as well as from the cell mem-brane and possibly even from the extracellular space. The YFP/GLuc epitope was recognized in vivo by its
99m
Tc-anti-YFP nanobody in both the MT-YFP/GLuc
intracellular luciferase and reacts with its substrate D-luciferin intracellularly [20].
This study is the first to exploit the advantageous imaging properties of nanobodies forin vivonuclear im-aging in a context of reporter gene imim-aging, in combin-ation with luminescence and fluorescence. Because of these nanobody characteristics, especially the small size (approximately 15 kDa), transplants are clearly distin-guished on phSPECT/CT with average transplant-to-muscle ratios of 7.59 as soon as 45 min after injection of the tracer. Although comparison with other tracers is difficult, Venisnik et al. achieved a similar %ID within their transplants using an engineered anti-carcinoembryonic antigen (CEA) antibody fused to a Gaussia luciferase. In our study, we show a faster kinetics compared with Venisnik et al. [21]. Undoubtedly, this fasterin vivokinetics owes to the small size of the nanobody in comparison with a Gaussia luciferase-engineered anti-CEA antibody [21].
During the past years, several reporter systems have been developed that generate SPECT or PET contrast. The most well known are the HSV-tk-, D2R- or
NIS-based systems. Each of these methods has its inherent advantages and disadvantages. HSV-tk-based imaging systems suffer high liver and intestinal background activ-ity due to hepatobiliary excretion of tracers such as 18 F-FHPG [22]. The D2R-based 99mTc-TRODAT SPECT
system has a low dynamic range and yields only modest signal to background activities due to the lipophilicity of
the tracer [23]. NIS-expressing transplants use 99mTc or
123
I as tracer, with physiological uptake in the stomach, thyroid and glandular tissue. Efflux of isotopes from the cells due to lack of organification and low uptake of tracers can compromise adequate cell tracking [24]. Intravenously injected radiolabelled nanobodies have a specific biodistribution characterised by a high renal ex-cretion, in combination with a low background signal in other organs such as the liver, lungs and myocardium. This allows high signal-to-noise ratios using this nanobody-based imaging method for the long-term as-sessment of cell therapy.
In the present study, the anti-YFP nanobody was la-belled with 99mTc, but labelling of nanobodies with PET radio-isotopes (18F or68Ga) is feasible [25]. In addition, labelling of antibody fragments with fluorescent labels as well as MRI contrast is feasible [16], rendering this YFP-anti-YFP reporter system applicable for multimodalin vivo imaging studies.
Conclusion
We provided proof of principle for a YFP-GLuc fusion protein as reporter protein to perform noninvasive cell tracking, in combination with a 99mTc-labelled anti-YFP nanobody. Both the membrane-targeted and the non-targeted lentiviral vector encoding for a YFP/GLuc fu-sion protein could be targetedin vivo.
Figure 5Para-coronal SPECT/micro-CT fused images at the level of the transplants in the MT-YFP/GLuc (A), YFP/GLuc (B), Red/GLuc (C) and GFP/Fluc (D).
Table 1 Dissection data
Transplant (%ID/g) Muscle (%ID/g) Liver (%ID/g) Blood (%ID/g) Kidneys (%ID/g)
MT-YFP/GLuc 2.2 ± 0.9 0.2 ± 0.1 0.4 ± 0.2 0.2 ± 0.1 20.3 ± 7.3
YFP/GLuc 1.8 ± 0.9 0.1 ± 0.1 0.4 ± 0.2 0.3 ± 0.1 20.4 ± 6.1
Red/GLuc 0.2 ± 0,1 0.1 ± 0.1 0.5 ± 0.2 03 ± 0.1 22.8 ± 6.2
GFP/FLuc 0.3 ± 0.2 0.2 ± 0.1 0.4 ± 0.3 0.6 ± 0.2 30.2 ± 9.8
Competing interests
The authors declare that they have no competing interests.
Authors' contributions
LG (the first author) conceived and coordinated the study and carried out the experiments. TB constructed the lentiviral vectors for transduction. LB performed fluorescence and confocal microscopy. FD performed statistical analysis and participated in the design of the study. ND prepared the nanobodies. TL participated in the design and coordination of the study and helped to draft the manuscript. All authors read and approved the final manuscript.
Acknowledgements
We acknowledge Cindy Peleman, Gert-Jan Allemeersch and Veerle De Grove for their aid in performing the experiments.
Author details 1
In Vivo Cellular and Molecular Imaging Laboratory, Vrije Universiteit Brussel, Laarbeeklaan 103, Jette 1090, Belgium.2Department of Radiology, Universitair
Ziekenhuis Brussel, Laarbeeklaan 101, Jette 1090, Belgium.3Department of Cellular and Molecular Medicine, UC San Diego, 9500 Gilman Drive, La Jolla, CA 92093, USA.4Beta Cell Neogenesis, Vrije Universiteit Brussel,
Laarbeeklaan103, Jette 1090, Belgium.5Department of Nuclear Medicine,
Universitair Ziekenhuis Brussel, Laarbeeklaan 101, Jette 1090, Belgium.
Received: 20 March 2014 Accepted: 3 June 2014
References
1. Ren G, Chen X, Dong F, Li W, Ren X, Zhang Y, Shi Y:Concise review: mesenchymal stem cells and translational medicine: emerging issues.
Stem Cells Transl Med2012,1:51–58.
2. Zhang SJ, Wu JC:Comparison of imaging techniques for tracking cardiac stem cell therapy.J Nucl Med2007,48:1916–1919.
3. Kang JH, Chung JK:Molecular-genetic imaging based on reporter gene expression.J Nucl Med2008,49(Suppl 2):164S–179S.
4. Vanhove C, Defrise M, Bossuyt A, Lahoutte T:Improved quantification in multiple-pinhole SPECT by anatomy-based reconstruction using microCT information.Eur J Nucl Med Mol Imaging2011,38:153–165.
5. Goethals LR, De Geeter F, Vanhove C, Roosens B, Devos H, Lahoutte T: Improved quantification in pinhole gated myocardial perfusion SPECT using micro-CT and ultrasound information.Contrast Media Mol Imaging2012,7:167–174.
6. Miyagawa T, Gogiberidze G, Serganova I, Cai S, Balatoni JA, Thaler HT, Ageyeva L, Pillarsetty N, Finn RD, Blasberg RG:Imaging of HSV-tk reporter gene expression: comparison between [18F]FEAU, [18F]FFEAU, and other imaging probes.J Nucl Med2008,49:637–648.
7. Terrovitis J, Kwok KF, Lautamäki R, Engles JM, Barth AS, Kizana E, Miake J, Leppo MK, Fox J, Seidel J, Pomper M, Wahl RL, Tsui B, Bengel F, Marbán E, Abraham MR:Ectopic expression of the sodium-iodide symporter enables imaging of transplanted cardiac stem cells in vivo by single-photon emission computed tomography or positron emission tomography.
J Am Coll Cardiol2008,52:1652–1660.
8. MacLaren DC, Gambhir SS, Satyamurthy N, Barrio JR, Sharfstein S, Toyokuni T, Wu L, Berk AJ, Cherry SR, Phelps ME, Herschman HR:Repetitive, non-invasive imaging of the dopamine D2 receptor as a reporter gene in living animals.
Gene Ther1999,6:785–791.
9. Vaneycken I, D'huyvetter M, Hernot S, De Vos J, Xavier C, Devoogdt N, Caveliers V, Lahoutte T:Immuno-imaging using nanobodies.Curr Opin Biotechnol2011,22:877–881.
10. De Vos J, Devoogdt N, Lahoutte T, Muyldermans S:Camelid single-domain antibody-fragment engineering for (pre) clinical in vivo molecular imaging applications: adjusting the bullet to its target.Expert Opin Biol Ther2013, 13:1149–1160.
11. Vaneycken I, Govaert J, Vincke C, Caveliers V, Lahoutte T, De Baetselier P, Raes G, Bossuyt A, Muyldermans S, Devoogdt N:In vitro analysis and in vivo tumor targeting of a humanized, grafted nanobody in mice using pinhole SPECT/micro-CT.J Nucl Med2010,51:1099–1106. 12. Gainkam LO, Huang L, Caveliers V, Keyaerts M, Hernot S, Vaneycken I,
Vanhove C, Revets H, De Baetselier P, Lahoutte T:Comparison of the biodistribution and tumor targeting of two 99mTc-labeled anti-EGFR
nanobodies in mice, using pinhole SPECT/micro-CT.J Nucl Med2008, 49:788–795.
13. Pichler G, Leonhardt H, Rothbauer U:Fluorescent protein specific nanotraps to study protein-protein interactions and histone-tail peptide binding.
Methods Mol Biol2012,911:475–483.
14. Rothbauer U, Zolghadr K, Muyldermans S, Schepers A, Cardoso MC, Leonhardt HA:Versatile nanotrap for biochemical and functional studies with fluorescent fusion proteins.Mol Cell Proteomics2008,7:282–289. 15. Suzuki T, Usuda S, Ichinose H, Inouye S:Real-time bioluminescence
imaging of a protein secretory pathway in living mammalian cells using Gaussia luciferase.FEBS Lett2007,581:4551–4556.
16. Niers JM, Chen JW, Lewandrowski G, Kerami M, Garanger E, Wojtkiewicz G, Waterman P, Keliher E, Weissleder R, Tannous BA:Single reporter for targeted multimodal in vivo imaging.J Am Chem Soc2012,134:5149–5156. 17. Loening AM, Gambhir SS:AMIDE: a free software tool for multimodality
medical image analysis.Mol Imaging2003,2:131–137.
18. Finn J, MacLachlan I, Cullis P:Factors limiting autogene-based cytoplasmic expression systems.FASEB J2005,19:608–610.
19. Thompson EM, Adenot P, Tsuji FI, Renard JP:Real time imaging of transcriptional activity in live mouse preimplantation embryos using a secreted luciferase.Proc Natl Acad Sci USA1995,92:1317–1321. 20. Keyaerts M, Caveliers V, Lahoutte T:Bioluminescence imaging: looking
beyond the light.Trends Mol Med2012,18:164–172.
21. Venisnik KM, Olafsen T, Gambhir SS, Wu AM:Fusion of Gaussia luciferase to an engineered anti-carcinoembryonic antigen (CEA) antibody for in vivo optical imaging.Mol Imaging Biol2007,9:267–277.
22. Hustinx R, Shiue CY, Alavi A, McDonald D, Shiue GG, Zhuang H, Lanuti M, Lambright E, Karp JS, Eck SL:Imaging in vivo herpes simplex virus thymidine kinase gene transfer to tumour-bearing rodents using positron emission tomography and.Eur J Nucl Med2001,28:5–12. 23. Auricchio A, Acton PD, Hildinger M, Louboutin JP, Plössl K, O'Connor E,
Kung HF, Wilson JM:In vivo quantitative noninvasive imaging of gene transfer by single-photon emission computerized tomography.Hum Gene Ther2003,14:255–261.
24. Min JJ, Chung JK, Lee YJ, Shin JH, Yeo JS, Jeong JM, Lee DS, Bom HS, Lee MC: In vitro and in vivo characteristics of a human colon cancer cell line, SNU-C5N, expressing sodium-iodide symporter.Nucl Med Biol2002, 29:537–545.
25. Xavier C, Vaneycken I, D'huyvetter M, Heemskerk J, Keyaerts M, Vincke C, Devoogdt N, Muyldermans S, Lahoutte T, Caveliers V:Synthesis, preclinical validation, dosimetry, and toxicity of 68Ga-NOTA-anti-HER2 nanobodies for iPET imaging of HER2 receptor expression in cancer.J Nucl Med2013, 54:776–784.
doi:10.1186/s13550-014-0032-8
Cite this article as:Goethalset al.:Camelid reporter gene imaging: a generic method forin vivocell tracking.EJNMMI Research20144:32.
Submit your manuscript to a
journal and benefi t from:
7Convenient online submission 7Rigorous peer review
7Immediate publication on acceptance 7Open access: articles freely available online 7High visibility within the fi eld
7Retaining the copyright to your article