Copyright © The Author(s).All Rights Reserved. Published by American Research Institute for Policy Development DOI: 10.15640/arms.v6n2a4 URL: https://doi.org/10.15640/arms.v6n2a4
The Gompertz Inverse Pareto Distribution and Extreme Value Theory
Shakila Bashir
1& Itrat Batool Naqvi
2Abstract
The Gompertz inverse Pareto (GoIP) distribution is derived using Gompertz G generator by introducing two new parameters. Some basic statistical properties of the model derived and discussed in details. The model parameter estimated using maximum likelihood estimation method. Moreover, the upper record values from the Gompertz inverse Pareto distribution are introduced and some properties have been discussed. Finally, simulation has been carried out form GoIP distribution and random numbers of 50 size are generated with a sample of size 15. Then the upper record has been noted among them and numerical values of the averages, dispersions of the upper records from GoIP have been presented.
Keywords: Gompertz family of distributions; inverse Pareto; MLE; GoIP; record values 1.Introduction:
In many real life situations, the classical distributions do not provide adequate fit to some real data sets. Thus, researchers introduced many generators by introducing one or more parameters to generate new distributions. The new generated distributions are more flexible as compare to the classical distributions. Some well-known generators are
Marshal-Olkin generated family (MO-G) (Marshall and Olkin, 1997), the Beta-G by Eugene et al. (2002) and Jones (2004), Kumaraswamy-G (Kw-G for short) by Cordeiro and de Castro (2011) and McDonald-G (Mc-G) by Alexander et al. (2012), gamma-G (type 1) by Zografos and Balakrishnan (2009), gamma-G (type 2) by Risti´c and Balakrishnan (2012), gamma-G (type 3) by Torabi and Hedesh (2012) and log gamma-G by Amini et al. (2012), Exponentiated generalized-G by Cordeiro et al. (2011), Transformed-Transformer (T-X) by Alzaatreh et al. (2013) and Exponentiated (T-X) by Alzaghal et al. (2013), Weibull-G by Bourguignon et al. (2014) and Exponentiated half logistic generated family by Cordeiro et al. (2014).Ghosh et al. (2016) introduced a new generator of continuous distributions with two extra parameters called the Gompertz-G generator and studied some general mathematical properties of it.
In this article the Gompertz family of distribution is considered to develop a new model. It has been already used by Alizadeh et al. (2017), and Abdal-Hameed, Khaleel, Abdullah, Oguntunde, Adejumo and Oguntunde et al. (2018). The cumulative distribution function (cdf) and probability density function (pdf) of the Gompertz family of distributions is
1 1 1 G x ; 0, 0.
F x e
(1)
1 1 1 1
e
G x;
0,
0.
f x
g x
G x
(2)Where
and
are extra shape parameters and the cdf in eq. (1) and eq. (2) was developed using the following transformation:
log 1 0
( )
G x
F x w t dt
w t
is the probability density function (pdf) of the Gompertz distribution and t is a random variable.G x
and
g x
are the cdf and pdf of the baseline distribution. The probability density function (pdf) of the Pareto distribution is
10,
0
.
f x
x
x
(3) Where,
is scale and
is shape parameter.An observation is called a record values if its value is greater than (less than) all the preceding observations. Records values theory has wide application in the fields of studies such as climatology, sports, science, engineering, medicine, traffic, and industry, among others. For example, if we consider the weighing of objects on a scale missing its spring. An object is placed on this scale and its weight is measured. The needle indicates the correct value but does not return to zero when the object is removed. If various objects are placed on the scale and only the weights greater than the previous ones can be recorded. Then these recorded weights are the record value sequence. The development of the general theory of statistical analysis of record values began with the work of Chandler (1952). Further work done by, Foster and Stuart (1954), Renyi (1962), Resnick (1973), Nayak (1981), Dunsmore (1983), Gupta (1984), Houchens (1984), Ahsanullah (1978, 1979, 1980, 1981, 1982, 1987, 1988, 1991, 1995, 2004, 2006), Ahmadi et al. (2005), Ahsanullah and Aliev (2008) and Balakrishnan et al. (2009), Ahsanullah et al. (2010) and many more. The pdf of the sequence of upper record values
X
U n ,
n
1
is
1
,
.
n
n
R x
f
x
f x
x
n
(4)where, R x
ln 1 F x
. 2.Gompertz Inverse Pareto DistributionIn this section, we derived the inverse Pareto distribution using the pdf in eq. (3) first and then the Gompertz inverse Pareto distribution is developed. The pdf of the inverse Pareto (IP) is derived by transferring eq. (3) with pdf
11
,
0,
0,
0
.
g x
x
x
(5)And the cdf of the IP distribution is
1
,
0,
0,
0
G x
x
x
(6)The cdf and pdf of the GoIP distribution is derived by substituting eq. (5) and eq. (6) in eq. (1) and eq. (2),
1 1
1 x
F x e
(7)
1 1 1
1
1
1
x,
, , ,
0,
0
.
f x
x
x
e
x
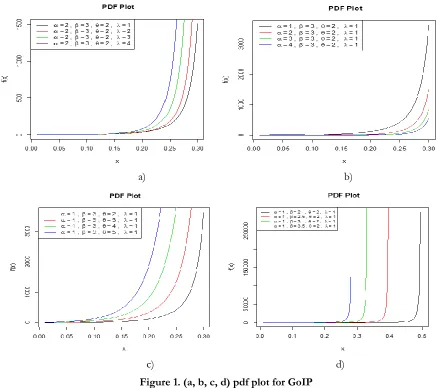
(8)a) b)
c) d) Figure 1. (a, b, c, d) pdf plot for GoIP 2.1. Some Basic Properties of the Gompertz Inverse Pareto Distribution
In this section some reliability measures of the GoIP have been derived. The reliability function of the GoIP distribution is
1 1
x
R x e
(9) The hazard rate function of the GoIP distribution is
11
1
h x x x
(10)
The graphs of the reliability function and hazard rate function of the GoIP are given in figure 3 and 4. The reversed hazard rate function of the GoIP distribution is
1 1 1
1
1 1
1
1
x
x
x
x
e
r x
e
The odds function of the GoIP distribution is
1 1
1 1
1 x
x
e O x
e
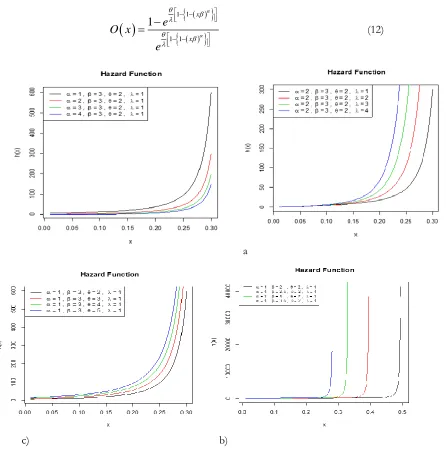
(12)
a b)
c) b)
Figure 2. (a, b, c, d). Plots for hazard rate function of GoIP 2.2. Quantile Function and Median
In this section the median and quantile function is derived.
1
Q u
F
u
, where U is Uniform (0,1).The quantile function of the GoIP distribution is
1 1
1
1
1
ln 1
Q u
u
(13)
Random numbers for GoIP distribution can be generated using eq. (13). The median of the GoIP distribution is
1 1
1
1
1
ln 0.5
median
2.3. Estimation
The method of maximum likelihood estimation (MLE) is used to estimate the parameters of the GoIP distribution. Let x x1, 2,....,xnbe the random samples distributed GoIP with pdf given in eq. (8),
1 1 1
1 1 2
1
,
,...,
; , , ,
1
n
x n
i
L x x
x
x
x
e
1 1 1ln
, , ,
log
log
log
1
log
1
log 1
1
1
n i i
n n
i i
L
n
n
n
x
x
x
(15)
1
, , ,
1
1
1
n
i
L
n
x
(16)
1 1
, , , log
log log 1
1
n n
i i
i i
L n x x
n x x
(17)
2
1 1 1
, , ,
1
log
1
1
log 1
n n n
i i i
L
x
x
x
x
(18)1 ˆ
n
x
(19) 3. Order StatisticsThe pdf of the rth order statistics from the GoIP distribution is
1 1
1 1 1 1
1 1
:
! 1
1 1 , 0 .
1 ! !
r n r
x x
r n
n
f x x x e e x
r n r
(20)
The pdf of minimum and maximum order statistics from GoIP distribution is
1 1 1
1 1:
1
1
,
0
.
n
x
n
f
x
n
x
x
e
x
(21)
1
1 1 1 1
1 1
n:
1
1
1
,
0
.
n
x x
n
f
x
n
x
x
e
e
x
(22)4.Record Values
If the upper record values
X
U 1,
X
U 2,...,
X
U n arise from GoIP distribution then the pdf of the upper record values from Gompertz inverse Pareto (UR-GoIP) distribution is derived using eq. (8) in eq. (4), we get
1
1
1 1
1
1
1
1
exp
1
1
0
.
n n
n n
f
x
x
x
x
x
x
n
(23)The cdf of the UR-GoIP distribution is
1
,
n
x
F x
n
n
The survival function the UR-GoIP distribution is
1
,
n
x
S
x
n
n
(25) The hazard rate function of the UR-GoIP distribution is
1 1
1
1
1
1
exp
1
1
,
n n
n
x
x
x
x
h
x
x
n
(26)Where, x 1
1
x
,
1
10
, ,
x
a t a t
x
a x t e dt and a x t e dt
are the lowerincomplete gamma and upper incomplete gamma functions respectively. The relationship between pdf and cdf of GoIP is
1
1
1 1
f x x x F x
(27) and,
11
1
1
f x
F x
x
x
(28)Theorem 1: If a sequence of upper record values
X
U 1,
X
U 2,...,
X
U n , n > 1, arise from the GoIP distribution given in eq. (8), then 1
1
1
1
1
1
r r r r
U n U n U n U n U n U n
r
E X
X
E X
X
E X
E X
r
(29)Proof: Consider the pdf of UR-GoIP in eq. (23),
1
1
0
1
1
1
ln 1
nr r
U n U n
E X
X
x
x
F x
f x dx
n
Using the relation of given in eq. (27), then in eq. (28) and simplifying it the results in eq. (3) is obtained.
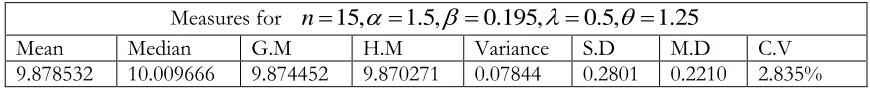
4.1. Simulations: Random numbers of size 50 are generated taking a sample of 15, using the R software. From these results the upper records have been noted and we get the mean, median, geometric mean (G.M), harmonic mean (H.M), variance, standard deviation (S.D), mean deviation (M.D), and coefficient of variation (C.V) of the UR-GoIP distribution.
Table 1: descriptive measures for UR-GoIP distribution Measures for n15,
1.5,
0.195,
0.5,
1.25Mean Median G.M H.M Variance S.D M.D C.V
9.878532 10.009666 9.874452 9.870271 0.07844 0.2801 0.2210 2.835%
5.Conclusion
cdf, survival function, hazard rate function, reversed hazard rate function, odds function median, quantile function have been derived. Parameters of the GoIP distribution are estimated by MLE. Order statistics for GoIP distribution have been introduced. Graphs of the pdf and hazard rate function of the GoIP distribution are presented. From figure 1(a, b, c, d), it can be seen that the shape of distribution is extremely left skewed. From figure 2 (a, b, c, d) it can be seen that the shape of the hazard rate function of the GoIP distribution is increasing bathtub (IBT) shape. Moreover, the upper record values have developed form GoIP distribution. Properties of the UR-GoIP distribution including cdf, survival function, hazard rate function, and recurrence relation for single moments for the UR-GoIP distribution have been derived. Finally, a simulation study has been done. Random numbers of size 50 has been generated with a sample of size 15. The upper records have been noted and some measures have been calculated numerically.
Reference
Abdal-Hameed, M., et al. (2018). Parameter estimation and reliability, hazard functions of Gompertz Burr Type XII distribution. Tikrit Journal for Administration and Economics Sciences, 1(41 part 2), 381–400.
Ahsanullah, M. (1978). Record values and the exponential distribution. Annals of Institute of Statistical Mathematics, 30, A, 429-433.
Ahsanullah, M. (1979). Characterization of the exponential distribution by record values, Sankhya, 41, B, 116-121. Ahsanullah, M. (1982). Characterizations of the exponential distribution by some properties of record values,
StatisticheHefte, 23, 326-332.
Ahsanullah, M. (1988). Introduction to Record Statistics, Ginn Press, Needham Height, MA.
Ahsanullah, M. (1980). Linear prediction of record values for the two parameter exponential distribution, Annals of Institute of Statistical Mathematics, 32, A, 363-368.
Ahsanullah, M. (1981). Record values of the exponentially distributed random variables, StatisticheHefte, 22, 121-127.
Ahsanullah, M. (1987). Two characterizations of exponential distribution, Communications in Statistics Theory-Methods, 16, 375-381.
Ahsanullah, M. (1991). Some characteristic properties of the record values from the exponential distribution, Sankhya, 53, B, 403-408.
Ahsanullah, M. (1995). Record Statistics, Nova Science Publishers Inc., New York, NY.
Ahsanullah, M. (2004). Record Values-Theory and Applications, University Press of America, Lanham, MD.
Ahsanullah, M. (2006). The generalized order statistics from exponential distribution by record values, Pakistan Journal of Statistics, 22, 121-128.
Ahsanullah, M., and Aliev, F. (2008). Some characterizations of exponential distribution by record values, Journal of Statistical Research, 2, 11-16.
Ahsanullah, M., Hamedani, G.G. and Shakil, M. (2010). Expanded version of ‘On record values of Univariate exponential distribution’, Technical Report, MSCS, Marquette University.
Alexander, C., Cordeiro, G.M., Ortega, E.M.M., and Sarabia, J. M. (2012). Generalized beta- generated distributions. Computational Statistics & Data Analysis, 56, 1880-1897
Alizadeh, M., Cordeiro, G. M., Bastos Pinho, L. G., & Ghosh, I. (2017). The Gompertz-g family of distributions. Journal of Statistical Theory and Practice, 11(1), 179–207. doi:10.1080/15598608.2016.1267668
Alzaatreh, A., Lee, C. and Famoye, F. (2013). A new method for generating families of continuous distributions. Metron, 71, 63-79.
Alzaghal, A., Famoye, F. and Lee, C. (2013). Exponentiated T-X family of distributions with some applications. International Journal of Statistics and Probability, 2, 1-31.
Amini, M., Mir Mostafaee, S.M.T.K. and Ahmadi, J. (2012). Log-gamma-generated families of distributions. Statistics, 1, 1-20.
Balakrishnan, N., Doostparast, M. and Ahmadi, J. (2009). Reconstruction of past records, Metrika, 70, 89-109. Bourguignon, M., Silva, R. B., & Cordeiro, G. M. (2014). The Weibull-G family of probability distributions. Journal of
Data Science, 12, 53–68.
Chandler, K.N. (1952). The distribution and frequency of record values, Journal of
Cordeiro, G.M. and de Castro, M. (2011). A new family of generalized distributions. Journal of Statistical Computation and Simulation, 81, 883-898.
Cordeiro, G.M., Ortega, E.M.M. and Silva, G.O. (2011). The Exponentiated generalized gamma distribution with application to lifetime data. Journal of statistical computation and simulation, 81, 827-842
Dunsmore, I.R. (1984). The future occurrence of records, Annals of Institute of Statistical Mathematics, 35, 267-277. Eugene, N., Lee, C. and Famoye, F. (2002). Beta-normal distribution and its applications. Communications in
Statistics - Theory and Methods, 31, 497-512.
Foster, F.G. and Stuart, A. (1954). Distribution free tests in time series based on the breaking of records, Journal of Royal Statistical Society, B,16, 1-22
Ghosh et al. (2016). The Gompertz-G family of distributions, Journal of Statistical Theory and Practice 11(1), 179– 207. http://dx.doi.org/10.1080/15598608.2016.1267668
Gupta, R.C. (1984). Relationships between order statistics and record values and some characterization results, Journal of Applied Probability, 21, 425-430.
Houchens, R.L. (1984). Record Value Theory and Inference, PhD Dissertation, University of California, Riverside, California.
Jones, M.C (2004). Families of distributions arising from distributions of order statistics. Test, 13, 1-43.
Marshall, A.W. and Olkin, I. (1997). A new method for adding a parameter to a family of distributions with application to the exponential and Weibull families. Biometrika, 84, 641-652.
Nayak, S.S. (1981). Characterizations based on record values, Journal of Indian Statistical Association, 19, 123-127. Renyi, A. (1962). Theorie des elements saillantsd’unesuit d’observations, Colloquium Combinatorial Methods of
Probability Theory, Aarhus University, 104-115.
Resnick, S.I. (1973). Record values and maxima, Annals of Probability, 1, 650-662.
Risti ́c, M.M. and Balakrishnan, N. (2012). The gamma-Exponentiated exponential distribution. Journal of Statistical Computation and Simulation, 82, 1191-1206.
Royal Statistical Society, B, 14, 220-228.
Torabi, H. and Hedesh, N. M. (2012). The gamma-uniform distribution and its applications. Kybernetika, 1, 16-30. Zografos, K. and Balakrishnan, N. (2009). On families of beta- and generalized gamma- generated distributions and