VOLUME 41, ARTICLE 23, PAGES 649
-
678
PUBLISHED 5 SEPTEMBER 2019
https://www.demographic-research.org/Volumes/Vol41/23/ DOI: 10.4054/DemRes.2019.41.23
Research Article
When richer doesn’t mean thinner: Ethnicity,
socioeconomic position, and the risk of child
obesity in the United Kingdom
Alice Goisis
Melissa Martinson
Wendy Sigle
© 2019 Alice Goisis, Melissa Martinson & Wendy Sigle.
This open-access work is published under the terms of the Creative Commons Attribution 3.0 Germany (CC BY 3.0 DE), which permits use, reproduction, and distribution in any medium, provided the original author(s) and source are given credit.
1 Background 650
2 Materials and methods 653
3 Analytical sample 653
4 Variables 654
4.1 Ethnicity 655
4.2 Socioeconomic disparities 655
4.3 Health behaviours 656
5 Method 657
6 Results 657
7 Sensitivity analyses 663
7.1 Different categorizations of income or socioeconomic position 663
7.2 Alternative measures of unhealthy weight 664
7.3 Ethnicity 664
8 Conclusions 665
9 Acknowledgements 668
References 669
When richer doesn’t mean thinner: Ethnicity, socioeconomic
position, and the risk of child obesity in the United Kingdom
Alice Goisis1
Melissa Martinson2
Wendy Sigle3
Abstract
BACKGROUND
A range of studies report a robust association between family socioeconomic position and the prevalence of child overweight/obesity. On average, children from poorer backgrounds are more likely to be overweight/obese than children from more advantaged families. However, a small number of US studies have shown that, for ethnic minority children, the association is either nonexistent or reversed.
OBJECTIVE
We test if the link between socioeconomic position and child overweight/obesity at age 7 is heterogeneous in the United Kingdom where rates of obesity are particularly high for some groups of ethnic minority children.
METHODS
We use nationally representative data from the UK Millennium Cohort Study as well as descriptive analyses and logistic regression models.
RESULTS
Poorer White children are at higher risk of overweight/obesity than higher income White children. However, socioeconomic disparities are reversed for Black African/Caribbean children and nonexistent for children of Indian and Pakistani/Bangladeshi origin. Moreover, the health behaviours that explain socioeconomic disparities in child overweight/obesity for the White group appear to be irrelevant in explaining differences by socioeconomic position for the Black Caribbean and African groups.
1 Department of Social Policy, London School of Economics and Political Science, London, UK; Max Planck
Institute for Demographic Research, Rostock, Germany; Centre for Longitudinal Studies, Department of Social Science, University College London, United Kingdom. Email:[email protected].
CONCLUSIONS
We should be careful in assuming that higher socioeconomic position is protective against child overweight/obesity for all groups of the population.
CONTRIBUTION
This study shows for the first time important variation by ethnicity in the link between socioeconomic position and child overweight/obesity – and in the underlying mechanisms linking them – in the United Kingdom.
1. Background
In the United Kingdom over the last two decades, overweight and obesity (hereafter referred to as overweight/obese) have become increasingly common in children. Amongst a cohort of UK children born around the year 2001, 20% were categorized as being overweight/obese at around age 5 and 26% at around age 11 (Goisis, Sacker, and Kelly 2016). As overweight/obesity has become a prominent health issue and target for policy intervention, it is now also a major focus of research (Griffiths et al. 2010b; HM Government 2016; Public Health England 2018). Studies have shown that the prevalence of overweight/obesity is not uniformly distributed across UK population subgroups. For example, a range of studies report a robust association between family socioeconomic position and the prevalence of child overweight/obesity. Children from poorer backgrounds are, on average, more likely to be overweight/obese than children from more advantaged families (Griffiths et al. 2010a). This finding has been attributed to the fact that children from poorer backgrounds are exposed to poorer maternal health behaviours during the antenatal and postnatal periods, and they tend to have worse dietary patterns and lower levels of physical activity during childhood (Goisis, Sacker, and Kelly 2016). Evidence also suggests that children of Black African, Black Caribbean, Pakistani, and Bangladeshi parents in the United Kingdom have higher rates of overweight/obesity than children of White parents (Hawkins et al. 2009; Massion et al. 2016; Zilanawala et al. 2015)4 and that children in these ethnic groups tend to be
more socioeconomically disadvantaged than White children (Hills et al. 2010). Based on the available evidence, one might hypothesize that these ethnic minority children experience higher rates of overweight/obesity than White children because of their
4 These studies are based on the UK Millennium Cohort Study. For example, in the Massion et al. (2016)
socioeconomic disadvantage, and the relatively poorer diets and physical activity patterns associated with it.
However, evidence from some previous research suggests this interpretation of the disparities in overweight/obesity may be problematic. A few studies in the United States have shown that for Hispanic and African American children, the socioeconomic disparities in child overweight/obesity are either nonexistent or reversed compared to what is observed for White children (Gordon, Chase-Lansdale, and Brooks-Gunn 2004; Martinson, McLanahan, and Brooks-Gunn 2012; Odgen et al. 2010; Van Hook and Stamper Balistreri 2007). One UK study (Martinson, McLanahan, and Brooks-Gunn 2012) revealed a reversed association between socioeconomic position and overweight/obesity for children of Black African and Caribbean mothers; higher income was associated with a higher risk of overweight/obesity. This suggests that for children from some ethnic groups the higher risk of overweight is not due to their lower socioeconomic position (Gordon, Chase-Lansdale, and Brooks-Gunn 2004).
This literature, so far, has focused on investigating whether the association between socioeconomic position and child overweight/obesity varies across ethnic groups. Less attention has been given to why such differences exist and whether within certain ethnic groups lower socioeconomic position is or is not associated with health behaviours that are, on average, closely associated with child overweight/obesity in the United Kingdom. In particular, the prior literature has not tested whether or not the health behaviours that explain socioeconomic disparities in overweight/obesity in White children are equally important for explaining socioeconomic disparities amongst children from other ethnicities.
One could hypothesize that the link between socioeconomic position and health behaviours is heterogeneous across ethnic groups by appealing to theories developed in the immigration and health literature. This field is particularly relevant to understanding variation in wellbeing among diverse ethnic groups in the United Kingdom where a substantial proportion are first or second generation immigrants (Algan et al. 2010).5
For example, this literature suggests that within some immigrant groups a lower socioeconomic position does not necessarily equate to an obesogenic diet since it might be associated with more traditional diet and food preparation; conversely, a higher socioeconomic position might be associated with less traditional dietary patterns and the consumption of more energy dense food (Gilbert and Khokhar 2008). Similarly, immigrant groups might differ in their ideas of what is healthy or desirable food (McEwen, Straus, and Croker 2009). These hypotheses are motivated by the fact that in many poorer countries the association between dietary patterns (which have been found to be associated with overweight/obesity), overweight/obesity and socioeconomic
5 Based on own calculations on the Millennium Cohort Study, over 70% of ethnic minority mothers are
position is reversed compared to what is observed in more economically developed countries. For example, in many low- and middle-income countries, where a higher weight (for both the parents and for their children) tends to be associated with wealth and economic success, children from more advantaged families are more likely to have a higher body mass index (BMI) than children from disadvantaged families (Martinson, McLanahan, and Brooks-Gunn 2012; Monteiro et al. 2004; Van Hook and Stamper Balistreri 2007). Indeed, evidence from the United States shows that the reversed association between socioeconomic position and child overweight/obesity persists after more advantaged parents from poorer countries have settled in the United States (Van Hook and Stamper Balistreri 2007).
2. Materials and methods
This paper uses data from the Millennium Cohort Study (MCS), a nationally representative prospective cohort study of children born in 19,244 families in 2000– 2002 (Hansen 2008). The sample population was drawn from all live births in the United Kingdom from September 2000 in England and Wales and 1 December 2002 in Scotland and Northern Ireland. The sample was selected from a random sample of electoral wards with a stratified sampling strategy to ensure adequate representation of all four UK countries, disadvantaged and – importantly for this study – ethnically diverse areas. The first Sweep was collected when the cohort children were around 9 months and the subsequent five Sweeps were collected at intervals of roughly two or three years. Weights are used throughout the analyses to account for survey design and attrition.6
The MCS collects information on families’ socioeconomic position, children’s overweight/obesity, markers of diet, and physical activity at different points of their life course that allow us to begin to unpack and explain interethnic variations in the relationship between income and child overweight/obesity. The analyses focus on Sweep 4 of the MCS, which was collected when cohort members (CMs) were around 7 years of age. We focus on this Sweep since it is collected after most children have experienced the adiposity rebound, the second rise in body mass index which typically takes place between ages 3–6 (Williams 2005), but the children are young enough that the family environment is still very important in determining children’s health behaviours.
3. Analytical sample
We excluded cases with missing values on overweight/obesity (n = 225), on family income (n = 20) and on any of the health behaviours considered (n = 1,791) at Sweep 4, which was collected when the cohort child was around 7 years old. We also excluded cases where the cohort member’s mother was not the main interviewee (n = 516) at Sweep 1 (when the mothers’ ethnicity and her antenatal and postnatal behaviours were collected). We also excluded multiple births (n = 175) and children who at age 7 were
6 As an additional robustness check, we used multiple imputations to create ten ‘filled-in’ data sets by
underweight (n = 141).7 Some observations satisfied more than one criterion. The
baseline sample at Sweep 4 was 13,857 and we ended up with a total sample of 11,331 observations (82%). The majority of mothers in our analytical sample were White (89%).
4. Variables
In the MCS, trained interviewers measured children’s height and weight using standardized protocols (Hawkins, Cole, and Law 2007). We define our dependent variable – overweight/obesity – using the International Obesity Taskforce (IOTF) cut-offs for BMI, which are age and sex specific and based on growth curves in several countries including Great Britain (Cole et al. 2000). BMI is expressed as weight in kilograms divided by the square of height in meters (BMI: kg/m2). To create the IOTF
offs for BMI, children are considered overweight if their BMI matches up with cut-offs that closely match the adult BMI cut-cut-offs for overweight and obesity (BMI ≥ 25) according to the BMI centile curves.
Comparing the prevalence of overweight/obesity between children belonging to different ethnic groups could be complicated by the fact that the expected proportion of body fat in individuals from different ethnic groups might vary at similar levels of BMI (Freedman et al. 2008). Since these differences vary for BMI-for-age (Freedman et al. 2008), we do not develop ethnicity-specific BMI cut-off points to identify equivalent levels of body fat but rather, in the sensitivity analyses, we replicated the analyses using other outcome variables available in Sweep 4 of the MCS: continuous BMI, waist circumference, and percentage body fat (also collected by a trained interviewer using standard protocols). We create binary indicators and categorize children as being above the 85th percentile of body fat and waist circumference. To set the 85th percentile
cut-offs necessary to create these variables, we tabulated body fat and waist circumference by age of the cohort member at interview, the cohort member sex and using the sampling weights provided in Sweep 4 of the MCS. We therefore use nationally representative age and sex adjusted cut-offs.
7 The prevalence of underweight ranged between 0.47% for children of Black African/Caribbean mothers to
4.1 Ethnicity
To explore interethnic variation in socioeconomic disparities in child overweight/obesity, we divide respondents into four ethnic groups, based on the mother’s ethnicity, reported at Sweep 1. The groups are White, Indian, Pakistani and Bangladeshi, and Black Caribbean and Black African. Ideally, we would have analysed each ethnic group separately because of their different migration and settlement histories in the United Kingdom and different cultural practices. However, the small number of observations for detailed ethnic groups made this approach impossible. Since the prevalence of child overweight/obesity and cultural practices including diets have not been found to vary substantially between Pakistani/Bangladeshi or Black African/Caribbean children (Zilanawala et al. 2015), we analysed them together.
4.2 Socioeconomic disparities
To measure socioeconomic disparities in child obesity and overweight, we use quintiles of family income obtained using the modified OECD scale which adjusts family income by household size (OECD 2013). As previous studies have shown (Feng et al. 2016), the ethnic minority families are more clustered in the lower income quintiles than White families and the distribution is particularly skewed for the Pakistani/Bangladeshi group. As a result, there are not enough observations to analyse those with top quintile income within each ethnic group. Thus, we created a binary indicator and categorized families as lower income if they belong to the bottom two quintile groups and higher income if they belong to the top three income quintile groups. For ease of exposition, throughout the paper, we refer to socioeconomic differences or disparities although, strictly speaking, we are analysing income differences in child obesity/overweight.
is a more important predictor than poverty status in predicting adolescent overweight, it is unclear whether these arguments would hold if the results were stratified by race/ethnicity.
4.3 Health behaviours
We focus on 13 health behaviours, grouped in three categories, capturing broad aspects of the family environment in which children are developing and which have been identified in previous studies as significantly associated with child overweight/obesity (Goisis, Sacker, and Kelly 2016). These three categories are: mother’s health-related behaviours, children’s physical activity levels, and children’s diet. We focus on the behavioural factors through which variables such as stress, family economic status, and time resources etc. operate to influence the risk of child overweight/obesity. These health behaviours are broadly defined and capture decisions parents take in regards to their own health behaviours, children’s diets and physical activity but also health constraints dictated by the school and neighbourhood environment.
behaviours were collected at Sweep 4 (when the cohort members were around 7 years old).
5. Method
Our analytic strategy is carried out in three stages. First, we inspect socioeconomic differences in child overweight/obesity by ethnicity in the United Kingdom. Second, we analyse, separately for each ethnic group, socioeconomic differences for 13 health behaviours which previous research shows to be relevant to explain overall socioeconomic disparities in child overweight/obesity (Goisis, Sacker, and Kelly 2016). Third, we estimate a series of logistic regression models to examine socioeconomic disparities in child overweight/obesity within each ethnic group (with an adjustment for the child’s sex) before and after controlling for the health behaviours. Finally, we show a series of sensitivity analyses exploring whether the results are robust to different categorizations of income, ethnicity, and unhealthy weight. We also explore variations by the cohort child’s sex.
6. Results
intervals are wide (95% CI: 0.46 to 1.34). Children of Black African/Caribbean mothers show a marked and statistically significant reversal with a risk ratio of 0.63 (95% CI: 0.44 to 0.85). The Pakistani/Bangladeshi group falls in between these groups with a risk ratio of 0.79 (95% CI: 0.35 to 1.2), but as for the Indian group, the confidence intervals are wide.
Table 1: Percentage of cohort members obese/overweight at Sweep 4 (age 7) and ratio (lower income/higher income groups, with 95% CI), by ethnic and income groups
White Indian Pakistani and
Bangladeshi
Black African and Caribbean
Average across all groups
Bottom and second quintiles 20.87% 21.77% 20.87% 26.88% 21.13%
Third, fourth, top quintiles 18.39% 24.31% 26.57% 42.45% 19.09%
Ratio 1.13 0.90 0.79 0.63 1.11
[95% CI] [1.02;1.25] [0.46;1.34] [0.35;1.20] [0.44;0.85] [1.01;1.21]
Average 19.24% 23.39% 21.81% 33.92% 19.85%
Number of observations 10,116 283 618 314 11,331
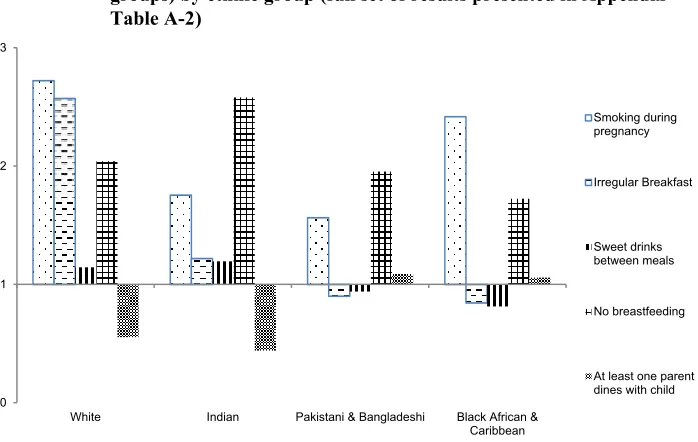
differences by socioeconomic position are reversed (e.g., introduction to solid food and mother’s overweight/obesity). Overall, the results show that lower socioeconomic position is consistently associated with higher risk health behaviours for White mothers and children; in contrast, the correspondence between lower socioeconomic position and these health behaviours is not as clear for Indian, Pakistani/Bangladeshi, and Black African/Caribbean ethnic families – either because the link is weaker or is reversed compared to Whites.
Figure 1: Risk ratios in health behaviours (lower income/higher income groups) by ethnic group (full set of results presented in Appendix Table A-2)
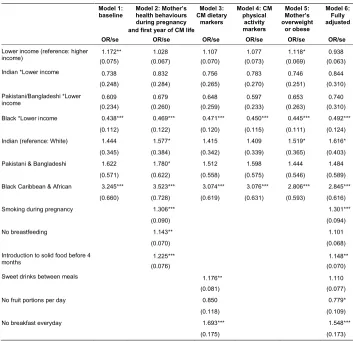
Table 2 presents a series of logistic regression models, which bring together the findings and insights of the descriptive analyses.8 For ease of interpretation, Figure 2
shows the risk ratios of the predicted probabilities of child overweight/obesity obtained from each Model with 95% confidence intervals. Model 1 shows the unadjusted socioeconomic differentials in child overweight and obesity within ethnic groups and whether the differences are statistically significant. Models 2 through 5 illustrate the role that each category of covariates (i.e., ante and postnatal markers, dietary markers,
8 An interaction term between the ethnic minority indicator and low income below 1 indicates that within that
particular group a lower income has a protective effect against the odds of overweight/obesity compared to what we observe for the White group.
0 1 2 3
White Indian Pakistani & Bangladeshi Black African & Caribbean
Smoking during pregnancy
Irregular Breakfast
Sweet drinks between meals
No breastfeeding
physical activity markers, mother’s overweight/obese) has in attenuating or explaining socioeconomic differences in child overweight/obesity within each ethnic group, by adjusting for each category separately. We adjust for each category separately because the results in Appendix Table A-2 indicate that the health behaviours may operate differently within the different ethnic groups. Then, to assess to what extent the socioeconomic differences are attenuated when all the health behaviours associated with child overweight/obesity are considered, Model 6 adjusts for all covariates simultaneously.
Table 2: Logistic regression model on cohort member (CM) being
overweight/obese at age 7 (Sweep 4) by ethnic and income groups
Model 1:
baseline Model 2: Mother’shealth behaviours during pregnancy and first year of CM life
Model 3: CM dietary
markers
Model 4: CM physical activity markers Model 5: Mother’s overweight or obese Model 6: Fully adjusted
OR/se OR/se OR/se OR/se OR/se OR/se
Lower income (reference: higher
income) (0.075)1.172** (0.067)1.028 (0.070)1.107 (0.073)1.077 (0.069)1.118* (0.063)0.938
Indian *Lower income 0.738 0.832 0.756 0.783 0.746 0.844
(0.248) (0.284) (0.265) (0.270) (0.251) (0.310)
Pakistani/Bangladeshi *Lower
income (0.234)0.609 (0.260)0.679 (0.259)0.648 (0.233)0.597 (0.263)0.653 (0.310)0.740
Black *Lower income 0.438*** 0.469*** 0.471*** 0.450*** 0.445*** 0.492***
(0.112) (0.122) (0.120) (0.115) (0.111) (0.124)
Indian (reference: White) 1.444 1.577* 1.415 1.409 1.519* 1.616*
(0.345) (0.384) (0.342) (0.339) (0.365) (0.403)
Pakistani & Bangladeshi 1.622 1.780* 1.512 1.598 1.444 1.484
(0.571) (0.622) (0.558) (0.575) (0.546) (0.589)
Black Caribbean & African 3.245*** 3.523*** 3.074*** 3.076*** 2.806*** 2.845***
(0.660) (0.728) (0.619) (0.631) (0.593) (0.616)
Smoking during pregnancy 1.306*** 1.301***
(0.090) (0.094)
No breastfeeding 1.143** 1.101
(0.070) (0.068)
Introduction to solid food before 4
months 1.225*** 1.148**
(0.076) (0.070)
Sweet drinks between meals 1.176** 1.110
(0.081) (0.077)
No fruit portions per day 0.850 0.779*
(0.118) (0.109)
No breakfast everyday 1.693*** 1.548***
Table 2: (Continued)
Model 1: baseline
Model 2: Mother’s health behaviours during pregnancy and first year of CM life
Model 3: CM dietary
markers
Model 4: CM physical activity markers Model 5: Mother’s overweight or obese Model 6: Fully adjusted
OR/se OR/se OR/se OR/se OR/se OR/se
No evening meal with parents 0.851** 0.860**
(0.067) (0.065)
Less than weekly sport/physical
activity 1.104 1.020
(0.074) (0.071)
Less than weekly active playing
with parents 1.196*** 1.140**
(0.077) (0.073)
No regular bedtime 1.072 1.000
(0.094) (0.094)
Parent takes child to the park less
than weekly 0.913 0.889*
(0.058) (0.056)
Screen time more than 1 hour per
day 1.317*** 1.209**
(0.119) (0.111)
Mother is overweight or obese 2.414*** 2.360***
(0.139) (0.135)
Girl 1.408*** 1.432*** 1.387*** 1.410*** 1.420*** 1.420***
(0.081) (0.083) (0.080) (0.081) (0.081) (0.083)
Constant 0.189*** 0.162*** 0.188*** 0.145*** 0.122*** 0.094***
(0.009) (0.010) (0.010) (0.014) (0.007) (0.010)
Number of observations 11,331
Note: *** p<0.01, ** p<0.05, * p<0.1. An interaction term between the ethnic minority indicator and low income below 1 indicates that within that particular group a lower income has a protective effect against the odds of overweight/obesity compared to what we observe for the White group.
Pakistani/Bangladeshi, and Black African/Caribbean groups are largely unchanged in each model specification. In particular, the fully adjusted results (Model 6) show that socioeconomic disparities within the Black African/Caribbean group are still reversed compared to the White group and, despite the fairly small sample size, statistically significant at conventional levels. When the model includes controls for the 13 health behaviours (Model 6), socioeconomic disparities within the White group are reversed and no longer statistically significant at conventional levels, suggesting that poorer health behaviours are a potentially important explanatory factor for this group. The results therefore show that the ‘usual suspects’ of overweight/obesity appear to mediate socioeconomic disparities for White children, while these health behaviours are not relevant for explaining socioeconomic differences in overweight/obesity among children from other ethnic backgrounds.
Figure 2: Risk ratios (lower income/higher income groups with 95% CI) of the predicted probability of overweight/obesity at age 7 (from the logistic regression models Table 2), by ethnic group
0.2 0.4 0.6 0.8 1 1.2 1.4
White Indian Pakistani & Bangladeshi Black African & Caribbean
Unadjusted
Antenatal and Postnatal
Dietary
Physical activity
Maternal overweight
7. Sensitivity analyses
We run a series of sensitivity analyses to test the robustness of the results. First, we run linear probability models on child overweight/obesity. The results, presented in Appendix Table A-3, reveal associations in line with those obtained with the logistic regression models. Second, previous research in the United States has found a reversal of the association between socioeconomic position and child overweight/obesity only amongst girls (Wang and Zhang 2006). We therefore explored whether the results are similar for boys and girls and the results presented in Appendix Table A-4 show that, within each ethnic group, the patterns are more marked for boys than for girls, but that nonetheless the picture is similar for both groups. Third, we run a series of sensitivity analyses with the aim of documenting whether the results are robust to different categorizations of family socioeconomic position, alternative markers of unhealthy weight, and ethnicity since there are some interethnic differences in child obesity and socioeconomic position in the subgroups we combined.
7.1 Different categorizations of income or socioeconomic position
The results are qualitatively similar if we moved families belonging to the third income quintile – who in the main analyses are included into the higher income group – into the less advantaged group (Appendix Table A-5). The results are also qualitatively similar for all ethnic groups if we used family income measured at Sweep 3 collected when the cohort children were around 5 years old and if we use a continuous measure of family income (results available upon request).
As discussed in the ‘materials and methods’ section, we chose to focus on income, as we have reservations about how foreign qualifications were measured in the MCS and what they meant in terms of employment opportunities across different ethnic groups. Nonetheless, as a robustness check, we ran the analyses using education9 as a marker of socioeconomic position (instead of income), allowing its association to vary across ethnic groups. The results (available upon request) were qualitatively similar. In addition, we ran the baseline model adjusting for maternal education. When maternal education is introduced as an additional uniform control (a potentially problematic specification since its relationship with child overweight/obesity is, like for income, likely to be heterogenous across ethnic groups), variations in the socioeconomic disparities in child overweight/obesity across ethnic groups were unchanged.
9 We categorized education into three categories: lower education (ISCED 3B and below based on ISCED
7.2 Alternative measures of unhealthy weight
The results, presented in Appendix Table A-6, show that when looking at the continuous measure of BMI we observe qualitatively similar results – within the White group poorer children have higher average levels of BMI than more advantaged ones, whilst the opposite is true within the ethnic minority groups. When looking at waist circumference, the patterns are similar to the main results of this study with the exception of the Pakistani/Bangladeshi group which shows a risk ratio just below the one of the White group. When looking at body fat, the Indian, Pakistani/Bangladeshi and Black African/Caribbean groups show risk ratios considerably lower that of the White group. However, we only observe a reversal of the socioeconomic disparities within the Indian group whilst the risk ratios within the Pakistani/Bangladeshi group and Black African/Caribbean group are not reversed compared to the White group but smaller. These additional results reassuringly suggest that socioeconomic disparities in child obesity/overweight by ethnic groups are unlikely to be driven by ethnic groups’ differences in body fat at similar BMI levels.
7.3 Ethnicity
We explore whether patterns are similar between the Pakistani and Bangladeshi children, and between the Black Caribbean and African children, which we grouped together in the main analyses because of sample size issues. Bangladeshi children are more likely to be overweight/obese compared to Pakistani children (Zilanawala et al. 2015). Although the prevalence of child overweight/obesity is very similar between Black Caribbean and African families, the former tend to be more likely to be disadvantaged compared to Black African families (Goisis and Sigle-Rushton 2014). Results in Appendix Table A-7 show that, on average, Bangladeshi children experience higher rates of overweight/obesity at age 7 than Pakistani children; however, this occurs to the same extent in the lower and higher income groups such that the socioeconomic risk ratios are virtually identical across the Pakistani and Bangladeshi groups. Black African and Caribbean mothers in the lower income quintiles show highly similar rates of child overweight/obesity, whilst amongst mothers in the higher income quintiles Black Caribbean mothers show higher rates. The risk ratios are not identical, but are nonetheless similar between the Black African (0.77) and Caribbean groups (0.55) showing a clear reversal of socioeconomic disparities compared to the White group.
presented in this study are robust to different model specifications, income categorizations, markers of unhealthy weight, and ethnicity categorizations.
8. Conclusions
It is well established that children from poorer backgrounds are, on average, more likely to be overweight/obese than children from more advantaged families (Griffiths et al. 2010a), which the literature has attributed to worse dietary behaviours and lower levels of physical activity. There is also solid evidence that children of ethnic minority parents in the United Kingdom have higher rates of overweight/obesity than children of White parents (Hawkins et al. 2009; Zilanawala et al. 2015), that socioeconomic disadvantage is associated with a higher risk of child overweight/obesity, and that ethnic minorities tend to be more socioeconomically disadvantaged than the majority White group (Hills et al. 2010). Thus, it is possible that ethnic minority children show higher rates of overweight/obesity because of the socioeconomic disadvantages they endure, which we might expect to be associated with worse diets and less physical activity. A small number of studies, mostly focusing on the US population, problematize this hypothesis by showing that within ethnic minority groups socioeconomic disparities in child overweight/obesity are either reversed or nonexistent.
In this study we have further investigated and unpacked these complexities in the UK context by revealing that there is important variability in the way socioeconomic position, child overweight/obesity, and health behaviours are linked. The results of our study show that, consistent with the vast literature on the socioeconomic disparities in child overweight/obesity, poorer White children are at higher risk of overweight/obesity than higher-income White children. Socioeconomic differentials are instead reversed for children from Black Caribbean/African backgrounds and nonexistent for Indian and Pakistani/Bangladeshi backgrounds. The results further show that the health behaviours that largely explain socioeconomic disparities in child overweight/obesity for White children, do little to mediate the relationship children from other ethnic backgrounds and in particular for Black African/Caribbean children for which we see a reversal of the socioeconomic disparities compared to White children.
be overweight/obese than children of higher socioeconomic position. In contrast, this picture does not hold for children from ethnic minority groups. Since White children comprise the vast majority of observations in nationally representative datasets, their patterns tend to determine what we see when we examine samples of all races and ethnicities together. The results also suggest that researchers should be careful in interpreting models predicting ethnic disparities in child overweight/obesity (or child health more in general) adjusted for markers of socioeconomic position without considering that the link between socioeconomic position and child overweight/obesity is potentially heterogeneous across ethnic groups (Sigle and Goisis 2018). Finally, our results point to the need for further research to identify other factors to explain why within some ethnic groups socioeconomic patterns in child overweight/obesity are opposite to what is observed for the majority White group.
One plausible explanation is that within some ethnic groups a higher socioeconomic position might be associated with a poorer rather than a healthier diet. For example, research shows that within the Black Caribbean population in the United Kingdom, people with lower income are prepared to spend a higher portion of their disposable income on traditional Caribbean food and products, many of which are less calorically dense food (Sharma et al. 2007), than their more advantaged counterparts. A complementary or alternative possibility is that a higher socioeconomic position for ethnic minority groups could bring along new experiences of racial discrimination which might contribute to less healthy behaviours, distance from the family of origin and adherence to traditional food preparation practices and norms (Colen 2011; Colen et al. 2006; Nuru-Jeter et al. 2009). Our study is one of the first to attempt to unpack these diverse associations. However, the data we used in this study precluded investigating some of the underlying processes. In fact, the MCS does not provide information on the children’s daily calories’ intake, whether the meals are home cooked, and the parent’s perception of what constitutes healthy food and a healthy weight. For this reason, we are unable to test whether these cultural processes vary by socioeconomic position within ethnic minority groups and whether they contribute to explain interethnic variations in the link between socioeconomic position and child overweight/obesity. The sample size also precluded investigation of whether these processes vary by maternal nativity status within each ethnic minority group.10
Acculturation is likely to happen differently across ethnic groups and it could be that the link between socioeconomic position and health behaviours varies by nativity
10 We did not adjust for an overall marker of nativity in the models since existing work shows that treating
within ethnic minority groups (Smith, Kelly, and Nazroo 2012). There is also evidence suggesting that immigrant groups might differ in what they understand to be healthy food: McEwen, Straus, and Croker (2009), for example, showed that within a Black African Somali population living in the United Kingdom the consumption of fruit and vegetables was low because it was perceived as associated with poverty. There is less evidence on the extent to which these patterns persist within the second generation: on one side we can expect a worsening of dietary behaviours and health with increasing generations (Hawkins et al. 2008; McDonald and Kennedy 2005), on the other, we know that economic circumstances tend to improve across generations. These patterns might vary depending on the socioeconomic status of the family of origin. For example, work by Martin et al. in the United States shows that advantaged Mexican-origin parents are better able to counteract the worsening of dietary patterns across generations (Martin, Van Hook, and Quiros 2015). The result is a complex and context-dependent association between health, health behaviours, and socioeconomic position. It would thus be fruitful for future research to examine the link between child overweight/obesity, socioeconomic position, nativity, and more detailed markers of children’s food consumption and calories’ intake together with experiences of racism/discrimination.
Indian, Pakistani/Bangladeshi and Black African/Caribbean children. Third, we were able to conduct multiple sensitivity analyses which show that our results are robust to different categorizations of socioeconomic position and ethnicity, and different markers of healthy weight.
It is important that the debate and design of policies to reduce child overweight/obesity takes account of the fact that socioeconomic position operates differently across ethnic groups. The UK government plan released in 2016 to reduce Britain’s rate of childhood overweight/obesity over the next ten years encourages the food and beverage industry to cut the amount of sugar in food and drinks and that primary school children eat more healthily and stay active (HM Government 2016; Public Health England 2018). But while these factors are clearly predictors of socioeconomic disparities in the prevalence of overweight and obesity among the White children in the United Kingdom (and might contribute to explain why some ethnic groups overall experience a higher prevalence of overweight/obesity than others), in our study they do not explain socioeconomic differences in child overweight/obesity for Black African/Caribbean children who experience the opposite relationship between socioeconomic position and overweight/obesity as White children. Therefore, it is necessary that other explanatory factors for ethnic disparities in child overweight and obesity are investigated and incorporated into the policy debate.
9. Acknowledgements
References
Algan, Y., Dustmann, C., Glitz, A., and Manning, A. (2010). The economic situation of first and second-generation immigrants in France, Germany and the United Kingdom. The Economic Journal120(542): F4–F30. doi:10.1111/j.1468-0297. 2009.02338.x.
Arenz, S., Rückerl, R., Koletzko, B., and von Kries, R. (2004). Breast-feeding and childhood obesity: A systematic review. International Journal of Obesity
28(10): 1247–1256.doi:10.1038/sj.ijo.0802758.
Brophy, S., Cooksey, R., Gravenor, M.B., Mistry, R., Thomas, N., Lyons, R.A., and Williams, R. (2009). Risk factors for childhood obesity at age 5: Analysis of the millennium cohort study. BMC Public Health 9(467): 1–7. doi:10.1186/1471-2458-9-467.
Cole, T.J., Bellizzi, M.C., Flegal, K.M., and Dietz, W.H. (2000). Establishing a standard definition for child overweight and obesity worldwide: International survey.BMJ320(7244): 1240.doi:10.1136/bmj.320.7244.1240.
Colen, C.G. (2011). Addressing racial disparities in health using life course perspectives. Du Bois Review: Social Science Research on Race 8(1): 79–94.
doi:10.1017/S1742058X11000075.
Colen, C.G., Geronimus, A.T., Bound, J., and James, S.A. (2006). Maternal upward socioeconomic mobility and black–white disparities in infant birthweight.
American Journal of Public Health 96(11): 2032–2039. doi:10.2105/AJPH.
2005.076547.
Connelly, J.B., Duaso, M.J., and Butler, G. (2007). A systematic review of controlled trials of interventions to prevent childhood obesity and overweight: A realistic synthesis of the evidence. Public Health121(7): 510–517. doi:10.1016/j.puhe. 2006.11.015.
Feng, Z., Vlachantoni, A., Falkingham, J., and Evandrou, M. (2016). Ethnic differentials in health: The additional effect of ethnic density.Population, Space
and Place23(4): e2030.doi:10.1002/psp.2030.
Frisco, M.L., Quiros, S., and Van Hook, J. (2016). One size may not fit all: How obesity among Mexican-origin youth varies by generation, gender, and age.
Demography53(6): 2031–2043.doi:10.1007/s13524-016-0525-3.
Gilbert, P.A. and Khokhar, S. (2008). Changing dietary habits of ethnic groups in Europe and implications for health. Nutrition Reviews 66(4): 203–215.
doi:10.1111/j.1753-4887.2008.00025.x.
Goisis, A. and Sigle-Rushton, W. (2014). Childbearing postponement and child well-being: A complex and varied relationship? Demography 51(5): 1821–1841.
doi:10.1007/s13524-014-0335-4.
Goisis, A., Sacker, A., and Kelly, Y. (2016). Why are poorer children at higher risk of obesity and overweight? A UK cohort study.European Journal of Public Health
26(1): 7–13.doi:10.1093/eurpub/ckv219.
Gordon, R.A., Chase-Lansdale, P.L., and Brooks-Gunn, J. (2004). Extended households and the life course of young mothers: Understanding the associations using a sample of mothers with premature, low birth weight babies.Child Development
75(4): 1013–1038.doi:10.1111/j.1467-8624.2004.00723.x.
Griffiths, L.J., Hawkins, S.S., Cole, T., and Dezateux, C. (2010a). Risk factors for rapid weight gain in preschool children: findings from a UK-wide prospective study.
International Journal of Obesity 34(4): 624–632.doi:10.1038/ijo.2010.10.
Griffiths, L.J., Hawkins, S.S., Cole, T., Law, C., and Dezateaux, C. (2010b). Childhood overweight and obesity. In: Hansen, K., Joshi, H., and Dex, S. (eds.).Children of
the 21st century. Bristol: The Policy Press. doi:10.1332/policypress/97818
47424761.003.0013.
Hansen, K. (2008). Millennium cohort study first, second and third surveys: A Guide to the datasets. London: Centre for Longitudinal Studies. http://doc.ukdataservice. ac.uk/doc/7464/mrdoc/pdf/mcs_guide_to_the_datasets_020214.pdf.
Harder, T., Bergmann, R., Kallischnigg, G., and Plagemann, A. (2005). Duration of breastfeeding and risk of overweight: A meta-analysis. American Journal of
Epidemiology162(5): 397–403.doi:10.1093/aje/kwi222.
Hawkins, S.S., Cole, T.J., and Law, C. (2007). Maternal employment and early childhood overweight: Findings from the UK Millennium Cohort Study.
Hawkins, S.S., Cole, T.J., Law, C., and the Millennium Cohort Study Child Health Group (2009). An ecological systems approach to examining risk factors for early childhood overweight: Findings from the UK Millennium Cohort Study.
Journal of Epidemiology and Community Health 63(2): 147–155.doi:10.1136/
jech.2008.077917.
Hawkins, S.S., Lamb, K., Cole, T.J., and Law, C. (2008). Influence of moving to the UK on maternal health behaviours: Prospective cohort study. BMJ 336(7652): 1052–1055.doi:10.1136/bmj.39532.688877.25.
Hills, J., Brewer, M., Jenkins, S., Lister, R., Lupton, S., Machin, C., Mills, C., Modood, T., Rees, T., and Riddell, S. (2010). An anatomy of economic inequality in the UK: Report of the National Equality Panel. London: Centre for the Analysis of Social Exclusion (CASEreport60). https://eprints.lse.ac.uk/28344/1/CASE report60.pdf.
HM Government (2016). Childhood obesity: A plan for action. London: Cabinet Office, Department of Health and Social Care.https://assets.publishing.service.gov.uk/ government/uploads/system/uploads/attachment_data/file/546588/Childhood_ob esity_2016__2__acc.pdf.
Kelly, Y. and Bartley, M. (2010). Parental and child health. In: Hansen, K., Joshi, H., and Dex, S. (eds.). Children of the 21st century. Bristol: The Policy Press.
doi:10.1332/policypress/9781847424761.003.0015.
Krebs, N.F., Himes, J.H., Jacobson, D., Nicklas, T.A., Guilday, P., and Styne, D. (2007). Assessment of child and adolescent overweight and obesity.Pediatrics
120(S4): S193–S228.doi:10.1542/peds.2007-2329D.
Martin, M.A., Frisco, M.L., Nau, C., and Burnett, K. (2012). Social stratification and adolescent overweight in the United States: How income and educational resources matter across families and schools. Social Science and Medicine
74(4): 597–606.doi:10.1016/j.socscimed.2011.11.006.
Martin, M.A., Van Hook, J.L., and Quiros, S. (2015). Is socioeconomic incorporation associated with a healthier diet? Dietary patterns among Mexican-origin children in the United States. Social Science and Medicine 147: 20–29. doi:10.1016/j. socscimed.2015.10.028.
Martinson, M.L., McLanahan, S., and Brooks-Gunn, J. (2012). Race/ethnic and nativity disparities in child overweight in the United States and England.The Annals of
the American Academy of Political and Social Science 643(1): 219–238.
Massion, S., Wickham, S., Pearce, A., Barr, B., Law, C., and Taylor-Robinson, D. (2016). Exploring the impact of early life factors on inequalities in risk of overweight in UK children: Findings from the UK Millennium Cohort Study.
Archives of Disease in Childhood 101(8): 724–730.
doi:10.1136/archdischild-2015-309465.
McDonald, J.T. and Kennedy, S. (2005). Is migration to Canada associated with unhealthy weight gain? Overweight and obesity among Canada’s immigrants.
Social Science and Medicine61(12): 2469–2481.doi:10.1016/j.socscimed.2005.
05.004.
McEwen, A., Straus, L., and Croker, H. (2009). Dietary beliefs and behaviour of a UK Somali population. Journal of Human Nutrition and Dietetics 22(2): 116–121.
doi:10.1111/j.1365-277X.2008.00939.x.
Monteiro, C.A., Moura, E.C., Conde, W.L., and Popkin, B.M. (2004). Socioeconomic status and obesity in adult populations of developing countries: A review.
Bulletin of the World Health Organization 82(12): 940–946.
Ng, S.W., Ni Mhurchu, C., Jebb, S.A., and Popkin, B.M. (2012). Patterns and trends of beverage consumption among children and adults in Great Britain, 1986–2009.
British Journal of Nutrition 108(3): 536–551. doi:10.1017/S00071145110
06465.
Nuru-Jeter, A., Dominguez, T.P., Hammond, W.P., Leu, J., Skaff, M., Egerter, S., Jones, C.P., and Braveman, P. (2009). ‘It’s the skin you’re in’: African-American women talk about their experiences of racism: An exploratory study to develop measures of racism for birth outcome studies. Maternal and Child
Health Journal 13: 29–39.doi:10.1007/s10995-008-0357-x.
Odgen, C.L., Lamb, M.M., Carroll, M.D., and Flegal, K.M. (2010). Obesity and socioeconomic status in children and adolescents: United States, 2005–2008. Hyattsville: National Center for Health Statistics (NCHS Data Brief 51).
OECD (2013). OECD framework for statistics on the distribution of household income, consumption and wealth. Paris: OECD.doi:10.1787/9789264194830-en.
Reilly, J.J., Armstrong, J., Dorosty, A.R., Emmett, P.M., Ness, A., Rogers, I., Steer, C., Sherriff, A. (2005). Early life risk factors for obesity in childhood: cohort study.
BMJ330(7504): 1357.doi:10.1136/bmj.38470.670903.E0.
Sharma, S., Cade, J., Riste, L., and Cruickshank, K. (2007). Nutrient intake trends among African-Caribbeans in Britain: A migrant population and its second generation. Public Health Nutrition 2(4): 469–476. doi:10.1017/S136898 0099000658.
Sigle, W. and Goisis, A. (2018).Mind the gap: Variations by maternal nativity in the
health-related resources associated with parental marriage. Paper presented at
the Annual Meeting of the Population Association of America, Denver, USA, April 26–28, 2018.
Smith, N.R., Kelly, Y.J., and Nazroo, J.Y. (2012). The effects of acculturation on obesity rates in ethnic minorities in England: Evidence from the Health Survey for England. European Journal of Public Health 22(4): 508–513.doi:10.1093/ eurpub/ckr070.
Van Hook, J. and Stamper Balistreri, K. (2007). Immigrant generation, socioeconomic status, and economic development of countries of origin: A longitudinal study of body mass index among children.Social Science and Medicine65(5): 976–989.
doi:10.1016/j.socscimed.2007.04.032.
Vandewater, E.A., Shim, M.-s., and Caplovitz, A.G. (2004). Linking obesity and activity level with children’s television and video game use. Journal of
Adolescence27(1): 71–85.doi:10.1016/j.adolescence.2003.10.003.
Wang, Y. and Zhang, Q. (2006). Are American children and adolescents of low socioeconomic status at increased risk of obesity? Changes in the association between overweight and family income between 1971 and 2002.The American
Journal of Clinical Nutrition84(4): 707–716.doi:10.1093/ajcn/84.4.707.
Waters, M.C. (2014). Defining difference: The role of immigrant generation and race in American and British immigration studies.Ethnic and Racial Studies37(1): 10– 26.doi:10.1080/01419870.2013.808753.
Williams, S.M. (2005). Weight and height growth rate and the timing of adiposity rebound.Obesity Research13(6): 1123–1130.doi:10.1038/oby.2005.131. Zilanawala, A., Davis-Kean, P., Nazroo, J., Sacker, A., Simonton, S., and Kelly, Y.
(2015). Race/ethnic disparities in early childhood BMI, obesity and overweight in the United Kingdom and United States. International Journal of Obesity
Appendix
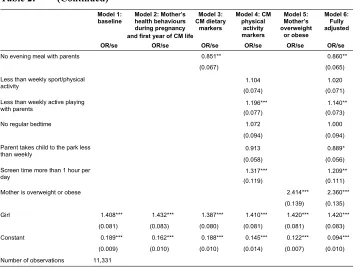
Table A-1: Unweighted number of observations with nonmissing information on the subsample used for the analyses
Mother's ethnicity at Sweep 1
White Indian Pakistani and Bangladeshi Black African and Caribbean
Sweep 4 N % N % N % N %
Bottom quintile 1,651 16.32 46 16.25 327 52.91 103 32.8
Second quintile 1,903 18.81 67 23.67 200 32.36 71 22.61
Third quintile 2,176 21.51 68 24.03 54 8.74 54 17.2
Fourth quintile 2,186 21.61 48 16.96 17 2.75 52 16.56
Top quintile 2,200 21.75 54 19.08 20 3.24 34 10.83
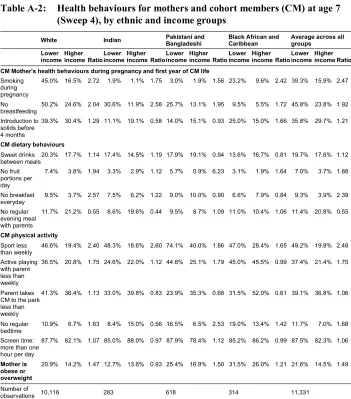
Table A-2: Health behaviours for mothers and cohort members (CM) at age 7 (Sweep 4), by ethnic and income groups
White Indian Pakistani andBangladeshi Black African andCaribbean Average across allgroups
Lower income Higher income Ratio Lower income Higher income Ratio Lower income Higher income Ratio Lower income Higher income Ratio Lower income Higher income Ratio CM Mother's health behaviours during pregnancy and first year of CM life
Smoking during pregnancy
45.0% 16.5% 2.72 1.9% 1.1% 1.75 3.0% 1.9% 1.56 23.2% 9.6% 2.42 39.3% 15.9% 2.47
No breastfeeding
50.2% 24.6% 2.04 30.6% 11.9% 2.58 25.7% 13.1% 1.95 9.5% 5.5% 1.72 45.8% 23.8% 1.92
Introduction to solids before 4 months
39.3% 30.4% 1.29 11.1% 19.1% 0.58 14.0% 15.1% 0.93 25.0% 15.0% 1.66 35.8% 29.7% 1.21
CM dietary behaviours Sweet drinks
between meals20.3% 17.7% 1.14 17.4% 14.5% 1.19 17.9% 19.1% 0.94 13.6% 16.7% 0.81 19.7% 17.6% 1.12 No fruit
portions per day
7.4% 3.8% 1.94 3.3% 2.9% 1.12 5.7% 0.9% 6.23 3.1% 1.9% 1.64 7.0% 3.7% 1.88
No breakfast everyday
9.5% 3.7% 2.57 7.5% 6.2% 1.22 9.0% 10.0% 0.90 6.6% 7.9% 0.84 9.3% 3.9% 2.39
No regular evening meal with parents
11.7% 21.2% 0.55 8.6% 19.6% 0.44 9.5% 8.7% 1.09 11.0% 10.4% 1.06 11.4% 20.8% 0.55
CM physical activity Sport less
than weekly 46.6% 19.4% 2.40 48.3% 18.6% 2.60 74.1% 40.0% 1.86 47.0% 28.4% 1.65 49.2% 19.8% 2.48 Active playing
with parent less than weekly
36.5% 20.8% 1.75 24.6% 22.0% 1.12 44.8% 25.1% 1.79 45.0% 45.5% 0.99 37.4% 21.4% 1.75
Parent takes CM to the park less than weekly
41.3% 36.4% 1.13 33.0% 39.8% 0.83 23.9% 35.3% 0.68 31.5% 52.0% 0.61 39.1% 36.8% 1.06
No regular
bedtime 10.9% 6.7% 1.63 8.4% 15.0% 0.56 16.5% 6.5% 2.53 19.0% 13.4% 1.42 11.7% 7.0% 1.68 Screen time:
more than one hour per day
87.7% 82.1% 1.07 85.0% 88.0% 0.97 87.9% 78.4% 1.12 85.2% 86.2% 0.99 87.5% 82.3% 1.06
Mother is obese or overweight
20.9% 14.2% 1.47 12.7% 13.6% 0.93 25.4% 16.9% 1.50 31.5% 26.0% 1.21 21.6% 14.5% 1.49
Number of
Table A-3: Linear probability model on cohort member (CM) being
obese/overweight at age 7 (Sweep 4) by ethnic and income groups
Model 1: Baseline
Model 2: Mother's health behaviours during pregnancy and first year of CM life
Model 3: CM dietary markers
Model 4: CM physical activity markers
Model 5: Mother is overweight or
obese Model 6: Fullyadjusted
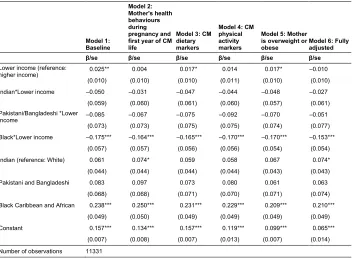
β/se β/se β/se β/se β/se β/se Lower income (reference:
higher income) 0.025** 0.004 0.017* 0.014 0.017* –0.010
(0.010) (0.010) (0.010) (0.011) (0.010) (0.010)
Indian*Lower income –0.050 –0.031 –0.047 –0.044 –0.048 –0.027
(0.059) (0.060) (0.061) (0.060) (0.057) (0.061)
Pakistani/Bangladeshi *Lower
income –0.085 –0.067 –0.075 –0.092 –0.070 –0.051
(0.073) (0.073) (0.075) (0.075) (0.074) (0.077)
Black*Lower income –0.175*** –0.164*** –0.165*** –0.170*** –0.170*** –0.153***
(0.057) (0.057) (0.056) (0.056) (0.054) (0.054)
Indian (reference: White) 0.061 0.074* 0.059 0.058 0.067 0.074*
(0.044) (0.044) (0.044) (0.044) (0.043) (0.043)
Pakistani and Bangladeshi 0.083 0.097 0.073 0.080 0.061 0.063
(0.068) (0.068) (0.071) (0.070) (0.071) (0.074)
Black Caribbean and African 0.238*** 0.250*** 0.231*** 0.229*** 0.209*** 0.210***
(0.049) (0.050) (0.049) (0.049) (0.049) (0.049)
Constant 0.157*** 0.134*** 0.157*** 0.119*** 0.099*** 0.065***
(0.007) (0.008) (0.007) (0.013) (0.007) (0.014)
Number of observations 11331
Note: Control variables are not presented for brevity but are available upon request. *** p<0.01, ** p<0.05, * p<0.1.
Table A-4: Percentage of cohort members (CM) obese/overweight at age 7 (Sweep 4), by ethnic & income groups & CM Sex
White Indian Pakistani and Bangladeshi Black African and Caribbean
Boy Girl Boy Girl Boy Girl Boy Girl
Bottom, second
quintiles 17.66% 24.21% 20.92% 22.77% 17.92% 23.52% 17.28% 39.31%
Third, fourth, top
quintiles 16.06% 20.80% 23.54% 25.21% 29.73% 23.00% 42.77% 42.18%
Ratio 1.10 1.16 0.89 0.90 0.60 1.02 0.40 0.93
Number of
Table A-5: Percentage of cohort members (CM) obese/overweight at age 7 (Sweep 4), by ethnic & income groups (bottom/second/third quintile vs. rest)
White Indian Pakistani andBangladeshi Black African andCaribbean Average across all groups
Bottom, second, third
quintiles 20.74% 25.59% 20.77% 29.80% 21.17%
Fourth and top quintiles 17.37% 19.92% 33.91% 44.20% 18.06%
Ratio 1.19 1.28 0.61 0.67 1.17
Number of observations 10,116 283 618 314 11,331
Table A-6: Percentage of cohort members (CM) obese/overweight at age 7 (Sweep 4), by ethnic & income groups (bottom/second quintile vs. rest)
White Indian Pakistani and Bangladeshi Black African and Caribbean Continuous BMI
Bottom, second quintiles 16.74 16.03 16.47 17.60
Third, fourth, top quintiles 16.53 16.64 16.57 18.00
Ratio 1.01 0.96 0.97 0.98
Number of observations 10,116 283 618 314
85th percentile or above of % waist circumference
Bottom, second quintiles 14.00% 17.29% 19.42% 20.30%
Third, fourth, top quintiles 12.72% 18.20% 17.99% 24.06%
Ratio 1.10 0.95 1.08 0.84
Number of observations 10,026 282 610 312
85th percentile or above of % body fat
Bottom, second quintiles 14.47% 18.29% 22.01% 29.09%
Third, fourth, top quintiles 12.03% 23.94% 19.93% 27.57%
Ratio 1.20 0.76 1.10 1.06
Number of observations 9,969 282 613 308
Table A-7: Percentage of cohort members (CM) obese/overweight at age 7 (Sweep 4), without aggregating Pakistani/Bangladeshi and Black African/Caribbean
Pakistani Bangladeshi Black African Caribbean
Bottom, second quintiles 19.94% 23.44% 28.42% 25.57%
Third, fourth, top quintiles 25.61% 29.97% 36.94% 46.79%
Ratio 0.78 0.78 0.77 0.55
Table A-8: Logistic regression model on cohort member (CM) being
overweight/obese at age 7 (Sweep 4) by ethnic and income groups using 10 imputed datasets
Model 1: Baseline Model 6: Fully adjusted
Lower income (reference: higher income) 1.167** 0.934
(0.071) (0.058)
Indian *Lower income 0.791 0.898
(0.263) (0.317)
Pakistani/Bangladeshi *Lower income 0.644 0.780
(0.231) (0.302)
Black *Lower income 0.441*** 0.519***
(0.080) (0.094)
Indian (reference: White) 1.348 1.517*
(0.314) (0.367)
Pakistani and Bangladeshi 1.684 1.578
(0.570) (0.585)
Black Caribbean and African 3.699*** 3.306***
(0.619) (0.582)
Number of observations 12,385 12,385
Note: *** p<0.01, ** p<0.05, * p<0.1.
Table A-9: Logistic regression model on cohort member (CM) being
overweight/obese at age 7 (Sweep 4) with adjustment for education, by ethnic and income groups
Model 1: baseline Model 1 with controls for education
OR/se OR/se
Lower income (reference: higher income) 1.172** 1.077
(0.075) (0.071)
Indian *Lower income 0.738 0.732
(0.248) (0.246)
Pakistani/Bangladeshi *Lower income 0.609 0.609
(0.234) (0.238)
Black *Lower income 0.438*** 0.433***
(0.112) (0.111)
Indian (reference: White) 1.444 1.470
(0.345) (0.345)
Pakistani and Bangladeshi 1.622 1.612
(0.571) (0.579)
Black Caribbean and African 3.245*** 3.367***
(0.660) (0.695)
Education: NVQ 1,2, none of these qualifications (reference: NVQ 3, 4, 5)
1.262*** (0.080)
Education: overseas qualification 1.188
(0.207)
Girl 1.408*** 1.405***
(0.081) (0.080)
Constant 0.189*** 0.172***
(0.009) (0.010)
Number of observations 11,326 11,326