Volume-5 Issue-1
International Journal of Intellectual Advancements and
Research in Engineering Computations
ISSN:2348-2079
Abstract : A Brain Computer Interface (BCI) with seizure prediction. A digital image processing method is to be used in. In machine learning, multiple kernel learning- support vector machines (MKL-SVMs, also support vector networks]) are supervised learning models with associated learning algorithms that analyze data used for classification and regression analysis. The clustering algorithm which provides an improvement to the support vector machines is called support vector clustering and is often used in industrial applications either when data is not labeled or when only some data is labeled as a preprocessing for a classification pass. Epilepsy is characterized by a long-term risk of recurrent seizures. These seizures may present in several ways depending on the part of the brain involved and the person's age.
Index Terms— MKL-SVM,SVC,BCI, Kernel trick, Deviation, Epilepsy, Phase correlation, Seizure.
I. INTRODUCTION
An epileptic seizure (colloquially a fit) is a brief episode of signs or symptoms due to abnormal
excessive or synchronous neuronal activity in
the brain.[1] The outward effect can vary from
uncontrolled jerking movement (tonic-clonic seizure) to as subtle as a momentary loss of awareness (absence seizure). Diseases of the brain characterized by an enduring predisposition to generate epileptics
seizures are collectively called epilepsy[1][2].The most
common type (60%) of seizures are convulsive.[21] Of
these, one-third begin as generalized seizures from the start, affecting both hemispheres of the
brain.[21] Two-thirds begin as partial seizures (which
affect one hemisphere of the brain) which may then
progress to generalized seizures.[21] The remaining
40% of seizures are non-convulsive. An example of this type is the absence seizure, which presents as a decreased level of consciousness and usually lasts
about 10 seconds.[22][23]
Partial seizures are often preceded by certain
experiences, known as auras.[24] They include sensory
A brain computer interface technique with seizure prediction
Vibeethakeertthana V.S¹,Sadish Kumar S.T²
M.E Applied Electronics¹, Head of the Department/ECE²
Nandha Engineering College,Erode-52,Tamilnadu,India¹²
[email protected]¹,[email protected]²
(visual, hearing, or smell), psychic, autonomic, and
motor phenomena.[22] Jerking activity may start in a
specific muscle group and spread to surrounding muscle groups in which case it is known as
a Jacksonian march.[25] Automatisms may occur,
which are non-consciously-generated activities and mostly simple repetitive movements like smacking of the lips or more complex activities such as attempts
to pick up something.[25]
There are six main types of generalized seizures: tonic,clonic, tonic, clonic, myoclonic, absen
ce, and atonic seizures.[26]They all involve loss of
consciousness and typically happen without warning.
Tonic-clonic seizures occur with a
contraction of the limbs followed by their extension along with arching of the back which lasts 10– 30 seconds (the tonic phase). A cry may be heard due to contraction of the chest muscles, followed by a shaking of the limbs in unison (clonic phase).
Tonic seizures produce constant contractions of the muscles. A person often turns blue as breathing is stopped. In clonic seizures there is shaking of the limbs in unison. After the shaking has stopped it may take 10–30 minutes for the person to return to normal; this period is called the "postictal state" or "postictal phase."
Loss of bowel or bladder control may occur
during a seizure.[27] The tongue may be bitten at
either the tip or on the sides during a
seizure.[28] In tonic-clonic seizure, bites to the sides
are more common.[28] Tongue bites are also relatively
common inpsychogenic non-epileptic seizures.[28]
Myoclonic seizures involve spasms of
muscles in either a few areas or all over.[29] Absence
seizures can be subtle with only a slight turn of the
head or eye blinking.[22] The person does not fall over
and returns to normal right after it ends.[22]Atonic
seizures involve the loss of muscle activity for
greater than one second.[25] This typically occurs on
both sides of the body.[25]
About 6% of those with epilepsy have seizures that are often triggered by specific events
and are known as reflex seizures.[30] Those
with reflex epilepsy have seizures that are only
triggered by specific stimuli.[31] Common triggers
include flashing lights and sudden noises.[30] In
certain types of epilepsy, seizures happen more often
during sleep,[32] and in other types they occur almost
only when sleeping.[33]
In Ancient Rome people did not eat or drink with the same pottery as that used by someone who
was affected.[12] People of the time would spit on
their chest believing that this would keep the problem
from affected them.[12] According to Apuleius and
other ancient physicians, in order detect epilepsy it was common to lit a piece of gagates, whose smoke's
would trigger the seizure.[123] Occasionally a
spinning potter's wheel was used, perhaps a reference
to photosensitive epilepsy.[3]
In most cultures, persons with epilepsy have been stigmatized, shunned, or even imprisoned; in
the Salpêtrière, the birthplace of modern
neurology, Jean-Martin Charcot found people with epilepsy side-by-side with the mentally ill, those with
chronic syphilis, and the criminally
insane.[1] In ancient Rome, epilepsy was known as
the morbus comitialis('disease of the assembly hall') and was seen as a curse from the gods. In northern Italy, epilepsy was once traditionally known as Saint
Valentine's malady.[16]
II. EXISTING METHOD
Existing method of a multichannel patient-specific seizure detection method based on the empirical mode decomposition (EMD) and support vector machine (SVM) classifier. The EMD is used
to extract features from intracranial
electroencephalography (EEG). A machine-learning algorithm is used as a classifier to discriminate between seizure and nonseizure intracranial EEG epochs. A postprocessing algorithm is proposed to reject artifacts and increase the robustness of the method. Evaluated using 463 hours of intracranial EEG recordings from 17 patients with a total of 51 seizures in the Freiburg EEG database. The most of the existing seizure detection systems, including an average sensitivity of 92%, false detection rate (FDR) of 0.17/hour, and time delay (TD) of 12 sec. Moreover, the FDR could be further reduced by a TD extension.
Given its high sensitivity and low FDR, the proposed patient-specific seizure detection method can greatly assist clinical staff with automatically marking seizures in long-term EEG or detecting seizure onset online with high performance. Early and accurate seizure detection using this method may serve as a practical tool for planning epilepsy interventions.
or conditioning methods to preprocess the raw EEG signals when we use our recurrence time method. The good results presented below thus suggest that the method is very reliable.
III. PROPOSED METHOD 1.Notation and Definitions
Epilepsy is a group of neurological
diseases characterized by this seizure are mainly
in epileptic seizures.[1][2] Epileptic seizures are
episodes that can vary from brief and nearly
undetectable to long periods of vigorous
shaking.[3] These episodes can result in physical
injuries including occasionally broken bones.[3] In
epilepsy, seizures tend to recur, and have no
immediate underlying cause.[1] Isolated seizures that
are provoked by a specific cause such as poisoning
are not deemed to represent epilepsy.[4] People with
epilepsy in some areas of the world
experience stigma due to the condition.[3]
The cause of most cases of epilepsy is unknown, although some people develop epilepsy as the result of brain injury, stroke, brain tumors,
infections of the brain, and birth
defects.[3] Known genetic mutations are directly
linked to a small proportion of cases.[5][6]Epileptic
seizures are the result of excessive and abnormal
nerve cell activity in the cortex of the brain.[4] The
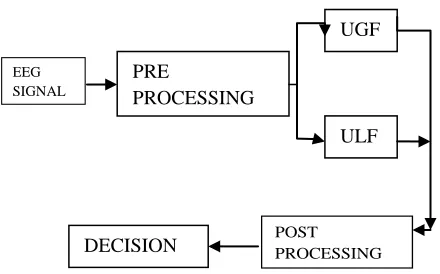
diagnosis involves ruling out other conditions that might cause similar symptoms such as fainting and determining if another cause of seizures is present such as alcohol withdrawal or electrolyte problems. This may be partly done by imaging the brain and performing blood tests. A generic block diagram is shown on figure 1.1 Epilepsy can often be confirmed with an electroencephalogram (EEG), but a normal
test does not rule out the condition.[5]
Fig. 1.1. Generic block diagram of a seizure prediction process.
Approximately 325 millon people
experience within their lifetime. Epilepsy occurs in a number of other animals including dogs and cats and
is the most common brain disorder in dogs.[16] It is
typically treated with anticonvulsants such as phenobarbital or bromide in dogs and phenobarbital
in cats.[17] Imepitoin is also used in dogs.[18] While
generalized seizures in horses are fairly easy to diagnose, it may be more difficult in non-generalized
seizures and EEGs may be useful.[19]
A figure 1.2 shows on Epilepsy monitoring is typically done:
to distinguish epileptic seizures from other types
of spells, such as psychogenic non-epileptic
seizures, syncope (fainting),
sub-corticalmovement
disorders and migraine variants.
to characterize seizures for the purposes of
treatment
to localize the region of brain from which a
seizure originates for work-up of possible seizure surgery
Additionally, EEG may be used to monitor certain procedures:
to monitor the depth of anesthesia
as an indirect indicator of cerebral perfusion
in carotid endarterectomy
to monitor amobarbital effect during the Wada
test
Figure 1.2. An EEG recording setup
EEG can also be used in intensive care units for brain function monitoring:
to monitor for non-convulsive
seizures/non-convulsive status epilepticus
to monitor the effect of sedative/anesthesia in
patients in medically induced coma (for
treatment of refractory seizures or
increased intracranial pressure) EEG
SIGNAL
POST PROCESSING PRE
PROCESSING
UGF
ULF L
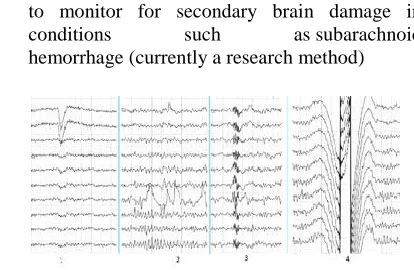
to monitor for secondary brain damage in
conditions such as subarachnoid
hemorrhage (currently a research method)
Figure 1.3. Human EEG artifacts
If a patient with epilepsy is being considered for resective surgery, it is often necessary to localize the focus (source) of the epileptic brain activity with a resolution greater than what is provided by scalp EEG. A figure 1.3 shows on the human EEG artefacts waveform. This is because the cerebrospinal fluid, skull and scalp smear the electrical potentials recorded by scalp EEG. In these cases, neurosurgeons typically implant strips and grids of electrodes (or penetrating depth electrodes) under the dura mater, through either a craniotomy or a burr hole. The
recording of these signals is referred to
as electrocorticography (ECoG), subdural EEG
(sdEEG) or intracranial EEG (icEEG)--all terms for the same thing. The signal recorded from ECoG is on a different scale of activity than the brain activity recorded from scalp EEG. Low voltage, high frequency components that cannot be seen easily (or at all) in scalp EEG can be seen clearly in ECoG. Further, smaller electrodes (which cover a smaller parcel of brain surface) allow even lower voltage, faster components of brain activity to be seen. Some
clinical sites record from penetrating
microelectrodes.[1] EEG may be done in all pediatric
patients presenting with first onset afebrile or
complex febrile seizures.[9] EEG is not indicated for
diagnosing headache.[10] Recurring headache is a
common pain problem, and this procedure is sometimes used in a search for a diagnosis, but it has
no advantage over routine clinical evaluation.[10]
2.
Data Formation
A routine clinical EEG recording typically lasts 20–30 minutes (plus preparation time) and usually involves recording from scalp electrodes. Routine EEG is typically used in the following clinical circumstances:
to distinguish epileptic seizures from other types
of spells, such as psychogenic non-epileptic
seizures, syncope (fainting), sub-cortical
movement disorders and migraine variants.
To differentiate epilepsy cases and their
"organic" encephalopathy or delirium from its
primary psychiatric syndromes such as catatonia
to serve as an adjunct test of brain death
to prognosticate, in certain instances, in patients
with coma
to determine whether to wean anti-epileptic
medications
At times, a routine EEG is not sufficient, particularly when it is necessary to record a patient while he/she is having a seizure. In this case, the patient may be admitted to the hospital for days or even weeks, while EEG is constantly being recorded (along with time-synchronized video and audio recording). A recording of an actual seizure (i.e., an ictal recording, rather than an inter-ictal recording of a possibly epileptic patient at some period between seizures) can give significantly better information about whether or not a spell is an epileptic seizure and the focus in the brain from which the seizure activity emanates.
If a patient with epilepsy is being considered for resective surgery, it is often necessary to localize the focus (source) of the epileptic brain activity with a resolution greater than what is provided by scalp EEG. This is because the cerebrospinal fluid, skull and scalp smear the electrical potentials recorded by scalp EEG. In these cases, neurosurgeons typically implant strips and grids of electrodes (or penetrating depth electrodes) under the dura mater, through either a craniotomy or a burr hole. The recording of these signals is referred to as electrocorticography (ECoG), subdural EEG (sdEEG) or intracranial EEG (icEEG)--all terms for the same thing. The signal recorded from ECoG is on a different scale of activity than the brain activity recorded from scalp EEG. Low voltage, high frequency components that cannot be seen easily (or at all) in scalp EEG can be seen clearly in ECoG. Further, smaller electrodes (which cover a smaller parcel of brain surface) allow even lower voltage, faster components of brain activity to be seen. Some
clinical sites record from penetrating
microelectrodes.[1] EEG may be done in all pediatric
patients presenting with first onset afebrile or
complex febrile seizures.[9] EEG is not indicated for
diagnosing headache.[10] Recurring headache is a
common pain problem, and this procedure is sometimes used in a search for a diagnosis, but it has
no advantage over routine clinical evaluation.[10]
3.Undulaterd Global Feature Extraction (UGF)
respectively, containing all values of the specified time-window of the EEG signals. Corresponding transformed signals R and C are determined after applying Fast Fourier Transformation (FFT) on the reference and current epochs as follows:
R =ϕ(r) (1)
C =ϕ(c) (2)
where θ is the FFT function.
A phase correlation δ of r and c is then determined and it is using transformed signals by applying inverse FFT and shift FFT (these functions are available in Matlab) as follows:
δ = ϑ ϕ −1 (e j (∠R −∠C ) ) (3)
where ϑ is the FFT shift function and ∠ indicates the
angle or phase. Then the displacement between two epochs is determined as follows:
k = max(δ (t)) −π (4)
where the middle position of the epoch is considered as π and t is any sample position within the epoch.
The phase-matched reference epoch is calculated as follows, where inverse FFT is applied on the frequency current and phase-matched reference epochs as follows:
ε =c−ψ. (5)
Then discrete cosine transformation (DCT) is applied on th e phase-matched error in order to calculate the tra nsformed residual as follows:
4.Undulaterd Local Feature Extraction (ULF)
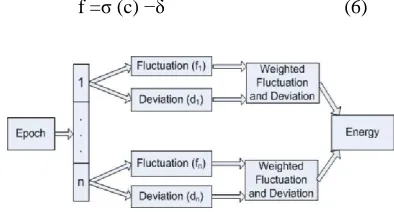
The calculation of flu ctuation and deviation is performed using a 10 seco nd epoch with 128 samples shifted (the justification of se lecting epoch size and shifting size is given in Sections IV .A and IV.B respectively). Unlike the technique in [3 2], the fluctuation function is refined as follows for the current epoch:
f =ζ (c) −δ (6)
Fig. 4.1. Extracted local feature using fluctuation
and deviation.
w here ζ is the standard deviation function applied on th e source (i.e. original) sig nal of each epoch, and δ is th e general artifacts component of the EE G signal. In the experiments, δ = 4 is used. Unlike the technique in [32], w e shifted the epoch by 128 samples (in Equation (11)) and calculated f for each shifted epoch. Thus, for a gi ven 10 -seco nd epoch it has 20 values of f. T he deviation function of the current epoch is also redefined as follows:
1 β
d = ∑
x= 1
c(t) −γ (7)
β
w here γ is the mode of the original signal c.
℘= w1 ×d 2 + w2 × f 2 (8)
As 128 samples are shifted for the shifted epoch to
calculate the cost function℘ (Fig. 5(a)), the cost
function quantifies 20 values of a 10 seconds epoch. From the current e poch, the energy of cost functions of the flu ctuation and deviation (ECFD) is calculated as the second feature (Fig. 5(b)):
n
Φ = ∑℘l2 (9)
l=1
The detailed proce ss of extracting a local feature is presented in Fig. 4.1.
In the first step, if at least three epochs have a classified value as ‗1‘ then all five epochs are considered ‗1‘. In the second step, six 50 seconds windows are to be considered to make a final decision. If at least two 50 second windows have ‗1‘ results then the entire five minute window is regulated as ‗1‘ otherwise it is ‗0‘.
It is to be noted that in order to prevent the impending seizure by administrating drugs [1], the
five minute window is sufficient. The seizure
prediction result as a decision is taken in each five minute window based on the two-step decision. In each step, different sized windows were investigated; however the proposed two-step method is the best regarding the PA and FPR.
5. Classifications
In contrast to the classification of
disease being identified (e.g. hippocampal
sclerosis).[62] The name of the diagnosis finally made
depends on the available diagnostic results and the applied definitions and classifications (of seizures and epilepsies) and its respective terminology.
The ability to categorize a case of epilepsy into a specific syndrome occurs more often with children since the onset of seizures is commonly
early.[45] Less serious examples arebenign rolandic
epilepsy (2.8 per 100,000), childhood absence
epilepsy (0.8 per 100,000) and juvenile myoclonic
epilepsy (0.7 per 100,000).[45] Severe syndromes with
diffuse brain dysfunction caused, at least partly, by some aspect of epilepsy, are also referred to as epileptic encephalopathies. These are associated with frequent seizures that are resistant to treatment and severe cognitive dysfunction, for instance Lennox–
Gastaut syndrome and West syndrome.[10] Genetics is
believed to play an important role in epilepsies by a number of mechanisms. Simple and complex modes of inheritance have been identified for some of them. However, extensive screening have failed to identify
many single gene variants of large effect.[71] More
recent exome and genome sequencing studies have begun to reveal a number of de novo gene mutations
that are responsible for some epileptic
encephalopathies, including CHD2 and SYNGAP1.
Figure 5.1 shows that a classification and external resources
Diagnostic imaging by CT scan and MRI is recommended after a first non-febrile seizure to detect structural problems in and around the
brain.[62] MRI is generally a better imaging test
except when bleeding is suspected, for which CT is
more sensitive and more easily available.[16] If
someone attends the emergency room with a seizure but returns to normal quickly, imaging tests may be
done at a later point.[16] If a person has a previous
diagnosis of epilepsy with previous imaging, repeating the imaging is usually not needed even if
there are subsequent seizures.[62]
For adults, the testing of electrolyte, blood glucose and calcium levels is important to rule out
problems with these as
causes.[62] An electrocardiogram can rule out
problems with the rhythm of the heart.[62] A lumbar
puncture may be useful to diagnose a central nervous
system infection but is not routinely needed.[16] In
children additional tests may be required such as urine biochemistry and blood testing looking for metabolic disorders.
Figure 5.1 A classification and external resources
A high blood prolactin level within the first 20 minutes following a seizure may be useful to help
confirm an epileptic seizure as opposed
to psychogenic non-epileptic seizure.[17][18] Serum
prolactin level is less useful for detecting partial
seizures.[19] If it is normal an epileptic seizure is still
possible[18] and a serum prolactin does not separate
epileptic seizures from syncope.[20] It is not
recommended as a routine part of the diagnosis of
epilepsy.[42]
6. Post Processing
Undulated local and global feature
that in order to prevent the impending seizure by administrating drugs [1], the five minute window is
sufficient
.
IV. EXPERIMENTAL RESULTS A. Analysis
A statistical framework for this comparison, the expected performance of a chance predictor according to a predefined scoring rule, which is in turn used as the control in a hypothesis test. the expected performance of chance prediction using Monte Carlo simulations that generate random, simulated seizure warnings of variable duration.
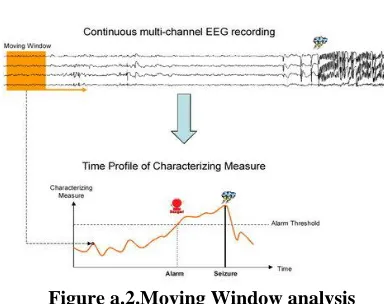
A figure a.1 represents the true and false warnings of alarm presiction of seizures and then figure a.2 shows that moving window anaklysis of the seizures A new test metric, the difference between algorithm and chance sensitivities given a constraint on proportion of time spent in warning, and use a simple spectral power-based measure to demonstrate the utility of the metric in four patients undergoing intracranial EEG monitoring during evaluation for epilepsy surgery. The methods are broadly applicable to other scoring rules. We present them as an advance in the statistical evaluation of a practical seizure advisory system.
A solution is suggested by the earlier observation that the sensitivity of a chance predictor
is approximately equal to ρw, the proportion of time
in warning. Therefore, the difference between
observed and chance sensitivity, subject to
matched ρw, is a powerful metric of predictive ability.
Figure a.1.Analysis of true and false warnings
Figure a.2.Moving Window analysis
It also offers appropriate behavior for limiting cases, being equal to zero if the warning
light is either permanently illuminated or
extinguished. For an algorithm with observed
sensitivity Sn and proportion of time in warningρw, it
follows from (1) and (2) that the sensitivity
improvement-over-chance metric is calculated as:
Sn−Snc=Sn−1+exp(−λwηw+(1−e−λwηw0)), (4)
where
λw=−1ηwln(1−ρw). (5)
In general, exact permutation tests may be
applied to the Studentized and/or rank-ordered observations involved in the sensitivity improvement
metric calculation to account for unknown
distributions and multiple-comparison testing in a patient population.
B.Patient and Data Characteristics
Multichannel digital intracranial EEG
recordings were obtained from Epilepsy Monitoring Units (EMUs) in Europe and the United States, with approval of the Institutional Review Boards of
universities contributing data to NeuroVista
Corporation under appropriate material transfer agreements, using approved (NBs/CE Mark in Europe, FDA in the US) clinical EMU equipment.
Recordings were meticulously checked for
misplugged or mislabeled electrodes, accurate seizure annotations, and electrode placement (validated by MRI). Only complete, continuous recordings were used for the present application, covering each patient's entire EMU stay. Data were normalized to have a common 16-bit dynamic range rescaled to microvolts, and sampling rate of 400 Hz.
C.Algorithm
channels of cortical potentials including electrodes placed on and surrounding the seizure focus, as well as a reference electrode well-separated from the focus. Multichannel referential EEG was first digitally remontaged to average reference. Each channel was pre-whitened by taking the first forward
difference, bandpass filtered to beta band
(implemented as 16-32 Hz corner frequencies in a Kaiser window FIR filter design), then subjected to feature extraction in a 5-second sliding window scheme displaced in 1-second increments. For each channel, the output feature every 1 second was the beta power
β[m]=12000∑k=m−1999mx2β[k], ----> (6)
where xβ[m] is the beta-filtered signal at time
index m. A feature vector at each time was formed by collecting the beta powers of all channels.The feature vectors collected over decimated time samples covering both preictal and interictal periods formed training inputs with which kNN classifiers (k=15 neighbors) were induced. The training outputs stored by the kNNs were integers {1,2} representing ―interictal‖ vs. ―90-minute preictal‖ classes.
This latter label was used for immediate training, keeping in mind that final ―preictal‖ labels are revealed only during actual scoring/testing in our framework (e.g., a warning could end up being 5 hours long thus scored as ―preictal,‖ with specificity-related metrics controlling for this asymmetry). When confronted with a new feature vector, kNN looks up the nearest neighbor in its training table, however, the simple estimate of preictal posterior probability (fraction of nearest neighbors belonging to preictal class) was employed instead. No adjustment was used for prior probabilities of the classes. When run as time-serial probability estimator, the kNN output was 60-point-Chebyshev filtered in preparation for smooth predictions. A prediction alert was issued
whenever the smooth probability output
met/exceeded a threshold. The threshold was algorithmically set such that, in-sample, percentage of time in warning tracked to 25%, however, the
relation to actual measured ρw over a test set is
inexact. This internal threshold can be fixed arbitrarily (recall our comparison to chance requires
only some ―final‖ Sn and ρw). The output of all
predictors were subjected to persistence processing
with parameters ηw = 90 minutes and ηw0 = 1 minute.
If seizures clustered within a 4-hour period, only the leading (first) seizure in that cluster was enforced for prediction scoring purposes, for reasons similar to those of earthquake prediction—the goal is prediction of main events rather than detection of aftershocks. The scoring of follow-up clustered seizures was treated as deleted or never-seen data. For example, if original data had seizure onsets indicated as [0 0 0 0
1 0 0 0 0 1 0 1 1 0 0 0 0 1], the removal of clustered seizures looked like [0 0 0 0 1 0 0 0 0 1 0 0 0 0 1]. Once these labels were fixed, the treatment of candidate predictors and the theoretical chance predictor against which we compare remains equitable and consistent with the theory. Without loss
of generality, the estimation of expected Sn, ρw,
and rw for each patient was based on N-fold cross
validation, where N is the number of leading seizures, with data assigned to folds in approximately 3-hour epochs.
D. Graphical representation
A graphical representation of figure d.1 and d.2 that shows the different rhythm for the with prominent alpha and without alpha rhythm for the EEG signals waveform of seizure prediction from epilepsy patients.
Figure d.1. 400px-Human EEG without alpha rhythm
These results are presented not to suggest that they are adequate for a clinical seizure warning device, but rather to illustrate the translation of the methods presented in this paper into a practical warning system for patient use. A more accurate prediction of algorithm would be required to obtain clinically
useful results, along with careful consideration of
performance targets required for clinical utility , which might vary according to individual patients.
Figure d.2. 400px-Human EEG with prominent alpha rhythm
seizures.[9] EEG is not indicated for diagnosing
headache.[10] Recurring headache is a common pain
problem, and this procedure is sometimes used in a search for a diagnosis, but it has no advantage over
routine clinical evaluation.[10]
E.Results
The output results are wshown on below figure e.1-e.4. these are shown the original eeg datas are taken from the patients EEG signal waveforms.
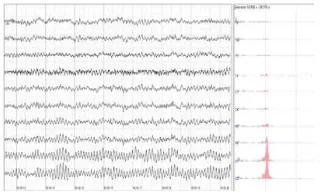
Figure e.1 : EEG signal for epileptic patients
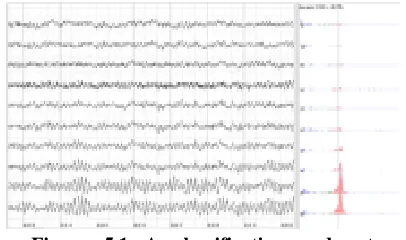
This Undulated Global Features are shown in below figure e.2. To identify a particular signal type (i.e. ictal, interictal, or preictal period) an EEG signal is divided into small epochs or time-windows.
Figure e.2 : Undulaterd Global Feature Extraction (UGF)
The figure e.3 shous that Undulaterd Local Feature Extraction (ULF).It is to be noted that in order to prevent the impending seizure by administrating drugs [1], the five minute window is
sufficient. The seizure prediction result as a decision
is taken in each five minute window based on the two-step decision. In each step, different sized windows were investigated; however the proposed two-step method is the best regarding the PA and FPR
Figure e.3 : Undulaterd Local Feature Extraction (ULF)
The below figure e.4 shows that the output decision values for its different classification of the SVM(Support Vector Machine).
Figure e.4 : Classification of SVM(Support Vector Machine).
When classification of epilepsies focuses on the underlying causes. When a person is admitted to hospital after an epileptic seizure the diagnostic workup results preferably in the seizure itself being classified (e.g. tonic-clonic) and in the underlying
disease being identified (e.g. hippocampal
sclerosis).[62]
F.
Brain Computer Interface (BCI)A brain–computer interface (BCI),
sometimes called a mind-machine
interface (MMI), direct neural interface (DNI),
or brain–machine interface (BMI), is a direct
communication pathway between an enhanced or wired brain and an external device. BCIs are often
directed at researching, mapping, assisting,
augmenting, or repairing human cognitive or sensory-motor functions. Neuroprosthetics is an area of neuroscience concerned with neural prostheses, that is, using artificial devices to replace the function of impaired nervous systems and brain related problems, or of sensory organs. The most widely
used neuroprosthetic device is the cochlear
implant which, as of December 2010, had been
implanted in approximately 220,000 people
worldwide.[7] There are also several neuroprosthetic
devices that aim to restore vision, including retinal implants.
0 100 200 300 400 500 600 700
-300 -250 -200 -150 -100 -50 0 50 100 150
Global Feature
epoch
M
E
C
R
0 100 200 300 400 500 600 700
21.4965 21.497 21.4975 21.498 21.4985 21.499 21.4995
Local Feature
Epoch
C
F
D
0 0.5 1 1.5 2 2.5
x 105 0
0.1 0.2 0.3 0.4 0.5 0.6 0.7 0.8 0.9
1 output
SVM Classification
D
e
cis
io
n
V
a
lu
Figure f.1 : 220pxElectroencephalograph -Neurovisor-BMM40
The difference between BCIs and
neuroprosthetics is mostly in how the terms are used: neuroprosthetics typically connect the nervous system to a device, whereas BCIs usually connect the brain (or nervous system) with a computer system. Practical neuroprosthetics can be linked to any part of
the nervous system—for example, peripheral
nerves—while the term "BCI" usually designates a narrower class of systems which interface with the central nervous system.
The terms are sometimes, however, used interchangeably. Neuroprosthetics and BCIs seek to achieve the same aims, such as restoring sight, hearing, movement, ability to communicate, and
even cognitive function. Both use similar
experimental methods and surgical techniques.
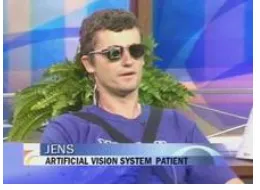
i. Vision
Jens Naumann, a man with acquired blindness, being interviewed about his vision BCI on CBS's The Early Shows figure f.1. Jens Naumann, a man with acquired blindness, being interviewed about his vision BCI on CBS's The Early Show
Invasive BCI research has targeted repairing damaged sight and providing new functionality for people with paralysis. Invasive BCIs are implanted directly into the grey matter of the brain during neurosurgery. Because they lie in the grey matter, invasive devices produce the highest quality signals of BCI devices but are prone to scar-tissue build-up, causing the signal to become weaker, or even
non-Figure f.1 : Jens Naumann, a man with acquired blindness, being interviewed about his vision BCI
on CBS's
existent, as the body reacts to a foreign object in the brain.
ii. Movement[edit]
BCIs focusing on motor
neuroprosthetics aim to either restore movement in individuals with paralysis or provide devices to assist them, such as interfaces with computers or robot arms.
iii. Partially invasive BCIs[edit]
Partially invasive BCI devices are implanted inside the skull but rest outside the brain rather than within the grey matter. They produce better resolution signals than non-invasive BCIs where the bone tissue of the cranium deflects and deforms signals and have a lower risk of forming scar-tissue in the brain than fully invasive BCIs. There has been preclinical demonstration of intracortical BCIs from the stroke perilesional cortex.
iv. Non-invasive BCIs[edit]
There have also been experiments in humans
using non-invasive neuroimaging technologies as
interfaces. The substantial majority of published BCI work involves noninvasive EEG-based BCIs. Noninvasive EEG-based technologies and interfaces have been used for a much broader variety of applications.
V. CONCLUSIONS
This algorithm is used to show how the evaluation scheme works to identify, accept, and reject predictive results, and how a candidate predictor can show statistically honest superiority over chance without necessarily involving extreme complexity. an appropriately powered, controlled study showing prospective prediction from EMU data is warranted to guide the development of a clinically useful, patient-oriented, seizure advisory system. The data set has continuous data within interictal or preictal EEG signals, however, there is no clear chronological order between interictal and preictal signals. Due to the lack of publicly available data set, it is not possible to test the performance of the proposed technique against other relevant techniques using true continuous data.
It has some complexity for the feature extraction of the epilepsy of seizure. This is also have the monitoring system of the epilepsy for the patients monitoring system requirements. It is reliable for the patients monitoring system for the support vector machines.
REFERENCES
state similarity. ClinicalNeurophysiology, 124, pp. 1745-1754. [2] K. Gadhoumi, et al. (2015). Seizure prediction for therapeutic
devices: A review. Journal of Neuroscience Methods. [3] K. Gadhoumi, et al. (2015). Scale Invariance Properties of
Intracerebral EEG Improve Seizure Prediction in Mesial Temporal Lobe Epilepsy. PLoS ONE, 10, p. e0121182. [4] M. Winterhalder, et al. (2003). The seizure prediction
characteristic: a general framework to assess and compare seizure prediction methods.
Epilepsy & Behavior, 4, pp. 318-325.
[5] F. Mormann, et al. (2007). Seizure prediction: the long and winding road. Brain, 130(2), pp. 314-333.
[6] D. E. Snyder, et al. (2008). The Statistics of a Practical Seizure Warning System. Journal of Neural Engineering, 5(4), pp. 392-401.
[7] A. Aarabi and B. He. (2014). Seizure prediction in hippocampal and neocortical epilepsy using a model-based approach. ClinicalNeurophysiology, 125(5), pp. 930-940. [8] K. A. Davis, et al. (2016). Mining continuous intracranial
EEG in focal canine epilepsy: Relating interictal bursts to seizure onsets. Epilepsia, 57(1), pp. 89-98.
[9] L. Yunfeng, et al. (2014). Noninvasive Imaging of the High Frequency Brain Activity in Focal Epilepsy Patients. IEEE
Transactions onBiomedical Engineering, 61(6), pp. 1660-1667.
[10] J.R. Williamson, et al. (2012, Oct). Seizure prediction using EEG spatiotemporal correlation structure. Epilepsy &
Behavior, 25 (2), pp. 230–238.
[11] L. Chisci, et al. (2010, May). Real-Time Epileptic Seizure Prediction Using AR Models and Support Vector Machines.
IEEE Transactions onBiomedical Engineering, 57(5), pp.
1124-1132.
[12] P. Mirowski, et al. (2009, Nov). Classification of patterns of EEG synchronization for seizure prediction. Clinical
Neurophysiology, 120(11), pp. 1927-1940.
[13] S. Li, et al. (2013, Oct). Seizure Prediction Using Spike Rate of Intracranial EEG. IEEE Transactions on Neural Systems and
Rehabilitation Engineering, 21(6), pp. 880-886.
[14] N. Moghim and D. W. Corne. (2014, Jun). Predicting Epileptic Seizures in Advance. PLoS ONE, 9(6), e99334. [15] J. Rasekhi, et al. (2013). Preprocessing effects of 22 linear
univariate features on the performance of seizure prediction methods. Journal ofNeuroscience Methods, 217, pp. 9–16. [16] EEG Data Set: Epilepsy Center of the University Hospital of
Freiburg. (2012, June 10). Available: http://epilepsy.uni-freiburg.de/freiburg-seizure-prediction-project/eeg-database. [17] L. Ding, et al. (2009). Three-dimensional Imaging of
Complex Neural Activation in Humans from EEG. IEEE
Transactions on BiomedicalEngineering, 56(8), pp.1980–1988.
[18] M. Paul, et al. (2011). Direct Intermode Selection for H.264 Video Coding Using Phase Correlation. IEEE Transactions on
ImageProcessing, 20(2), pp. 461-473.
[19] Y. Xie, et al. (2014, Jan). A physics-based defects model and inspection algorithm for automatic visual inspection. Optics
and Lasers inEngineering, 52 (2014), pp. 218-223.
[20] M. Z. Parvez and M. Paul. (2015, Feb). Epileptic seizure detection by exploiting temporal correlation of electroencephalogram signals. IETSignal Processing, 9(6), pp. 467–475.
[21] V. Bajaj and R.B. Pachori. (2013, Mar). Epileptic seizure detection based on the instantaneous area of analytic intrinsic mode functions of
[22] EEG signals. Biomedical Engineering Letters, 3(1), pp. 17-21. [23] W. Zhou, et al. (2013, Apr). Epileptic Seizure Detection
Using Lacunarity and Bayesian Linear Discriminant Analysis in Intracranial EEG. IEEE Transactions on Biomedical
Engineering, 60(12), pp. 3375-3381.
[24] M. Paul, et al. (2014, Oct). A Long Term Reference Frame for Hierarchical B-Picture based Video Coding. IEEE
Transactions onCircuits and Systems for Video Technology, 24
(10), pp. 1729-1742.
[25] S. Abe, Support vector machine for pattern classification, Springer, 2010.
[26] S. Mihandoost, et al. (2012). Automatic feature extraction
using generalised autoregressive conditional
heteroscedasticity model: an application to
electroencephalogram classification. IET Signal Processing, 6(9), pp. 829-838.
[27] R. B. Pachori and V. Bajaj. (2011, Dec). Analysis of normal and epileptic seizure EEG signals using empirical mode decomposition.
Computer Methods and Programs in Biomedicine, 104(3), pp. 373-381.
[38] S. Santaniello, et al. (2011, Dec). Quickest detection of drug-resistant seizures: An optimal control approach. Epilepsy &
Behavior, 22(2011),
a. S49-S60.
[39] Y. Park, et al. (2011, Oct). Seizure prediction with spectral power of EEG using cost-sensitive support vector machines.
Epilepsia, 52(10),
a. 1761-1770.
[40] Y. Tang and D.M. Durand. (2012, Mar). A tunable support vector machine assembly classifier for epileptic seizure detection. ExpertSystems with Applications, 39 (4), pp. 3925– 3938.
[41] M. Guttinger, et al. (2005, May). Seizure suppression and lack of adenosine A1 receptor desensitization after focal long-term delivery of adenosine by encapsulated myoblasts.
Experimental Neurology, 193(1),
a. 53–64.
[42] O. A. Rosso, et al. (2003, June). Wavelet analysis of generalized tonic-clonic epileptic seizures. Signal Processing, 83 (6), pp. 1275–1289.
[43] V. L. Dorr, et al. (2007, July). Extraction of reproducible seizure patterns based on EEG scalp correlations. Biomedical
Signal Processingand Control, 2(3), pp. 154–162.
[44] F. H. Lopes da Silva. (2008). The impact of EEG/MEG signal processing and modeling in the diagnostic and management of epilepsy.
IEEE Reviews in Biomedical Engineering, 1, pp. 143–156. [45] M. Z. Parvez and M. Paul. (2014, Dec). Epileptic seizure
detection by analyzing EEG signals using different transformation techniques. Neurocomputing, 145, pp. 190-200.
[46] M. J. Cook, et al. (2013). Prediction of seizure likelihood with a long-term, implanted seizure advisory system in patients with drug-resistant epilepsy: a first-in-man study.
The Lancet Neurology, 12, pp. 563-571.
[47] M. Le Van Quyen, et al. (2001). Anticipation of epileptic seizures from standard EEG recordings. The Lancet, 357, pp. 183-188.
[48] F. Mormann, et al. (2003). Epileptic seizures are preceded by a decrease in synchronization. Epilepsy Research, 53, pp. 173-185.
[49] L. D. Iasemidis, et al. (2003). Adaptive epileptic seizure prediction system. IEEE Transactions on Biomedical Engineering, 50, pp. 616-627.
[50] K. Lehnertz and C. E. Elger. (1998). Can Epileptic Seizures be Predicted? Evidence from Nonlinear Time Series Analysis of Brain Electrical Activity. Physical Review Letters, 80, pp. 5019-5022.