~ 175 ~ WWJMRD2017; 3(10): 175-180
www.wwjmrd.com International Journal Peer Reviewed Journal Refereed Journal Indexed Journal UGC Approved Journal Impact Factor MJIF: 4.25 e-ISSN: 2454-6615
N. Shenbagaraj Senior Research Fellow, Department of Remote Sensing and GIS, Tamil Nadu Agricultural University, Coimbatore District, Tamil Nadu, India
Correspondence: N. Shenbagaraj Senior Research Fellow, Department of Remote Sensing and GIS, Tamil Nadu Agricultural University, Coimbatore District, Tamil Nadu, India
Methods of Shoreline Demarcation and Validation
using Remote Sensing and GIS
N. Shenbagaraj
Abstract
The shoreline is one of the rapidly changing linear features in the coastal zone. The shoreline identification is very difficult because it is dynamic in nature. It is base feature for identifying the shoreline changes and future prediction. In this study, supervised classification, unsupervised classification, grey level threshold method, non-directional edge detection and band ratio method have been applied to demarcate the shoreline from Landsat 7 ETM+ sensor 2009 image and validated by the visual interpreted shoreline. Shoreline validation based from the length of shoreline and shoreline distance from the baseline. The length of shoreline from visual interpretation, band ratio and NIR band threshold method is more or less same and validated based from the graph.
Keywords: shoreline, supervised, unsupervised, grey level threshold, non-directional edge detection, band ratio, visual interpretation and DSAS
Introduction
The shoreline is the edge of land at the border of a large body of water. It is one of the dynamic geographic features and historically, ecologically, economically important feature of the coastal area. An idealized definition of the shoreline is that it coincides with the physical interface between land and water (Usha natesan et al. 2013). It continuously fluctuates due to the action regular action of waves and tides. The boundary of the shore is identified by the shoreline at its closest to sea (low tide) and closest to land (high tide). Tides are generated by the periodic rice and fall of the sea water produced by the differential attraction of the sun and moon on the ocean (D.S. Lal., 2012). The shoreline experiences only one low tide and high tide is called diurnal tide. Some locations experience the semi diurnal tide, this locations nearly two equal high tide and low tides occurred in every day. The coastline of India has length of 7517 km. Tamil Nadu has 1076 km coastline it constitutes of 15 percentage of India’s coastline. The International Geographic Committee recognizes shoreline as one of the 27 most important features to mapped and monitored (Usha natesan et al. 2013). Shoreline is base for the study of shoreline changes, identify the vulnerability zones. It was used to the future prediction and coastal zone management. Shoreline demarcation is very difficult in previous years it takes lot of man power and huge amount of money after introducing the satellite image is very easy. Various image processing techniques is available to extract the shoreline from images but which one is best for demarcation it is difficult. In this study focused to detect the suitable method for shoreline extraction. Poornima K.V and Sravan Chinthaparthi (2014) have been classified the image for land and sea using maximum likelihood classification method. In 2014, Nazirah Md. Tarmizi et al. shoreline has been extracted from the Isodata classification, band ratio, density slicing, and mahalanobis distance classification methods. Grey level thresholding technique applied in NIR band and edge segmentation to detect the shorelines (Sabyasachi Maiti et al.
2009). Khalid M. Dewidar et al. (2010) in their study, threshold method was applied in 4th
band of MSS and 7th band of TM/ETM+ sensor images to convert the binary image. The
threshold value was taken from the mean value of an image and adjusted the threshold value to get a binary image (Qu Jishuany et al. 2002). Kaliraj. S et al. (2013) in their study non-linear edge enhancement techniques ware used to extract the shorelines. Thresholding
~ 176 ~
directional edge detection method, band ratio method and visual interpretation method. Visually interpreted shoreline based all other shorelines are validated from the distance and length of shoreline.
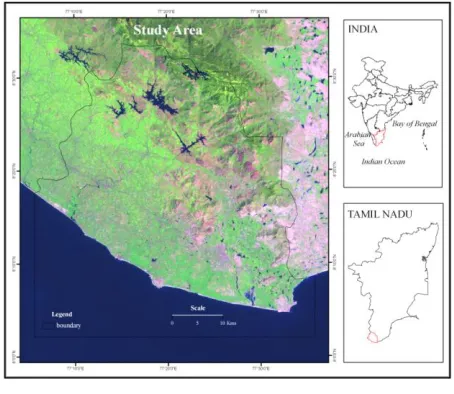
Study area
Kanyakumari district is located in the southern tip of peninsular India. It is geographically located in between
77o5’29.057”E to 77o34’53.618”E and 8o2’34.307”N to
8o34’37.522”N. This district has 44 fishing villages.
Colachel port and chinnamuttam harbour are located along the western side of the study area. Many tourist spots, cultural sites and archaeological sites are found in the coastal area of this district. The southern parts of the coast are sandy beaches containing heavy minerals on the eastern and western side of Kanyakumari. Garnet, Illimenite, Monazite, Thorium and Gypsum are the main mineral resources of this coast. Fig. 1 represents the study area.
Fig. 1: Study Area
Materials and Methods
some pixels from an image based from the color, tone, texture and pattern which is called training sites. The training sites based the image processing software classify the remaining pixels in an image. In this study two different classifiers used to extract the shorelines. The first one is maximum likelihood classifier and another one is mahalanobis distance classifier.
Maximum likelihood classifier
The maximum likelihood classifier is one of the most popular methods of classification in remote sensing, in which a pixel with the maximum likelihood is classified into the corresponding class. This method determines the variance and covariance of each feature providing the probability function. This is then used to classify an unknown pixel by calculating for each area, the probability that it lies in that class. The pixel is then assigned to the most likely class or if its probability value fails to reach any close defined threshold in any of the class, be labeled as classified.
Mahalanobis distance classifier
The Mahalanobis distance classification is a direction-sensitive distance classifier that uses statistics for each class. It is similar to the maximum likelihood classification but assumes all class covariance are equal and therefore is a faster method. All pixels are classified to the closest ROI class unless you specify a distance threshold, in which case some pixels may be unclassified if they do not meet the threshold.
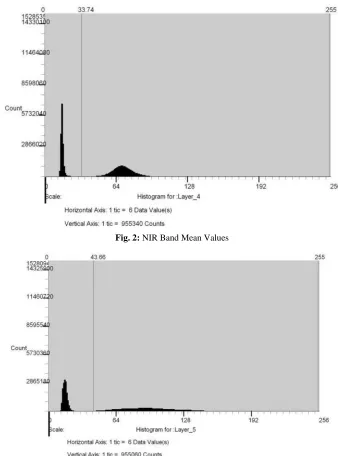
Grey Level Thresholding
~ 177 ~
Fig. 2: NIR Band Mean Values
Fig. 3: MIR Band Mean Values
Unsupervised Classification
In this classification, the image processing software can be
automatically grouping the pixels with common
characteristics in an image depending on their spectral features. The user can specify the number of classes the software will produce the result.
Non-Directional Edge Enhancement
Enhancement is used to improve the quality of an image. Non-directional edge enhancement process is a spatial based. Spatial-based Enhancement means modifies a pixel’s values based on the values of the surrounding pixels. Sobel filter has been used to enhance the images.
Band Ratio Method
Green, NIR and MIR band have been used to in band ratio method. First segmented image derived from the threshold value based in MIR band and the second one get from the ratio of Green/NIR and Green/ MIR. Water pixel will be greater than one. The both images were multiplied for rejecting the mistakes. The shoreline derived from this image.
Visual Interpretation Method
The users have more capability of the knowledge to interpret land cover features in an image, which is more effective than that of a computer. A computer is very good at consistently applying a specific set of rules to classify an image, but unfortunately in the "real world" these rules are
not clear-cut or necessarily static (Horning, N. 2004). The
red, NIR and MIR band combination was used to digitize the shorelines.
Transect Creation
~ 178 ~
(Deren Li et al. 2009). Anirban Mukhopadhyay et al. have demarcated the shoreline from ISODATA classification. In this study, some forest area comes under the water body in unsupervised classification. This method is very simple compared than others. Fig. 8 portrays the unsupervised classified image. Fig. – 9 indicate the sobel non-directional edge enhancement filtered image. Erdas Field Guide described the non-directional edge enhancement is Averages the results from two orthogonal 1st derivative. Fig.10. Describes the band ratio method used segmented image. Band ratio method is one of the widely used methods for segmentation. Green, NIR and MIR band was used. The first image get from the histogram thresholding method is used on NIR band for separating land from water. The second image derived from ratio of green/NIR and green/MIR. Green and NIR ratio is useful for separating land from vegetation, green and MIR ratio for separating non-vegetation land. Water pixels will be greater than one. The both images multiplied and get the final image. This image has been used for demarcate the shoreline. Fig.11 display the visually interpreted shoreline from the 5, 4, 3 band combination in an satellite image.
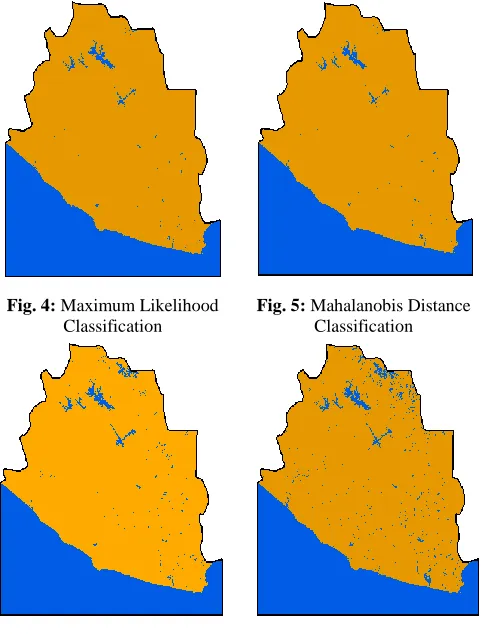
Fig. 4: Maximum Likelihood Classification
Fig. 5: Mahalanobis Distance Classification
Fig. 8: Unsupervised classification
Fig. 9: non-directional edge enhancement filtered image
Fig. 10: Band Ratio Fig. 11: Visually Interpreted Shoreline
The shorelines are validated based on the visual interpreted shoreline. For all method of shoreline extractions the shoreline length was considered the visually interpreted shoreline, band ratio method was used to extract the shoreline and the grey level threshold method was applied in the NIR band to detect the shoreline was more or less same. Table 1 shows the different methods employed to extract the shoreline lengths in kms.
Table 1: Shoreline Length in Different Methods
Methods of Shoreline Extraction Length in kms.
~ 179 ~
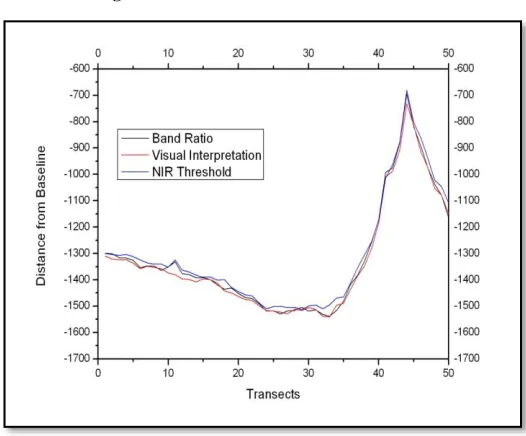
Fig. 12: Transect and its distance from baseline
Fig. 13: Transects and its distance from baseline
Fig. 12 portrays the graph for transects and the shoreline distance from the base line. It looks all methods of extraction shoreline was same. So the first 50 transects was taken for analysis. Fig. – 13 displays the graph for transects and the Band ratio, visual interpretation and grey level threshold in NIR band method used to extract the shoreline distance from the base line. These three shoreline length was almost same so it was taken to validation analysis. The graph was clearly display the band ratio method used to extract the shoreline is nearly to the visually interpreted shoreline.
Conclusion
The shoreline feature is important for further analysis but identification is very difficult. Before introducing the remote sensing shoreline feature was getting from the field survey. It will take lot of time, man power and money. Now days, various image processing techniques have been used to extract feature from satellite images. Remote sensing and GIS is very useful for decision making in short term period.
References
1. Ali Kourosh Niya., Ali Asghar alesheikh., Mohen
Soltanpo., and Mir Masoud Kheirkhahzarkesh. Shoreline Change Mapping Using Remote Sensing and GIS, International Journal of Remote Sensing Applications, 2013, 3, 102-107.
2. Anirban Mukhopadyal., Sandip Mukherje., Samadrita
Mukherjee., subhajit Ghosh., sugata Hazra., and Debasish Mitra. Automatic shoreline detection and future prediction: A case study on Puri Coast, Bay of Bengal, India, European Journal of Remote Sensing, 2012, 45, 201-213.
3. D.S. Lal. Oceanography, Sharda Pustak Bhawan,
Allahabad, 2012, 201.
4. Deren Li, Jie Shan and Jianya Gong. Geospatial
Technology for Earth Observation, 2009. 480, https://books.google.co.in/books?isbn=1441900500
5. ERDAS Field Guide. Leica Geosystems, Geospatial
Imaging, LLC, Norcross, Georgia, 2005, 143.
6. Horning. N. Justification for using photo interpretation
methods to interpret satellite imagery - Version 1.0, American Museum of Natural History, Center for
Biodiversity and Conservation,
http://biodiversityinformatics.amnh.org, 2004.
7. Khalid M. Dewidar., and Omran E. Frihy. Automated
techniques for quantification of beach change rates using Landsat series along the North-eastern Nile Delta, Egypt, Journal of Oceanography and Marine Science, 2010, 1(2), 028-039.
8. Nazirah Md. Tarmizi. Abd Manan Samad., Mohd
~ 180 ~
Remote Sensing Images: A Threshold – Based Morphological Approach, Published in Geoscience and Remote Sensing Symposium, 2002, 3420-3422.
12. S. Kaliraj., N. Chandrasekar., and N.S. Magesh.
Impacts of wave energy and littoral currents on shoreline erosion/accretion along the south-west coast of Kanyakumari, Tamil Nadu using DSAS and geospatial technology, Journal of Environmental Earth Sciences, 2013, 71, 4523-4542.
13. Sabyasachi Maiti., and Amit K. Bhattacharya.
Shoreline change analysis and its application to prediction: A remote sensing and statistics based approach, Journal of Marine Geology, 2009, 257, 11-23.
14. Thomas M. Lillesand., and Ralph M. Kiefer. Remote
Sensing and Image Interpretation, John Wiley & Sons, New York, Chichester, Brisbane, Toronto, Singapore, 1994, 19.
15. Usha Natesan, Thulasiraman, N., Deepthi, K., and