1 Origins and Probabilities of MEP and Structural Design Clashes within a Federated BIM 1
Model 2
3
Pärn, E.A.1, Edwards, D.J.2 and Michael, C.P. Sing3 4
5 6
1Faculty of Technology Environment and Engineering, Birmingham City University 7
City Centre Campus, Millennium Point, Birmingham B4 7XG, United Kingdom 8
Email: [email protected] (Corresponding Author) 9
10 11
2Faculty of Technology Environment and Engineering, Birmingham City University 12
City Centre Campus, Millennium Point, Birmingham B4 7XG, United Kingdom 13
Email: [email protected] 14
15 16
3Department of Building and Real Estate 17
7/F, Block Z, The Hong Kong Polytechnic University 18
Email: [email protected] 19
2 Origins and Probabilities of MEP and Structural Design Clashes within a Federated BIM 23
Model 24
25
ABSTRACT 26
‘Design clashes’ encountered during the development of a large multi-storey educational building, 27
awarded under a Joint Contracts Tribunal (JCT) Design and Build contract, are reported upon. The 28
building was developed in Birmingham, UK and the contract value was circa £36 million (UK 29
Sterling, 2015). Members of the project management team (PMT) produced designs that were 30
subsequently integrated by the main contractor into a federated building information modelling 31
(BIM) model; at this stage 404 error clashes were evident between the positions of the mechanical, 32
electrical and plumbing (MEP) designer’s and structural designer’s building compartments. The 33
contractor deemed that these particular clashes were ‘mission critical’ as previous experience 34
suggested that project costs could spiral uncontrollably if left unabated. Participatory action 35
research was employed to acquire a deeper understanding and knowledge of the clash incidents. 36
Clash data accrued (in mm) was subsequently quantitatively modelled using the probability 37
density function (PDF) and the cumulative distribution function (CDF). Two models produced 38
were the Log Logistic Three Parameter (3P) (using all data including outliers) and Generalized 39
Gamma distribution (excluding outliers). Both models satisfied Anderson-Darling and 40
Kolmogorov-Smirnov goodness of fit tests at 𝛼 0.01 and 0.02 levels of significance. Model 41
parameters could be used to forecast similar clashes occurring on future projects and will prove 42
invaluable to PMT members when accurately estimating the time and resource needed to integrate 43
BIM designs. The predictive modelling revealed that 92.98% of clashes reside within the 30-299 44
mm range while the most probable occurrence of a clash overlap resides in a discrete category of 45
100-199mm. Further qualitative investigation is also conducted to understand why these clashes 46
occurred and propagate ideas about how such may be mitigated. The research concludes on two 47
important points, namely: i) BIM is not a panacea to design related construction project rework 48
and that innovative 21st century digital technologies are hampered by 20th century management 49
practices; and ii) improvements in clash and error mitigation reside in a better understanding of 50
tolerances specified to alleviate the erroneous task of resolving unnecessary clashes. Future 51
research is proposed that seeks to: automate the clash detection management, analysis and 52
3 management influences impacting upon design clash propagation; and devise and validate new 54
procedural methods to mitigate clash occurrence using a real-life project. 55
56
KEYWORDS 57
Building information modelling, clash detection, probability density function, cumulative 58
distribution function, Generalized Gamma distribution, Log Logistic (3P) distribution. 59
60
INTRODUCTION 61
The digital jacquerie transcends the narrow confines of the information and communication 62
technology sector and is ubiquitous throughout all industry (Edwards et al., 2016). This paradigm 63
shift in business and commerce has been enabled through the application of cloud computing (Park 64
and Ryoo, 2013). Cloud computing is advantageous to all organizations (large and small) because 65
utilizing internet-based services can reduce start-up costs, lower capital expenditures and increase 66
computational power to augment business/ market intelligence (Chen and Lin, 2012). A menagerie 67
of ‘networked’ digital devices employed within the workplace generate vast quantities of data, 68
information and knowledge that can be further exploited via automated and intelligent analytics 69
(Dutta and Bose, 2015). Business intelligence and concomitant data analysis have the inherent 70
potential to uncover patterns, trends and associations related to design data, human behavior, and 71
the interactions between the two, for improved decision making (Manyika et al., 2011; Russom, 72
2013). Indeed, the extant literature postulates (cf. Shollo and Galliers, 2016; Seddon et al., 2016) 73
that business intelligence enables organizations to gain value from business analytics. 74
Multitudinous benefits of digitization have similarly been promulgated within the architecture, 75
engineering, construction and owner-operated (AECO) sector (Love et al., 2015). Prominent 76
digital technologies include: sensors (Park et al., 2016); laser scanners (Oskouie et al., 2016); 77
machine vision (Teizer, 2015); and building information modelling (BIM) (Ben-Alon and Sacks, 78
2017). Amalgamated, these technologies have spearheaded the advancement of the digital 79
construction modus operandi (Zhou et al., 2012). BIM is ostensibly the most prevalent of these 80
advanced technologies within extant literature and is gradually becoming conventional in both 81
design and construction practice globally (Liu et al., 2016). BIM provides a digital portal through 82
which an integrated project management team (PMT) can collaboratively work upon, and share 83
4 (Ciribini et al., 2016; Wetzel and Thabet, 2016). This innovative approach enables PMT members 85
to enhance their inter-disciplinary interactions in order to optimize resultant decisions and afford 86
greater whole life value for the asset (Love et al., 2016). 87
88
During the design stages of pre-construction, BIM drawings and plans produced by individual 89
designers (e.g. the architect, structural engineer and mechanical, electrical and plumbing (MEP) 90
designer) are integrated into a federated model and tested to identify design clashes (Bagwat and 91
Shinde, 2016). Design clashes consist of ‘positioning errors’ where building components overlap 92
each other when the original individual designer models are merged. Resolving these design 93
clashes is imperative to project performance, particularly if costly rework is to be circumvented 94
during the construction phase. However, design clash mitigation and the utilization of 95
deterministic modelling to enhance decision making are two areas that have been grossly 96
overlooked within the literature (Won and Lee, 2016; Jones and Bernstein, 2014). Given scant 97
research within this important area and the opportunity to improve construction business 98
performance, this work reports upon the findings of participatory action research (PAR) which 99
sought to examine design error clashes that occurred during the compilation of a federated BIM 100
model for a multi-storey educational building development. Such work provides invaluable insight 101
into a previously unexplored area of digital built environment research. The research objectives 102
are to: better understand why clashes occur and engender wider academic debate; demonstrate 103
how the probability density function (PDF) and cumulative distribution function (CDF) can 104
accurately predict the probability of future occurrence for a specific project; formulate innovative 105
ideas for reducing their occurrence and mitigating their impact upon construction business 106
processes and performance; and suggest future work that seeks to maximize business intelligence 107
through automation and apply the deterministic techniques adopted to a larger number of project 108
developments as a means of generalizing the findings. 109
110
DESIGN ERRORS WITHIN DIGITAL CONSTRUCTION 111
Design errors are a prominent root cause of diminished construction project performance and 112
manifest themselves as adverse symptoms such as: rework (Lopez et al., 2010; Li and Taylor, 113
2014; Love, and Sing, 2013); cost overruns (Love et al., 2014; Love et al., 2013); schedule delays 114
5 sources of design error are inextricably linked to iterative and recurrent design cycles that result 116
from: unanticipated changes (Lee et al., 2005); poor management and communication (Arayici et 117
al., 2012); realignment of traditional/ institutionalized organizational and human resource 118
practices (Porwal and Hewage, 2013); and interoperability between various software platforms 119
(Merschbrock and Munkvold, 2015). These challenges have engendered frenzied research activity 120
and resulted in the: development of system dynamics models for planning and control (Lee et al., 121
2005); identification of critical design management factors (Whang et al., 2016); and examination 122
of causal factors (Forcada et al., 2016). Despite this herculean effort, anecdotal evidence from 123
industry reveals that design errors remain a persistent problem. 124
125
BIM offers a potential digital solution space for design error management as a collaborative and 126
inclusive platform (Solihin et al., 2016). Yet to date, limited research has investigated whether 127
BIM in the AECO sector is effectively mitigating digital design errors. Love et al., (2010) further 128
proffer that the process of design error mitigation implies that: 129
130
“…learning from errors is a collective capacity that can produce individual, 131
organizational, and interorganisational error prevention practices.” 132
133
Successful error mitigation should therefore nurture learning from within individual design 134
disciplines to encapsulate the entire project team (ibid). BIM inherently offers this potential but as 135
the first stage of design error mitigation, clash detection and consequential resolution between 136
design team members has received scant academic attention. Amongst the various structural 137
elements, MEP design errors have traditionally dogged the design process, arguably due to the 138
confined spaces left for MEP systems (Tatum et al., 1999). Recent research conducted by 139
Peansupap and Ly (2015) examined five categories of structural and MEP related design errors, 140
but the study was confined to schedule delays and omitted any discussion on how BIM can 141
facilitate error mitigation at the detailed design stages. Research that has examined design clashes 142
in a BIM environment remains anecdotal or based upon a limited scope of analysis (Al Hattab and 143
Hamzeh, 2015; Allen et al., 2005; Won and Lee, 2016). 144
6 When reporting upon design clashes, the main contractor produces periodic clash detection reports 146
that contain information including: i) thematic groupings of clashes that report upon individual 147
clashes within each compartment category (for example, and in this research ‘MEP vs building 148
column’ and ‘MEP vs building frame’); ii) snapshots of every clash identified to aid 149
communication with all designers throughout the PMT; iii) clash point co-ordinates (as x, y and z 150
coordinates) to determine the exact pin-point location of the clash within the federated BIM model; 151
iv) the date that the clash was found; v) clash status (active and unresolved or resolved); vi) a 152
written description of the clash; and vii) a numerical value in metres (m) or millimetres (mm) that 153
specifies the linear magnitude of the positional (clash) error. Manual data cleansing is then 154
undertaken by the contractor’s BIM manager using industry nomenclature to define four key clash 155
categories, namely: i) clash errors –fault clashes that must be identified and resolved within the 156
federated model; ii) pseudo clashes – permissible fault clashes that can be tolerated within the 157
design and do not require resolution; iii) deliberate clashes – intentional clashes, for example, 158
ducting through a floor or web of a structural steel component; iv) duplicate clashes – multiple 159
versions of the same ‘singular clash’ that are repeated throughout a building (e.g. an MEP pipe 160
that travels along the entire length of a structural column will be observed and recorded numerous 161
times even though it actually represents one error). Duplicate clashes often originate from one of 162
the three other variantsof clash. 163
164
RESEARCH APPROACH 165
The research design employed participatory action research (PAR) (cf. Chevalier and Buckles, 166
2013; Smith et al., 2010) where the lead researcher was embedded within, and worked closely 167
with, the PMT to develop various aspects of the BIM model. The PMT included the client’s 168
representatives (i.e. the building’s estates department) and design related disciplines (including 169
the BIM process manager, the lead architect, contractor’s construction manager, the contractor’s 170
BIM manager, principle designer for mechanical engineering and plumbing and the lead structural 171
engineer). Note that the estate’s department held four fundamental roles, namely that of: client’s 172
representative; BIM process manager; project manager; and estates department and consequently, 173
covered all three major phases of the building’s life cycle. PAR was adopted because it offers 174
pluralistic orientation to knowledge creation and change thus affording greater flexibility to 175
7 reputation and consequential profitability. This approach to self-experimentation grounded in 177
experience was augmented by: fact-finding, to acquire a deeper knowledge and understanding 178
(Pain et al., 2012; Mapfumo et al., 2013); learning, through a recurrent process of reflection 179
(Kornbluh et al., 2015); and evidential reasoning to interpret information and knowledge 180
characterized by varying degrees of uncertainty, ignorance and correctness (Ding et al., 2012). 181
Participatory action research is particularly beneficial because research implementation which 182
embodies collective enquiry and experimentation (Wittmayer and Schäpke, 2014), occurs within 183
the PMT rather than ‘for it’. Consequently, PMT stakeholders are more likely to adopt emergent 184
findings, recommendations and modify their future practices. 185
186
Data collated was analyzed using a mixed methods approach that combined predominantly 187
quantitative probability modelling of clash data with qualitative investigation and delineation of 188
the model federation and clash management process. Once this aforementioned process was 189
succinctly documented in illustrative format, unstructured interviews were then conducted with 190
members of the PMT to identify challenges that exacerbate the problem of clash propagation. The 191
contractor was particularly insistent that error clashes between the positions of the MEP designer’s 192
and structural designer’s building compartments were analyzed in greater detail. Such clashes 193
were deemed to be ‘mission critical’ as previous anecdotal experience (accrued from past projects 194
completed) suggested that project costs could spiral uncontrollably if these were left unabated. 195
196
The construction of a large multi-storey educational building located in Birmingham UK (entitled 197
the ‘Mary Seacole Building’ – refer to Figure 1 for external visualization) provided the contextual 198
setting for the research. The contract value exceeded £36 million UK Sterling and created 10,000 199
sq m of new teaching space. The project commenced with a client sign off on March 2015 and is 200
currently ongoing with an expected handover to client by September 2017. A Joint Contracts 201
Tribunal (JCT) Design and Build was employed and procurement was implemented via the 202
Official Journal of the European Union (OJEU) tender submissions. OJEU is used for all tenders 203
from the public sector which are valued above a certain financial threshold according to European 204
Union legislation (Lam, 2016). 205
8 A federated BIM model was used to identify clash detections. Federated models are deployed 207
using various BIM-related platforms including: Bentley Navigator®, Autodesk Navisworks® and 208
Autodesk Glue®. For this research, Autodesk Glue® was used to facilitate cloud based model 209
federation. The project employer information requirements stipulate that for the contractor: 210
211
“Glue Coordination models will be created at different stages. They will be used for a 212
number of reasons, some of these are, clash detection, MDM creation, 4D and 5D 213
modeling, and used as the base model for the ‘BIM 360 Field’ database – these are but 214
some of the uses.” 215
216
The main contractor employed a permanent BIM manager to manage clash detection of the 217
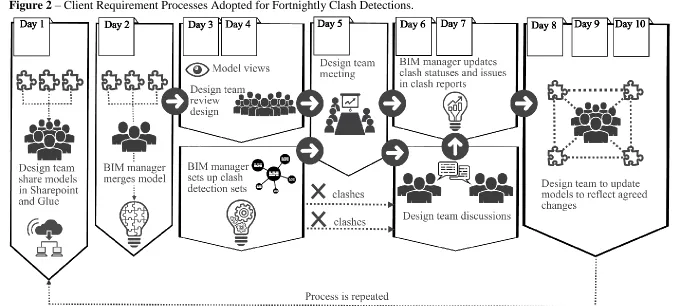
federated model in Navisworks® (refer to Figure 2). Spatial coordination between the various 218
design discipline models was carried out at regular fortnightly intervals (every ten working days) 219
throughout the design and construction stages. The BIM manager was integral within this process 220
and facilitated regular co-ordination of team meetings, model updates, clash revisions and control. 221
Clash detection in BIM is a global phenomenon; unlike other countries worldwide, it has been 222
forcefully mandated in the United Kingdom (UK) (HM Gov 2012, HM Gov 2013). According to 223
the UK Government mandated BIM Level 2 requirements, design teams must undertake weekly 224
or fortnightly task information and clash rendition tasks to ensure designs are fully coordinated 225
and clash free, ensuring that requests for information are minimised during construction stages 226
(HM Government, 2012; 2013). This government intervention seeks to mitigate design error 227
prominence within BIM implementation. The client also required that the main contractor 228
employed a clash detection management process on a fortnightly basis. Clash detection resolution 229
was implemented via Virtual Design and Construction (VDC) coordination meetings with the 230
respective design teams. The BIM execution plan (as outlined by the main contractor during 231
tender) stated that: 232
233
“The aspiration is that beyond Stage 4, the model will be managed by the principal 234
contractor and modifications to the model be made in house or by the design team. 235
Throughout the project the BIM lead from each company and the soft landings champion 236
9 VDC meetings with design team meetings. During construction it will be led by the main 238
contractor.” 239
240
The main contractor and its team members adopted cloud based platforms to alleviate the number 241
of discrepancies between the ‘as-constructed’ and the ‘as-built’ BIM model. Specifically, 242
Autodesk's® BIM360 platform for design coordination and as-constructed validation was chosen 243
as the cloud-based BIM tool for this task. Clash detection was also conducted via this cloud based 244
platform enabling stakeholders to link discipline specific design models (obtained from the MEP 245
designer, structural engineer and architect) into the main contractor’s federated model (i.e 246
Autodesk® Glue). Although open architecture was used within the federated model to reduce 247
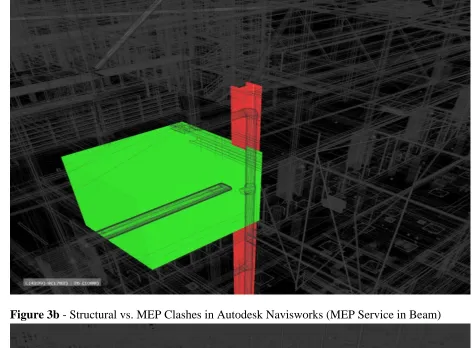
errors, 404 design clashes were identified between the MEP designer’s model and the structural 248
designer’s model (refer to Figures 3a and 3b). 249
250
Data mining 251
Within this data sub-set of design clashes, 150 observations related to MEP vs building column 252
clashes and 254 related to MEP vs building frame clashes. Summary statistical data analysis in 253
Table 1a presents parametric and non-parametric descriptive measures of central tendency and 254
measures of variation or dispersion within the sample data (Wheelan, 2013). Evidence of skewness 255
was apparent given the distance between the arithmetic mean and median values (namely 212.82 256
mm and 166.78 mm respectively). Skewness measures the asymmetry of the probability 257
distribution of a real-valued random variable about its mean (Schiller et al., 2013). It was observed 258
that the clash detection data was positively skewed; the majority of data fell within the 41.09 mm 259
to circa 250 mm measurement range but a long tail extending to 550.03 mm was recorded. Because 260
the presence of outliers was suspected an established outlier detection test was used to confirm 261
this and subsequently remove them prior to conducting the analysis for a second time. The outlier 262
test used was: 263
264
Outlier = ((𝑄3 − 𝑄1) x 1.5) + Q3) [Eq. 1]
265 266
Where: Q1 = is the first quartile value; Q3 is the third quartile value; and 1.5 is a constant. 267
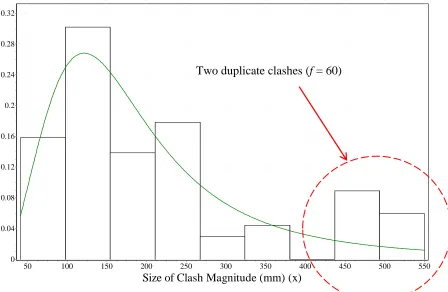
10 The outlier limit value was noted as 440.74 mm but further data analysis revealed that two 269
observations extended beyond this and were predominantly responsible for the long tail observed. 270
These two values were duplicate clashes (457.534 mm (frequency = 24) and 550.031 mm 271
(frequency = 36)) and accounted for 60 outliers in total. The treatment of outliers is a contentious 272
issue within extant literature and could broadly involve either removing or transforming them 273
using for example, square root, log10 or box-cox transformations (Cousineau and Chartier, 2010). 274
It can be argued that removing outliers squanders important data (and hence knowledge) in the 275
subsequent analysis but keeping them produces an uncharacteristic pattern in the trend. Given the 276
contentious nature of outlier treatment, subsequent analysis examined both data sets – 277
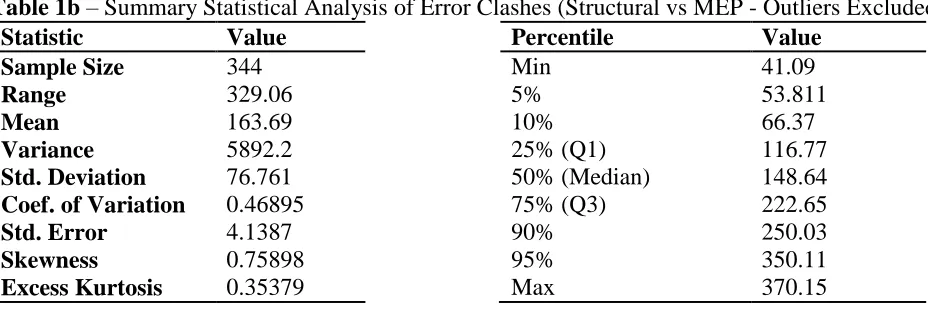
untransformed original data with and without outliers. A revised summary statistical analysis is 278
therefore presented in Table 1b that excludes outliers and illustrates that the arithmetic mean and 279
median are much closer together (153.69 mm and 148.64 mm) and that skewness has been reduced 280
(although not eliminated). 281
282
The two pools of design clash data (with and without outliers) were then modelled using empirical 283
PDF and CDF for a continuous distribution; these models were used to improve knowledge of 284
clashes that propagate during design works. A comparative analysis between the goodness of fit 285
tests generated for both types of probability modelling was undertaken to measure any observable 286
differences. 287
288
Probability modelling 289
The PDF for a continuous distribution can be expressed in terms of an integral between two points: 290
291
𝑃 ∫ 𝑓(𝑥)𝑑𝑥 = 𝑃(𝛼 ≤ 𝑋 ≤ 𝑏)𝛼𝑏 [Eq. 2]
292 293
A CDF is the probability that a variate takes on a value less than or equal to x. For continuous 294
distributions, the CDF is expressed as a curve and denoted by: 295
296
𝐹(𝑥) = ∫−∞𝑥 𝑓(𝑡)𝑑𝑡 [Eq.3]
11 The empirical CDF is displayed as a stepped discontinuous line depending upon the number of 299
bins and is denoted by: 300
301
𝐹𝑛 (𝑥) =1
𝑛. [𝑁𝑢𝑚𝑏𝑒𝑟 𝑜𝑓 𝑜𝑏𝑠𝑒𝑟𝑣𝑎𝑡𝑖𝑜𝑛𝑠 ≤ 𝑥] [Eq.4]
302 303
Where bins are the number of equal vertical bars contained within a CDF histogram, each 304
representing the number of sample data values (that are contained within each corresponding 305
interval), divided by the total number of data points. 306
307
The PDF, CDF and distribution parameters (e.g. ) for 36 different continuous 308
distributions, including Beta, Exponential, Frechet, Gumbel Max/Min and Wakeby, were 309
examined using the estimation method Maximum Likelihood Estimates. The best fit distribution 310
was then determined using two goodness of fit tests, namely the: Anderson-Darling statistic (A2); 311
and Kolmogorov-Smirnov statistic (D). Combined, these goodness of fit tests measure the 312
compatibility of a random sample with a theoretical probability distribution function – or put 313
simply, how well the distribution fits the data. 314
315
The Anderson-Darling statistic (A2) is a general test to compare the fit of an observed CDF to an 316
expected CDF. The test provides more weight to a distribution’s tails than the Kolmogorov-317
Smirnov test. The Anderson-Darling statistic is defined as: 318
319
[Eq.5] 320
321
The Kolmogorov-Smirnov statistic (D) is based on the largest vertical difference between the 322
theoretical and empirical CDF. It is defined as: 323
324
𝐷 = (𝐹(𝑥𝑖) − 𝑖−1
𝑛 1<𝑖<𝑛𝑚𝑎𝑥 ,
𝑖
𝑛− 𝑓(𝑥𝑖)) [Eq.6]
325
These goodness of fit tests were used to test the null (Ho) and alternative hypotheses (H1) of the 326
datasets: H0 - follow the specified distribution; and H1 - do not follow the specified distribution. 327
, , , ,k,m, ,
n i i ni In F x
12 The hypothesis regarding the distributional form is rejected at the chosen significance level (α) if 328
the statistic D and, A2 are greater than the critical value. For the purposes of this research, 0.01, 329
0.02 and 0.05 significance levels were used to evaluate the null hypothesis. 330
331
The p-value, in contrast to fixed α values, is calculated based on the test statistic and denotes the 332
threshold value of significance level, in the sense that Ho will be accepted for all values of α less 333
than the p-value. Once the ‘best fit’ distribution was identified, the probabilities for a design 334
clashes were calculated using the CDF. 335
336
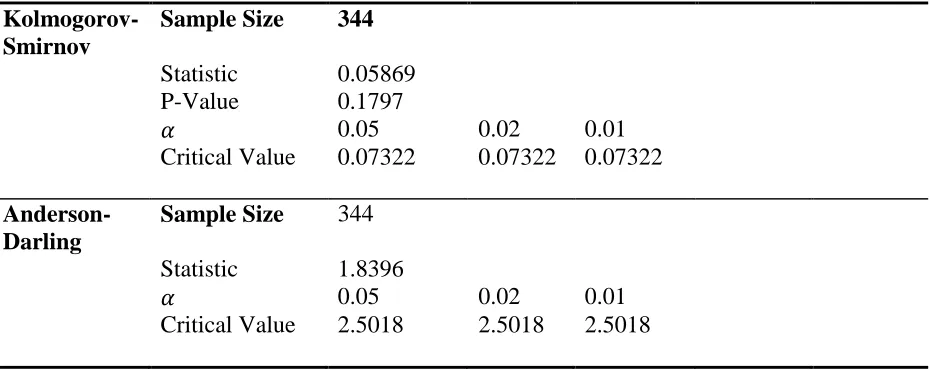
Distribution Fitting: Probability of the Size of Clash – Model One (All Data) 337
All 404 data points were analyzed for model one. Results reported in Table 2a illustrate that the 338
best fit probability distribution for the size of clash detections was the Log Logistic Three 339
Parameter (3P) at α = 0.01 and 0.02 confidence intervals; notably, the fit was not achieved at α = 340
0.05. The three parameters are: 341
342
𝛼 = 2.2943; 𝛽 = 147.33; and 𝛾 = 23.249 343
344
The PDF (Figure 4) and CDF (Figure 5) for the Log Logistic 3P distribution fitting are defined in 345
equations 7 and 8 respectively as: 346
347
𝑓(𝑥) = 𝛼
𝛽( 𝑥−𝛾
𝛽 ) 𝛼−1
((𝑥−𝛾
𝛽 ) 𝛼
)
−2
[Eq.7]
348 349
𝐹(𝑥) =(1 + ( 𝛽
𝑥−𝛾) 𝛼
)
−1
[Eq.8] 350
351
Where: 𝛼 is a continuous shape parameter with 𝛼 > 0; 𝛽 is a continuous scale parameter with 352
𝛽 > 0; and 𝛾 is a continuous location parameter where 𝛾 ≡ 0 yields the two parameter-Log 353
Logistic distribution. The domain for this distribution is 𝛾 < 𝑥 < +∞. 354
355
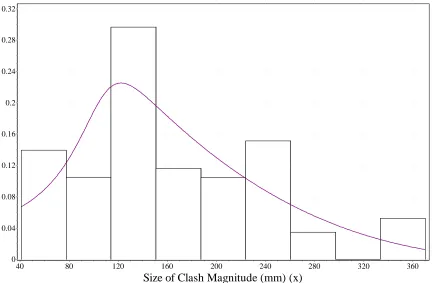
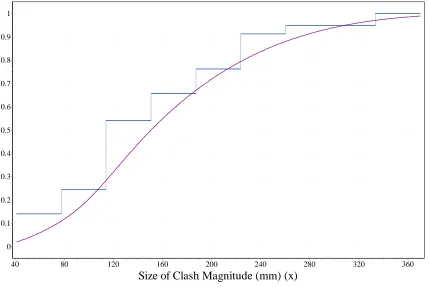
13 For the second model, 344 observations were analyzed (excluding duplicate clash outliers). 357
Results reported in Table 2b illustrate that the best fit probability distribution fitting for the size 358
of clash detections was the three parameter Generalized Gamma at α = 0.01, 0.02 and 0.05 359
confidence intervals – this represented a minor improvement upon model one. The three 360
parameters are: 361
362
𝑘 = 0.99505; 𝛼 = 4.5101; 𝑎𝑛𝑑 𝛽 = 35.997 363
364
The PDF (Figure 6) and CDF (Figure 7) for the three parameter Generalized Gamma distribution 365
fitting are defined in equations 9 and 10 respectively as: 366
367
𝑓(𝑥) = 𝑘𝑥𝑘𝛼−1
𝛽𝑘𝛼Γ(𝛼)exp (−( 𝑥 𝛽)
𝑘) [Eq.9]
368 369
𝐹(𝑥) = Γ(𝑥/𝛽)𝑘(𝛼)
Γ(𝛼) [Eq.10]
370 371
Where: 𝑘 is a continuous shape parameter 𝑘 > 0; 𝛼 is a continuous shape parameter 𝛼 > 0; 𝛽 is 372
a continuous scale parameter 𝛽 > 0; and 𝛾 is a continuous location parameter (𝛾 ≡ 0 yields the 373
three-parameter Generalized Gamma distribution). 374
375
Both distribution fitting models illustrate a good fit at the 0.01 and 0.02 confidence intervals and 376
therefore the removal of outliers was not a prerequisite requirement to obtaining a valid result. 377
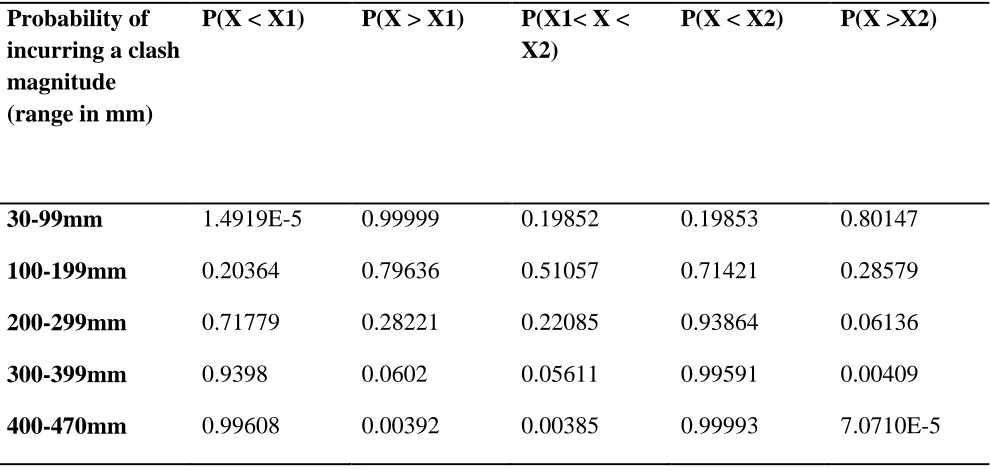
Using the parameters contained within model two, delimiters (X1 and X2) were used to calculate 378
the probabilities of obtaining a discrete category of clash ranging from 30-99mm, 100-199mm, 379
200-299mm, 300-399mm and 400-470mm (refer to Table 3). These tolerance categories were 380
defined and delineated by the contractor for the purposes of clash detection. The research team 381
felt that such: i) was an arbitrary decision inordinately influenced by a hired BIM consultant; and 382
ii) lacked logic and a meaningful basis for this decision. From this discrete analysis, it was apparent 383
that 92.98% of clashes reside within the 30-299 mm range; where this range consists of the 30-99 384
mm = 19.85%; 100-199 mm = 51.05%; and 200-299 mm = 22.08% discrete categories. 385
14 CLASH MANAGEMENT CHALLENGES AND CONSIDERATIONS
387
The quantitative analysis conducted within this research illustrates that PDF and CDF can 388
successfully model the probability of design clashes that occur during the development of a 389
federated BIM model. Such modelling will prove useful to the client and members of the design 390
team who seek to better understand and mitigate future clash occurrence. However, the origins of 391
clashes cannot be explained by quantitative analysis alone, hence further qualitative investigation 392
of the model federation and clash management process was conducted (refer to Figure 8). A three 393
tier process was implemented that consisted of: tier one – the design stage; tier two – cloud 394
computing; and tier three – clash detection. During tier one, the architects, MEP designers, 395
structural engineers and other design consultants populated BIM semantic data within a discipline 396
specific BIM model in an iterative manner. These discipline specific models were then integrated 397
into an initial federated model. Tier two involved the implementation of the contractor’s cloud 398
computing solution that provided a two-way communication portal between the designers and 399
contractor. Within the cloud, Autodesk Glue® was used to federate the model; BIM 360 Field was 400
used to store and upload site photographs and facilitate communication between individual PMT 401
members; and BIM 360 Layout was used as a tool to input Cartesian coordinates (of the building 402
and site) using a total station. In tier three, the contractor, contractor’s BIM Manager and designers 403
implemented a recurrent process of clash detection and resolution. The designers identified model 404
clashes as a first step towards developing resolved model clashes that were uploaded into an initial 405
clash report. The contractor’s BIM Manager then used this clash report to iteratively work with 406
designers to resolve clashes within a final federated model that was uploaded into the cloud for all 407
members of the PMT to access. This clash management process was further explored using 408
unstructured interviews with members of the PMT and highlighted several important challenges 409
facing practitioners working within a digital construction environment. These challenges can be 410
conveniently grouped into the following thematic groupings, namely: organizational influences; 411
manpower and training; automation of analysis (machine learning); and cross industry knowledge 412
transfer. 413
414
Organizational influences 415
BIM has been heralded as a 21st century innovation that will not only improve the efficiency of 416
15 (Bryde et al., 2013). Other researchers eulogize over BIM virtues pertaining to: energy savings 418
and concomitant cost reductions (Guo and Wei, 2016); greater control of the design, construction 419
and operation of an asset throughout its whole life cycle (Azhar, 2011; Wong and Zhou, 2015); 420
and significant time savings in the production process and consistency of the product (Arayici et 421
al., 2011; Ham and Golparvar-Fard, 2015). However, the research presented here observed that a 422
singular PMT is neither cohesive nor unified and consists of disparate teams working together to 423
populate the federated BIM model. Moreover, the mechanistic manner via which clashes were 424
identified and resolved afforded limited opportunity for members of the PMT to learn from 425
mistakes made by maximizing upon readily available business intelligence. This problem is further 426
exacerbated by software and model exchange issues when different members of the PMT work on 427
design work sets in isolation; a member of the PMT said: 428
429
“For example, the structural engineer could do a lot of work and not tell the architects 430
about it. This might happen, then both could upload their model into a centralised 431
location and now we have multiple clashes because the architects did not update their 432
model and the structural engineer has now done some changes to the steel frame.” 433
434
This finding concurs with earlier research conducted by Porwal and Hewage (2013) who reported 435
that organizational and people centered issues pose the greatest challenge for BIM 436
implementation. Other organizational issues relate to intellectual property (IP) rights particularly 437
for architectural designs; a member of the PMT said: 438
439
“They [architects] are still failing to produce a coordinated design even though they are 440
sitting next to each other [with other design members in the PMT]. This is all about 441
intellectual property [IP] rights. Because of the IP, the architects that own the model 442
don’t want you to easily edit it, so for example when you ask them for the Revit file they 443
will refuse to share it. This is because models are easily editable in Revit (you can design 444
in Revit) and once they give you a Revit model you can copy it and paste it somewhere 445
else. And they [architects] can charge you for it…” 446
16 Cumulatively, these improvised communication, organizational and administrative arrangements 448
make clash eradication per se difficult within a BIM environment particularly when a silo 449
mentality prevails. 450
451
Manpower, Training and Competence Development 452
Prior research (Succar et al., 2013; Murphy, 2014) advocates that professionals within the PMT 453
must develop core BIM competencies in order to secure performance improvement. Such 454
improvement could be achieved via organizational learning that seeks to create, retain and transfer 455
knowledge within an organization (Duffield and Whitty, 2016). The research presented, provides 456
an opportunity for sharing knowledge through the exploitation of business intelligence and 457
experiential learning amongst members of the PMT (Konak et al., 2014). However, organizational 458
learning is hampered within industry by the exponential rate of software-hardware technology 459
development and the concomitant need to continually retrain personnel to remain at the forefront 460
of knowledge and developments (Eadie et al., 2013). Evidence accrued from this research supports 461
this assertion and suggests that some members of the PMT have deliberately created a pretense of 462
full BIM compliance, when in fact their approach is compromised by ad hoc arrangements. A 463
member of the PMT said: 464
465
“It’s all about knowledge, how the software is used. At the moment a lot of the 466
consultancies are running away with BIM, where they are just modelling using the CAD 467
drawings. Rather than using a proper BIM draughtsman, they employ a Revit technician. 468
The Revit technician receives CAD drawings and redraws these into Revit, which is not 469
a collaborative way of working. The structural engineer is doing all the calculations and 470
measurements in the CAD drawings in 2D and then this is being transferred into 3D with 471
errors!” 472
473
Evidence suggests that a huge BIM knowledge gap has developed between senior professionals 474
(architects, MEP designers, etc.) and small to medium enterprises (SMEs) that is compounded by 475
innate skill limitations (Harris et al., 2013). SMEs are quintessentially important as their services 476
are often used in the design, construction and/ or maintenance of buildings (Khan et al., 2016). 477
17 these practitioners to fully embrace the concept of a ‘life-long learner for digital construction’ in 479
order to avoid tacit knowledge redundancy within SMEs. 480
481
Automation of Analysis (Machine Learning) 482
Machine learning (ML) has its entomological roots grounded in artificial intelligence (AI) and 483
embraces computer learning without explicit programming (Bottou, 2014). ML focuses on the 484
development of computer programs that can teach themselves to grow and change when exposed 485
to new data (Perlich et al., 2014). Within the AECO sector, ML is already being used to: monitor 486
construction progress using 4D BIM (Golparvar-Fard and Han, 2015; Son et al., 2015); automate 487
rule checking within BIM models (Solihin and Eastman, 2015); automate as-built 3D 488
reconstruction using computer vision (Fathi et al., 2015); and monitor construction performance 489
using still images (Yang, 2015). However, despite these significant advances, clash detection 490
remains a laborious, mechanistic, time consuming and costly exercise. Each and every clash must 491
be manually integrated, analyzed and accessed by the BIM manager to first determine the type of 492
clash (i.e. clash errors, pseudo clash, deliberate clash or duplicate clash) before taking suitable 493
action and monitoring progress where a resolution is required. Automated methods are urgently 494
required to: rapidly assimilate vast quantities of geometric data accessed from a larger range of 495
construction and civil engineering projects to build accurate benchmark clash detection profiles 496
that could inform future decision making; define and delineate between the various clash types to 497
provide greater business intelligence regards which clashes require resolution thus eliminating the 498
need for manual intervention; and eliminate the need for manual intervention and the introduction 499
of human errors or omissions. 500
501
Cross Industry Software-Knowledge Transfer 502
In other more technologically advanced industries (e.g. automotive and aerospace), software 503
exchange file formats have been standardized to aid communication between various designers 504
and manufacturing production processes (Eastman et al., 2011). Within the AECO sector the BIM 505
authoring platforms adopted lack standardized user interfaces and file formats in an open 506
architecture environment. Although the Industry Foundation Classes (IFCs) specification sought 507
18 free. For example, geometry and semantic information can disappear when file formats are 509
exported from the original BIM authoring platform. A member of the PMT said: 510
511
“… many companies and consultancies are reluctant to give us the Revit files. That is 512
why the IFC was invented and generated, to allow for the export from any piece of 513
software. This was the holy grail of the BIM model, that you can export into a single 514
format which can be opened by any company or any BIM software vendor and federated 515
in IFC’s. But obviously software vendors [vendor name removed] are failing to produce 516
usable IFC’s, so it’s very hard to export correct IFC from Revit. For example, today I 517
received some export IFC’s from a vendor [vendor name removed] and they are coming 518
out with strange geometries that are not meant to be in the model.” 519
520
Currently, there is no commercially available cloud-based BIM authoring platform that allows 521
designers to work collaboratively. As an exemplar of contemporary industry practice, members of 522
the project design team worked within separate BIM authoring platforms – for instance, the 523
architect used REVIT, the structural engineer used Tekla and MEP used REVIT MEP. These 524
various software packages, processes and procedures have been developed organically and 525
iteratively to meet industry needs but as yet, a single system that encapsulates holistic coverage 526
has eluded the sector. This is most likely because platform design specifications are often ill-527
defined, frequently complex and involve iterative processes, and user needs and specifications 528
evolve as the temporal and recurrent ‘design to user-experience’ process consolidates into an 529
optimal product solution (Chandrasegaran et al., 2013). A member of the PMT said: 530
531
“BIM 360 Glue allows you to view and federate the models from different consultants. So 532
for instance, I am getting uploads of the latest models to the single cloud storage to check 533
them. But I am also coordinating them, so all the clashes which should not be there, are 534
there to be checked by myself and my colleagues. Because the designers have been 535
working within their own silos and then just upload the models into the cloud based 536
platform for a clash detection.” 537
Working from a cloud would alleviate many of the problems and issues faced when working in a 538
19 require frequent annual updates. Annual updates in a cloud would ensure that all team members 540
are using the most up to date version. One common cloud-based modeling platform would provide 541
an ideal solution but agreement between five or more software providers of alternative platforms 542
could be problematic particularly on commercial grounds. A potential solution would be to 543
eliminate errors within IFCs and ensure ever-greater interoperability between software vendors – 544
transference of best practice from more technologically advanced sectors could present an ideal 545
solution to this conundrum. A member of the PMT said: 546
547
“The guys [contractors] internally have got their heads around it [cloud based app] 548
because there are a lot of changes. So over the course of the year the site team has 549
changed slightly. Traditionally, there would be a lot of information that is stored on 550
emails, although they were sitting next to each other and talking with one another… 551
Because all of the issues have been raised on the iPads [on cloud] they are already there 552
for the next site manager to find. So at least they’re not completely blind when they have 553
to come in to resolve the issues.” 554
555
CONCLUSIONS 556
Despite the euphoria that often surrounds digital construction within extant literature, this research 557
has shown that BIM is not yet a panacea to mitigating design errors. Rather the nature of design 558
error propagation has changed and evolved in parallel with ‘new technologies’ applied that are 559
being managed by ‘traditional management’ processes and procedures. In addition, a distinct lack 560
of organizational learning within the PMT was evident and so the opportunity to secure 561
experiential learning is often lost. Rather than learn from clash occurrences and proactively work 562
to mitigate them, members of the PMT take a short-term reactive approach to identifying and 563
resolving them. Part of the problem is that clash detection software for example, currently lacks 564
automation and requires a labour intensive (and costly) analysis and post-investigation of clash 565
data by the BIM manager/ coordinator. For an entire project (dependent upon scope), design 566
clashes alone could equate to several tens of thousands of observations and in the longer term, 567
such an approach is untenable. Members of a fragmented design team were also observed to be 568
working in isolation and with bespoke BIM authoring platforms. Although IFCs were meant to 569
20 571
PDF and CDF probability distribution models developed within this research offer invaluable 572
insight into the size and frequency of clash occurrence – such could be used to develop probability 573
profiles that enable BIM managers to better define and delineate tolerances prior to conducting 574
clash detection. Such work should be extended to other building compartments (for example, 575
architecture) and for other buildings so that a comprehensive knowledge bank of benchmark 576
indicators can be established and used to monitor clash errors, resolution and mitigation. 577
578
In many instances reported upon in this research, a 21st century technological innovation and 579
collaborative means of working is being managed by a 20th century management and 580
individualistic mentality. Future work is therefore required in several key areas, namely to: i) 581
extend the models developed to other building compartments to cover a wider range of clash 582
detection across the entire building and multiple buildings throughout industry. Such work could 583
form the basis of invaluable business intelligence that would inform and optimize decision making 584
for future design projects; ii) develop machine learning processes and procedures to automate 585
clash analysis and prognosis; iii) transfer knowledge of successful digital modelling technologies 586
from other more advanced industrial sectors (such as mitigating interoperability issues and clash 587
error management) into the AECO sector; and re-evaluate the training and competence 588
development needs of SMEs working within the PMT supply chain. 589
21 REFERENCES
591
Al Hattab, M., and Hamzeh, F. (2015) Using Social Network Theory and Simulation to Compare 592
Traditional Versus BIM–lean Practice for Design Error Management. Automation in 593
Construction, Vol. 52, pp. 59-69. DOI: 10.1016/j.autcon.2015.02.014
594
Allen, R. K., Becerik, B., Pollalis, S. N., and Schwegler, B. R. (2005) Promise and Barriers to 595
Technology Enabled and Open Project Team Collaboration. Journal of Professional Issues in 596
Engineering Education and Practice, Vol. 131, No. 4, pp. 301-311. DOI:
10.1061/(ASCE)1052-597
3928(2005)131:4(301)
598
Arayici, Y., Coates, P., Koskela, L., Kagioglou, K., Usher, C. and O'Reilly K. (2011) Technology 599
Adoption in the BIM Implementation for Lean Architectural Practice, Building Information 600
Modeling and Changing Construction Practices, Automation in Construction, Vol. 20, No. 2, 601
pp. 189-195. DOI: http://dx.doi.org/10.1016/j.autcon.2010.09.016
602
Arayici, Y, Egbu, C.O. and Coates, P. (2012) Building Information Modelling (BIM) 603
Implementation and Remote Construction Projects: Issues, Challenges, and Critiques, Journal 604
of Information Technology in Construction, Vol. 17, pp. 75-92. Available via: 605
http://usir.salford.ac.uk/22736/1/BIM_AND_REMOTE_CONSTRUCTION_PROJECTS.pdf
606
(accessed: November, 2016). 607
Azhar, S. (2011) Building Information Modeling (BIM): Trends, Benefits, Risks, and Challenges for 608
the AEC Industry. Leadership Management in Engineering, Vol. 11, No. 3, pp. 241-252. DOI: 609
http://dx.doi.org/10.1061/(ASCE)LM.1943-5630.0000127
610
Bagwat, P. and Shinde, R. (2016) Clash Detection: A New Tool in Project Management, International 611
Journal of Scientific Research in Science, Engineering and Technology, Vol. 2, No. 4, pp. 193-612
197. Available via: http://ijsrset.com/paper/1637.pdf (Accessed: November, 2016). 613
Ben-Alon, L. and Sacks, R. (2017) Simulating the Behavior of Trade Crews in Construction Using 614
Agents and Building Information Modeling, Automation in Construction, Vol. 74, pp. 12–27. 615
DOI: http://dx.doi.org/10.1016/j.autcon.2016.11.002
616
Bottou, L. (2014) From Machine Learning to Machine Reasoning, Machine Learning, Vol. 94, No. 617
2, pp. 133-149. DOI: 10.1007/s10994-013-5335-x
618
Bryde, D., Broquetas, M. and Volm, J. M. (2013) The Project Benefits of Building Information 619
Modelling, International Journal of Project Management, Vol. 31, No. 7, pp. 971-980. DOI: 620
http://dx.doi.org/10.1016/j.ijproman.2012.12.001
22 Chandrasegaran, S.K. Ramani, K., Sriram, R.D., Horvath, I., Bernard, A., Harik, R.F. and Gao, W. 622
(2013) The Evolution, Challenges, and Future of Knowledge Representation in Product Design 623
Systems, Computer-Aided Design, Vol. 45, No. 2, pp. 204-228. DOI:
624
http://dx.doi.org/10.1016/j.cad.2012.08.006
625
Chevalier , J.M. and Buckles, D.J. (2013) Participatory Action Research: Theory and Methods for 626
Engaged Inquiry. Routledge: London. ISBN: 0415540321 627
Ciribini, A.L.C., Mastrolembo Ventura, S. and Paneroni, M. (2016) Implementation of an 628
Interoperable Process to Optimize Design and Construction Phases of a Residential Building: 629
A BIM Pilot Project, Automation in Construction, Vol. 71, Part 1, pp 62–73. The Special Issue 630
of 32nd International Symposium on Automation and Robotics in Construction. DOI: 631
http://dx.doi.org/10.1016/j.autcon.2016.03.005
632
Cousineau D. and Chartier, S. (2010) Outliers Detection and Treatment: A Review, International 633
Journal of Psychological Research, Vol. 3, No. 1, pp. 58-67. Available via: 634
http://revistas.usb.edu.co/index.php/IJPR/article/view/844/601 (Accessed: November 2016). 635
Ding, S., Yang, S.L. and Fu, C. (2012) A Novel Evidential Reasoning Based Method for Software 636
Trustworthiness Evaluation Under the Uncertain and Unreliable Environment, Expert Systems 637
with Applications, Vol. 39, No. 3, pp. 2700-2709. DOI:
638
http://dx.doi.org/10.1016/j.eswa.2011.08.127
639
Duffield, S.M. and Whitty, S.J. (2016) Application of the Systemic Lessons Learned Knowledge 640
Model for Organisational Learning through Projects, International Journal of Project 641
Management, Vol. 34, No. 7, pp. 1280-1293. DOI:
642
http://dx.doi.org/10.1016/j.ijproman.2016.07.001
643
Dutta, D. and Bose, I. (2015) Managing a Big Data project: The Case of Ramco Cements Limited, 644
International Journal of Production Economics, Vol. 165, pp. 293–306. DOI: 645
http://dx.doi.org/10.1016/j.ijpe.2014.12.032 646
Eadie, R., Browne, M., Odeyinka, H., McKeown, C. and McNiff, S. (2013) BIM Implementation 647
Throughout The UK Construction Project Lifecycle: An Analysis, Automation in Construction, 648
Vol. 36, pp. 145–151. DOI: http://dx.doi.org/10.1016/j.autcon.2013.09.001
649
Eastman, C., Eastman, C. M., Teicholz, P., Sacks, R., and Liston, K. (2011) BIM handbook: A Guide 650
to Building Information Modeling for Owners, Managers, Designers, Engineers and 651
23 Edwards, D.J., Pärn, E.A., Love, P.E.D. and El-Gohary, H. (2016) Machines, Manumission and 653
Economic Machinations, Journal of Business Research, Vol. 70 pp. 391-394. DOI: 654
http://dx.doi.org/10.1016/j.jbusres.2016.08.012
655
Fathi, H., Dai, F. and Lourakis, M. (2015) Automated As-built 3D Reconstruction of Civil 656
Infrastructure Using Computer Vision: Achievements, Opportunities, and Challenges, 657
Advanced Engineering Informatics, Vol. 29, No. 2, pp. 149-161. DOI:
658
http://dx.doi.org/10.1016/j.aei.2015.01.012
659
Forcada, N., Alvarez, A., Love, P. and Edwards, D.J. (2016) Rework in Urban Renewal Projects in 660
Colombia. Journal of Infrastructure Systems. DOI: 10.1061/(ASCE)IS.1943-555X.0000332
661
Guo, S-J. and Wei, T. (2016) Cost-effective Energy Saving Measures Based on BIM Technology: 662
Case Study at National Taiwan University, Energy and Buildings, Vol. 127, pp. 433-441. DOI:
663
http://dx.doi.org/10.1016/j.enbuild.2016.06.015 664
Ham, Y. and Golparvar-Fard, M. (2015) Mapping Actual Thermal Properties to Building Elements 665
in GBXML-based BIM for Reliable Building Energy Performance Modeling, Automation in 666
Construction, Vol. 49, Part B, pp. 214-244. DOI:
667
http://dx.doi.org/10.1016/j.autcon.2014.07.009
668
Han, K.K. and Golparvar-Fard, M. (2016) Appearance-based Material Classification for Monitoring 669
of Operation-level Construcvtion Progress Using 4D BIM and site Photologs, Automation in 670
Construction, Vol. 53, pp. 44-57. DOI: http://dx.doi.org/10.1016/j.autcon.2015.02.007
671
HM Government. (2012) Final Report to Government by the Procurement/Lean Client Task Group. 672
London: Government Construction Strategy. Available via: 673
https://www.gov.uk/government/uploads/system/uploads/attachment_data/file/61157/Procure
674
ment-and-Lean-Client-Group-Final-Report-v2.pdf (Accessed: November, 2016). 675
HM Government. (2013) Building Information Modeling Industrial Strategy: Government and 676
Industry in Partnership. London: Government Construction Strategy. Available via: 677
https://www.gov.uk/government/uploads/system/uploads/attachment_data/file/34710/12-1327-678
building-information-modelling.pdf (Accessed: November, 2016). 679
Harris, R., McAdam, R., McCausland I. and Reid, R. (2013) Levels of Innovation within SMEs In 680
Peripheral Regions: The Role of Business Improvement Initiatives, Journal of Small Business 681
and Enterprise Development, Vol. 20, No. 1 pp. 102–124. DOI: 682
http://dx.doi.org/10.1108/14626001311298439
24 Khan, K. I.A., Flanagan, R. and Lu, S-L. (2016) Managing Information Complexity Using System 684
Dynamics on Construction, Projects, Construction Management and Economics, Vol. 34, No. 685
3, pp. 192-204, DOI: http://dx.doi.org/10.1080/01446193.2016.1190026 686
Konak, A., Clark, T.K. and Nasereddin, M. (2014) Using Kolb’s Experiential Learning Cycle to 687
Improve Student Learning in Virtual Compute Laboratories, Computers and Education, Vol. 688
72, pp 11-22. DOI: http://dx.doi.org/10.1016/j.compedu.2013.10.013
689
Kornbluh, M., Ozer, E.J., Allen, C.D., and Kirshner, B. (2015) Youth Participatory Action Research 690
as an Approach to Sociopolitical Development and the New Academic Standards: 691
Considerations for Educators, The Urban Review, Vol. 47, No. 5, pp. 868–892. DOI:
692
10.1007/s11256-015-0337-6
693
Lam, T.Y.M. (2016) A Performance Outcome Framework for Appraising Construction Consultants 694
in the University Sector, Journal of Facilities Management, Vol. 14, No. 3, pp. 249 – 265. DOI:
695
http://dx.doi.org/10.1108/JFM-05-2015-0017
696
Lee, S., Peña-Mora, F. and Park, M. (2005) Quality and Change Management Model for Large Scale 697
Concurrent Design and Construction Projects. Journal of Construction Engineering and 698
Management, Vol. 131, No. 8. pp. 890-902. DOI:
http://dx.doi.org/10.1061/(ASCE)0733-699
9364(2005)131:8(890)
700
Li, Y. and Taylor, T. (2014) Modeling the Impact of Design Rework on Transportation Infrastructure 701
Construction Project Performance. Journal of Construction Engineering and Management, Vol. 702
140, No. 9, pp. DOI: 10.1061/(ASCE)CO.1943-7862.0000878
703
Lin, A. and Chen, N-C. (2012) Cloud Computing as an Innovation: Perception, Attitude and 704
Adoption, International Journal of Information Management, Vol. 32, No. 6, pp. 533-540. DOI:
705
http://dx.doi.org/10.1016/j.ijinfomgt.2012.04.001
706
Liu, Y., Nederveen, S.V. and Hertogh, M. (2016) Understanding Effects of BIM on Collaborative 707
Design and Construction: An Empirical Study in China, International Journal of Project 708
Management. DOI: http://dx.doi.org/10.1016/j.ijproman.2016.06.007
709
Lopez, R., Love, P. E. D., Edwards, D. J., and Davis, P. R. (2010) Design Error Classification, 710
Causation, and Prevention in Construction Engineering. Journal of Performance of Constructed 711
Facilities, Vol. 24, No. 4, pp. 399-408. DOI:10.1061/(ASCE)CF.1943-5509.0000116
25 Love, P. E. D., Lopez, R., Kim, J. T., and Kim, M. J. (2014) Probabilistic Assessment of Design Error 713
Costs. Journal of Performance of Constructed Facilities, Vol. 28, No. 3, pp. 518-527. 714
DOI:10.1061/(ASCE)CF.1943-5509.0000439
715
Love, P. E. D., Wang, X., Sing, C.-p., and Tiong, R. L. K. (2013) Determining the Probability of 716
Project Cost Overruns. Journal of Construction Engineering and Management, Vol. 139, No. 717
3, pp. 321-330. DOI: 10.1061/(asce)co.1943-7862.0000575
718
Love, P.E.D. Sing, C.P., Edwards, D.J. and Odeyinka, H. (2013) Probability Distribution Fitting of 719
Schedule Overruns in Construction Projects, Journal of Operational Research Society, Vol. 64, 720
No. 8, pp. 1231–1247. DOI: 10.1057/jors.2013.29
721
Love, P.E.D. and Sing, C-P. (2013) Determining the Probability Distribution of Rework Costs in 722
Construction and Engineering Projects, Structure and Infrastructure Engineering, Vol. 9, No. 723
11, pp. 1136-1148. DOI: 10.1080/15732479.2012.667420
724
Love, P.E.D., Liua, J., Matthews, J., Sing, C-P and Smith, J. (2015) Future Proofing PPPs: Life-cycle 725
Performance Measurement and Building Information Modelling, Automation in Construction, 726
Vol. 56, pp. 26–35. DOI: http://dx.doi.org/10.1016/j.autcon.2015.04.008
727
Love, P.E.D., Zhou, J., Matthews, J. and Luo, H. (2016) Systems Information Modelling: Enabling 728
Digital Asset Management, Advances in Engineering Software, Vol. 102, pp. 155–165. DOI: 729
http://dx.doi.org/10.1016/j.advengsoft.2016.10.007
730
Manyika, J., Chui, M., Brown, B., Bughin, J., Dobbs, R., Roxburgh, C., and Byers, A. H. (2011) Big 731
data: The Next Frontier for Innovation, Competition, and Productivity. McKinsey Global 732
Institute. Available via: file:///C:/Users/pc%20user/Downloads/MGI_big_data_full_report.pdf
733
(Accessed: November, 2016). 734
Mapfumo, P., Adjei-Nsiah, S., Mtambanengwe, F., Chikowo, R. and Giller, K.E. (2013) Participatory 735
Action Research (PAR) as an Entry Point for Supporting Climate Change Adaptation by 736
Smallholder Farmers in Africa, Environmental Development, Vol. 5, pp 6-22. DOI:
737
http://dx.doi.org/10.1016/j.envdev.2012.11.001
738
Merschbrock, C. and Munkvold, B. E. (2015) Effective Digital Collaboration in the Construction 739
Industry – A Case Study of BIM Deployment in a Hospital Construction Project, Computers in 740
Industry, Vol. 73, pp. 1–7. DOI: http://dx.doi.org/10.1016/j.compind.2015.07.003
26 Murphy, M.E. (2014) Implementing Innovation: A Stakeholder Competency-based Approach for 742
BIM, Construction Innovation, Vol. 14, No. 4, pp. 433 – 452. DOI:
743
http://dx.doi.org/10.1108/CI-01-2014-0011
744
Oskouie1, P., Becerik-Gerber, B. and Soibelman, L. (2016) Automated Measurement of Highway 745
Retaining Wall Displacements Using Terrestrial Laser Scanners, Automation in Construction, 746
Vol. 65, pp. 86-101. DOI: http://dx.doi.org/10.1016/j.autcon.2015.12.023
747
Pain, R., Finn, M., Bouveng, R. and Ngobe, G. (2012) Productive Tensions - Engaging Geography 748
Students in Participatory Action Research with Communities, Journal of Geography in Higher 749
Education, Vol. 37, No. 1, pp. 28-43. DOI: http://dx.doi.org/10.1080/03098265.2012.696594
750
Park, S. C. and Ryoo, S.Y. (2013) An Empirical Investigation of End-users’ Switching Toward Cloud 751
Computing: A Two Factor Theory Perspective, Computers in Human Behavior, Vol. 29, No. 752
1, pp. 160-170. DOI: http://dx.doi.org/10.1016/j.chb.2012.07.032
753
Park, J., Kim, K., and Cho, Y. (2016) Framework of Automated Construction-Safety Monitoring 754
Using Cloud-Enabled BIM and BLE Mobile Tracking Sensors, Journal of Construction 755
Engineering and Management. DOI: 10.1061/(ASCE)CO.1943-7862.0001223
756
Peansupap, V., and Ly, R. (2015) Evaluating the Impact Level of Design Errors in Structural and 757
Other Building Components in Building Construction Projects in Cambodia. Procedia 758
Engineering, Vol. 123, pp. 370-378. DOI: http://dx.doi.org/10.1016/j.proeng.2015.10.049
759
Available via:
http://2015.creative-construction-760
conference.com/CCC2015_proceedings/CCC2015_45_Peansupap.pdf (Accessed: November, 761
2016) 762
Perlich, C., Dalessandro, B., Raeder, T., Stitelman, O. and Provost, F. (2014) Machine Learning for 763
Targeted Display Advertising: Transfer Learning in Action, Mchine Learning, Vol. 95, No. 1, 764
pp. 103-127. DOI: 10.1007/s10994-013-5375-2
765
Porwal, A. and Hewage, K.N. (2013) Building Information Modelling (BIM) Partnering Framework 766
for Public Contracts, Automation in Construction, Vol. 31, pp. 204-214. DOI:
767
http://dx.doi.org/10.1016/j.autcon.2012.12.004
768
Russom, P. (2013) Managing big data. TDWI Best Practices Report, TDWI Research, Vol., No., pp. 769
1-40. Available via:
770
https://www.pentaho.com/sites/default/files/uploads/resources/tdwi_best_practices_report-771
27 Seddon, P. B., Constantinidis, D., Tamm, T., and Dod, H. (2016) How Does Business Analytics 773
Contribute to Business Value?, Information Systems Journal, DOI: 10.1111/isj.12101.
774
Schiller, J. J., Srinivasan, A. R. and Spiegel, M. R. (2013) Schaum's Outline of Probability and 775
Statistics, 4th Edition, London: McGraw-Hill. ISBN: 978-0-07-179558-9. 776
Shollo, A., and Galliers, R. D. (2016) Towards an Understanding of the Role of Business Intelligence 777
Systems in Oganisational Knowing, Information Systems Journal, Vol. 26, pp. 339–367. 778
DOI: 10.1111/isj.12071.
779
Smith, L., Ronsenzweig, L. and Schmidt, M. (2010) Best Practices in the Reporting of Participatory 780
Action Research: Embracing Both the Forest and the Trees, The Counseling Psychologist, Vol. 781
38, No. 8, pp. 1115–1138. DOI: 10.1177/0011000010376416
782
Solihin, W., Eastman, C., and Lee, Y. C. (2016) A Framework for Fully Integrated Building 783
Information Models in a Federated Environment. Advanced Engineering Informatics, Vol. 30, 784
No. 2, pp. 168-189. DOI: 10.1016/j.aei.2016.02.007
785
Solihin, W. and Eastman, C. (2015) Classification Rules for Automated BIM Rule Checking 786
Development, Automation in Construction, Vol. 53, pp. 68-82. DOI:
787
http://dx.doi.org/10.1016/j.autcon.2015.03.003
788
Son, H., Bosche, F. and Kim, C. (2015) As-built Data Acquisition and its Use in Production 789
Monitoring and Automated Layout of Civil Infrastructure: A Survey, Advanced Engineering 790
Informatics, Vol. 29, No. 2, pp. 172-183. DOI: http://dx.doi.org/10.1016/j.aei.2015.01.009
791
Succar, B., Sher, W. and Williams, A (2013) An Integrated Approach to BIM Competency 792
Assessment, Acquisition and Application, Automation in Construction, Vol. 35, p. 174-189. 793
DOI: http://dx.doi.org/10.1016/j.autcon.2013.05.016 794
Teizer, J. (2015) Status Quo and Open Challenges in Vision-Based Sensing and Tracking Of 795
Temporary Resources on Infrastructure Construction Sites, Advanced Engineering Informatics, 796
Vol. 29, No. 2, pp. 225–238. DOI: http://dx.doi.org/10.1016/j.aei.2015.03.006
797
Wetzel, E.M. and Thabet, W.Y. (2016) Utilizing Six Sigma to Develop Standard Attributes for a 798
Safety for Facilities Management (SFFM) Framework, Safety Science, Vol. 89, pp. 355–368. 799
DOI: http://dx.doi.org/10.1016/j.ssci.2016.07.010
800
Whang, S., Flanagan, R., Kim, S. and Kim, S. (2016) Contractor-Led Critical Design Management 801
Factors in High-Rise Building Projects Involving Multinational Design Teams. Journal of 802
Construction Engineering and Management. DOI: 10.1061/(ASCE)CO.1943-7862.0001242
28 Wheelan, C. (2013) Naked Statistics: Stripping the Dread from the Data, London: W.W. Norton and 804
Company. ISBN: 978-0-393-07195-5. 805
Wittmayer, J.M. and Schäpke, N. (2014) Action, Research and Participation: Roles of Researchers 806
in Sustainability Transitions, Sustainability Science, Vol. 9, No. 4, pp. 483-496. DOI: 807
10.1007/s11625-014-0258-4
808
Won, J., and Lee, G. (2016) How to tell if a BIM project is successful: A goal-driven approach. 809
Automation in Construction, Vol. 69, No., pp. 34-43. DOI:
810
http://dx.doi.org/10.1016/j.autcon.2016.05.022
811
Wong, J.K.W. and Zhou, J. (2015) Enhancing Environmental Sustainability Over Building Life 812
Cycles Through Green BIM: A Review, Automation in Construction, Vol. 57, pp. 156-165. 813
DOI: http://dx.doi.org/10.1016/j.autcon.2015.06.003
814
Yang, J., Park, M-W., Vela, P.A. and Golparvar-Fard, M. (2015) Construction Performance 815
Monitoring via Still Images, Time-lapse Photos, and Video Streams: Now, Tomorrow, and the 816
Future, Advanced Engineering Informatics, Vol. 29, No. 2, pp. 211-244. DOI:
817
http://dx.doi.org/10.1016/j.aei.2015.01.011
29 Figure 1 – Proposed Extension of Mary Seacole Building (Sheppard Robson Architects)
823
30 Figure 2 – Client Requirement Processes Adopted for Fortnightly Clash Detections.
827
31 Figure 3a - Structural vs. MEP Clashes in Autodesk Navisworks (MEP service in Column) 829
830
Figure 3b - Structural vs. MEP Clashes in Autodesk Navisworks (MEP Service in Beam) 831